Index Statistics and Session Level Analysis MT5
- Indicators
-
Lee Samson
 Have been trading since 1998, started in stocks and indices before moving over to Forex after around 5 years. Have been on the journey learning to trade like most traders, taking countless courses and trying every indicator and strategy under the sun.
 - Version: 1.0
- Activations: 10
Stop Guessing. Start Trading with a Statistical Edge.
Stock indices don't trade like forex. They have defined sessions, they gap overnight, and they follow predictable statistical patterns. This indicator gives you the probability data you need to trade indices like the DAX, S&P 500, and Dow Jones with confidence.
What Makes This Different
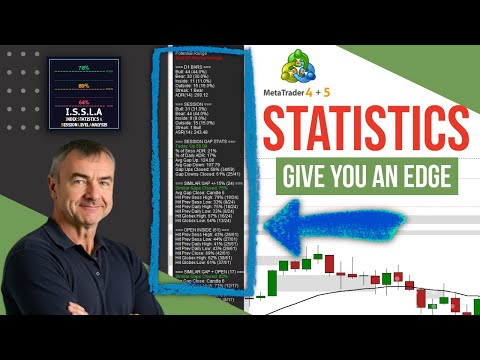
Most indicators show you what happened. This one shows you what's likely to happen next. Every trading day, the indicator analyses your current setup against 100 days of historical data. It finds days with similar gaps, similar opening positions, and calculates exactly how often price reached key levels. No more guessing whether the gap will fill or if yesterday's high will be tested. You get hard percentages based on real data.
Full manual with all inputs explained here: https://www.mql5.com/en/blogs/post/766370
Strategy guide to help you find great setups here: https://www.mql5.com/en/blogs/post/766371
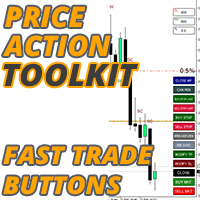
Pair this with the Risk Reward Calculation + Fast Trade Management Buttons EA For Effortless Stock Index Day Trading - https://www.mql5.com/en/market/product/78020
MT4 Version: https://www.mql5.com/en/market/product/158934/
Key Features
- Session-filtered calculations that ignore overnight noise.
- Automatic detection of bullish or bearish control.
- Gap analysis showing historical fill rates. Pattern matching that finds statistically similar days. Probability percentages for hitting previous session highs, lows, daily levels, and weekly levels.
- All key price levels drawn automatically with one-click toggle buttons.
How Traders Use It
A gap down opens 15% of average daily range below yesterday's close. The indicator shows that 82% of similar gaps closed during the session, typically by candle 8. You buy near the open, targeting the gap fill, and take profits within the first hour.
Price opens below yesterday's session range. Historical data shows 0% of similar days ever reached yesterday's high. You avoid holding longs expecting new highs and instead focus on downside targets where the probability favours you.
The indicator detects Bears in Control after three consecutive strong bearish closes. Combined with price below the session moving average, you have confirmation to hold short positions and sell rallies.
Built for Serious Index Traders
Fourteen toggle buttons let you show or hide any element instantly. The statistics panel auto-sizes based on content. Candles are numbered from session open so you always know where you are in the day. Bar 18 is highlighted because statistically, 80% of the daily range is established by that point.
Trade Smarter
When you know that 75% of days matching your current setup hit the previous daily low, you trade differently. When you know only 17% reached the previous close, you set realistic targets. This indicator transforms how you approach each trading day by replacing hunches with probabilities.
Works best on M5 timeframe. Optimised for DAX, S&P 500, Dow Jones, Nasdaq, and FTSE 100.
Perfect For Al Brooks Reading Price Action Students
Incorporated into the indicator is a candle numbering system that follows the same methodology taught by Al Brooks along with all the extra statistical data to help you read price action like a professional. It also has a multi bar run logic which will help you identify whether the bulls or bears are in control of the market. Multiple candles in a row the same colour? Wait for a pullback against that direction and jump on the trend. Fully configurable to your liking with candle strength and number of consecutive candles inputs.