Watch the Market tutorial videos on YouTube
How to buy а trading robot or an indicator
Run your EA on
virtual hosting
virtual hosting
Test аn indicator/trading robot before buying
Want to earn in the Market?
How to present a product for a sell-through
Technical Indicators for MetaTrader 5

New Update of Smart Trend Trading System MT5 For 2026 Market: If You Buy this Indicator you will Get my Professional Trade Manager + EA for FREE . First of all Its worth emphasizing here that this Trading System is Non-Repainting , Non Redrawing and Non Lagging Indicator Which makes it ideal from both manual and robot trading . [Online course] , [manual] and [download presets] . The Smart Trend Trading System MT5 is a comprehensive trading solution tailored for new and experienced traders

Each buyer of this indicator also receives the following for free:
The custom utility "Bomber Utility", which automatically manages every trade, sets Stop Loss and Take Profit levels, and closes trades according to the rules of this strategy Set files for configuring the indicator for various assets Set files for configuring Bomber Utility in the following modes: "Minimum Risk", "Balanced Risk", and "Wait-and-See Strategy" A step-by-step video manual to help you quickly install, configure, and s

Gold Sniper Scalper Pro - Gold (XAU/USD) Trading System on MetaTrader 5 For the serious trader: Approach Gold trading with a structured, data-driven methodology that combines multiple market analysis factors. This tool is built to support your Gold trading analysis. Limited Price Opportunity This is a chance to own Gold Sniper Scalper Pro before the price increases. The product price will increase by $50 after every 10 subsequent purchases. Final Price: $498 Features That Define Your Analytical
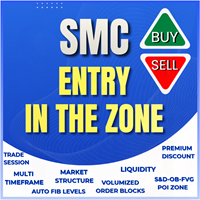
Entry In The Zone and SMC Multi Timeframe is a real-time market analysis tool developed based on Smart Money Concepts (SMC). It is designed to help traders analyze market structure systematically and gain a clearer view of overall market direction. The system analyzes Reversal Points, Key Zones, and Market Structure across multiple timeframes, while displaying Point Of Interest (POI) , No Repaint Signals, and Auto Fibonacci Levels to help detect pullbacks and reversal points with precision. Real

ARIPoint is a powerful trading companion designed to generate high-probability entry signals with dynamic TP/SL/DP levels based on volatility. Built-in performance tracking shows win/loss stats, PP1/PP2 hits, and success rates all updated live. Key Features: Buy/Sell signals with adaptive volatility bands Real-time TP/SL/DP levels based on ATR Built-in MA Filter with optional ATR/StdDev volatility Performance stats panel (Success, Profit/Loss, PP1/PP2) Alerts via popup, sound, push, or email Cu

New Update of Atomic Analyst MT5 For 2026 Market: If You Buy this Indicator you will Get my Professional Trade Manager + EA for FREE . First of all Its worth emphasizing here that this Trading Indicator is Non-Repainting , Non Redrawing and Non Lagging Indicator Indicator, Which makes it ideal from both manual and robot trading.
User manual: settings, inputs and strategy . The Atomic Analyst is a PA Price Action Indicator that uses Strength and Momentum of the price to find a bet

Smart Stop Indicator – Intelligent Stop-Loss Precision Directly on Your Chart Overview
The Smart Stop Indicator is the tailored solution for traders who want to place their stop loss clearly and methodically instead of guessing or relying on gut feeling. This tool combines classic price-action logic (higher highs, lower lows) with modern breakout recognition to identify where the next logical stop level truly is. Whether in trending markets, ranges, or fast breakout phases, the indicator displ

FX Power: Analyze Currency Strength for Smarter Trading Decisions Overview
FX Power is your go-to tool for understanding the real strength of currencies and Gold in any market condition. By identifying strong currencies to buy and weak ones to sell, FX Power simplifies trading decisions and uncovers high-probability opportunities. Whether you’re looking to follow trends or anticipate reversals using extreme delta values, this tool adapts seamlessly to your trading style. Don’t just trade—trade

Unlock the Power of Trends Trading with the Trend Screener Indicator: Your Ultimate Trend Trading Solution powered by Fuzzy Logic and Multi-Currencies System! Elevate your trading game with the Trend Screener, the revolutionary trend indicator designed to transform your Metatrader into a powerful Trend Analyzer. This comprehensive tool leverages fuzzy logic and integrates over 13 premium features and three trading strategies, offering unmatched precision and versatility. LIMITED TIME OFFER : Tre

Game Changer is a revolutionary trend indicator designed to be used on any financial instrument to transform your metatrader in a powerful trend analyzer. The indicator does not redraw and does not lag. It works on any time frame and assists in trend identification, signals potential reversals, serves as a trailing stop mechanism, and provides real-time alerts for prompt market responses. Whether you’re a seasoned, professional or a beginner seeking an edge, this tool empowers you to trade wi

Introducing Quantum TrendPulse , the ultimate trading tool that combines the power of SuperTrend , RSI , and Stochastic into one comprehensive indicator to maximize your trading potential. Designed for traders who seek precision and efficiency, this indicator helps you identify market trends, momentum shifts, and optimal entry and exit points with confidence. Key Features: SuperTrend Integration: Easily follow the prevailing market trend and ride the wave of profitability. RSI Precision: Detect

The Trend Catcher: Download this Indicator you will Get my Professional Trade Manager + EA for FREE . The Trend Catcher Strategy with Alert Indicator is a versatile technical analysis tool that aids traders in identifying market trends and potential entry and exit points. It features a dynamic Trend Catcher Strategy , adapting to market conditions for a clear visual representation of trend direction. Traders can customize parameters to align with their preferences and risk tolerance. The in
FREE
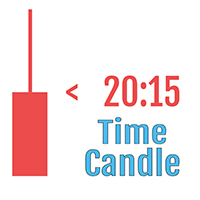
try and test AI Forecasts MT5: https://www.mql5.com/en/market/product/154838
and test Shock Pullback v 3.5 + AI/ML forecasts : https://www.mql5.com/en/market/product/145042 Important Note: The image shown in Screenshots is of my 2 indicators, first one with Shock Pullback V 3.3 indicator , and other for Suleiman Levels and RSI Trend V indicator, including of course attached "Time Candle", which is originally part of the comprehensive indicator for advanced analysis and exclusive levels
FREE

Let me introduce you to an excellent technical indicator – Grabber, which works as a ready-to-use "All-Inclusive" trading strategy.
Within a single code, it integrates powerful tools for technical market analysis, trading signals (arrows), alert functions, and push notifications. Every buyer of this indicator also receives the following for free: Grabber Utility for automatic management of open orders Step-by-step video guide: how to install, configure, and trade with the indicator Custom set fi

The Supply and Demand Order Blocks: The "Supply and Demand Order Blocks" indicator is a sophisticated tool based on Smart Money Concepts, fundamental to forex technical analysis. It focuses on identifying supply and demand zones, crucial areas where institutional traders leave significant footprints. The supply zone, indicating sell orders, and the demand zone, indicating buy orders, help traders anticipate potential reversals or slowdowns in price movements. This indicator employs a clever algo
FREE

- Real price is 80$ - 45% Discount (It is 45$ now) Contact me for extra bonus indicator, instruction or any questions! - Lifetime update free - Non-repaint - Related product: Gann Gold EA - I just sell my products in Elif Kaya Profile, any other websites are stolen old versions, So no any new updates or support. Advantages of M1 Scalper Pro Profitability: M1 Scalper Pro is highly profitable with a strict exit strategy. Frequent Opportunities: M1 Scalper Pro takes advantage of numerous smal

First of all Its worth emphasizing here that this Trading Tool is Non Repainting , Non Redrawing and Non Lagging Indicator , Which makes it ideal for professional trading . Online course, user manual and demo. The Smart Price Action Concepts Indicator is a very powerful tool for both new and experienced traders . It packs more than 20 useful indicators into one , combining advanced trading ideas like Inner Circle Trader Analysis and Smart Money Concepts Trading Strategies . This indicator focus

Top indicator for MT5 providing accurate signals to enter a trade without repainting! It can be applied to any financial assets: forex, cryptocurrencies, metals, stocks, indices . Watch the video (6:22) with an example of processing only one signal that paid off the indicator! MT4 version is here It will provide pretty accurate trading signals and tell you when it's best to open a trade and close it. Most traders improve their trading results during the first trading week with the help of

SynaptixQuant Dominance Matrix: Institutional-Grade Market State Extraction
Engineered for traders who require a data-driven view of market behaviour beyond surface-level indicators. The Synaptix Quant (SQ) Dominance Matrix is not a conventional currency strength display. Behind its intentionally streamlined interface runs a sophisticated analytical architecture designed to quantify market conditions with precision. Every output is generated through layered signal processing built to identify d

Critical Zones has been created especially for manual traders looking for more accurate market entries. This indicator uses advanced algorithms to detect areas of interest by calculating the most relevant support and resistance on the chart as well as their breakouts and retests. This indicator can be configured to send alerts and notifications when potentially lucrative buy/sell opportunities are detected, allowing traders to stay on top of trading opportunities even when they are not in fro
FREE

Trend Ai indicator mt5 is great tool that will enhance a trader’s market analysis by combining trend identification with actionable entry points and reversal alerts. This indicator empowers users to navigate the complexities of the forex market with confidence and precision
Beyond the primary signals, Trend Ai indicator identifies secondary entry points that arise during pullbacks or retracements, enabling traders to capitalize on price corrections within the established trend. Important Advan

FX Volume: Experience Genuine Market Sentiment from a Broker’s Perspective Quick Overview
Looking to elevate your trading approach? FX Volume provides real-time insights into how retail traders and brokers are positioned—long before delayed reports like the COT. Whether you’re aiming for consistent gains or simply want a deeper edge in the markets, FX Volume helps you spot major imbalances, confirm breakouts, and refine your risk management. Get started now and see how genuine volume data can

Candle Timer Countdown displays the remaining time before the current bar closes and a new bar forms. It can be used for time management. MT4 version here!
Feature Highlights Tracks server time not local time Configurable Text Color and Font Size Optional Visualization of the Symbol Daily Variation Optimized to reduce CPU usage Input Parameters Show Daily Variation: true/false Text Font Size Text Color
If you still have questions, please contact me by direct message: https://www.mql5.com/en/u
FREE

Buy TREND PRO now and get another advanced trend indicator for free
To receive, write in private messages. ИНСТРУКЦИЯ RUS - INSTRUCTIONS ENG - VERSION MT4 Main functions: Accurate entry signals WITHOUT REPAINTING! Once a signal appears, it remains valid! This is a significant distinction from repainting indicators that might provide a signal and then alter it, potentially leading to deposit losses. Now, you can enter the market with higher probability and precision. There's also a f

How many times have you bought a trading indicator with great back-tests, live account performance proof with fantastic numbers and stats all over the place but after using it, you end up blowing your account? You shouldn't trust a signal by itself, you need to know why it appeared in the first place, and that's what RelicusRoad Pro does best! User Manual + Strategies + Training Videos + Private Group with VIP Access + Mobile Version Available
A New Way To Look At The Market
RelicusRoad is the

Over 100,000 users on MT4 and MT5 Blahtech Candle Timer displays the remaining time before the current bar closes and a new bar forms. It can be used for time management Links [ Install | Update | Training ] Feature Highlights
The only candle timer on MT5 with no stutter and no lag S electable Location Tracks server time not local time Multiple colour Schemes Configurable Text Customisable alerts and messages Optimised to reduce CPU usage Input Parameters Text Location - Beside / Upper Le
FREE
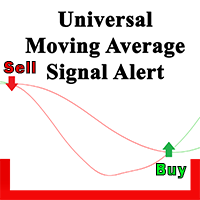
If you trade with moving averages, this indicator will be your best assistant. Here's what it can do: it shows signals when two moving averages intersect (for example, a fast moving average breaks through a slow moving average from bottom to top - growth is possible). It notifies you in all ways: it beeps in the terminal, sends a notification to your phone and an email to your email — now you definitely won't miss a deal. It can be flexibly adjusted: you can choose exactly how to calculate the m
FREE

The Support and Resistance Levels Finder: The Support and Resistance Levels Finder is an advanced tool designed to enhance technical analysis in trading. Featuring dynamic support and resistance levels, it adapts in real-time as new key points unfold on the chart, providing a dynamic and responsive analysis. Its unique multi-timeframe capability allows users to display support and resistance levels from different timeframes on any desired timeframe, offering a nuanced perspective, such as showi
FREE

ATy Gold and BTC Join my MQL5 channel to update the latest news from me. My community of over 80,000 members on MQL5
ATbot : How It Works and How to Use It How It Works The "AtBot" indicator for the MT5 platform generates buy and sell signals using a combination of technical analysis tools. It integrates Simple Moving Average (SMA), Exponential Moving Average (EMA), and the Average True Range (ATR) index to identify trading opportunities. Additionally, it can utilize Heikin Ashi candles to en
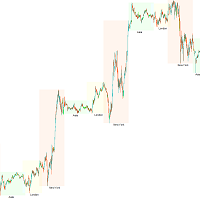
Trading Session ICT KillZone — Unlock the Power of Market Timing Successful traders know one truth: timing is everything. Different trading sessions bring different levels of activity, volatility, and opportunities. To help you clearly see and take advantage of these shifts, we created the Trading Session KillZone Indicator. This indicator highlights the active times of the Asian, London, and New York sessions, giving you a complete picture of when the market is most alive. You can customize th
FREE

The Trading Sessions Time Indicator: The "Trading Sessions Time Indicator" is a powerful technical analysis tool designed to enhance your understanding of different trading sessions in the forex market. This seamlessly integrated indicator provides crucial information about the opening and closing times of major sessions, including Tokyo, London, and New York. With automatic time zone adjustment, it caters to traders globally, helping them optimize their trading schedules for high liquidity per
FREE

MT4 Version
Golden Hunter has been developed for traders who trade manually in the markets. It is a very powerful tool consisting of 3 different indicators: Powerful entry strategy: Formed by an indicator that measures the volatility of the currency pair and identifies the market trend. LSMA: Smoothes the price data and is useful to detect the short term trend. Heikin Ashi: Once the indicator is attached to the chart, the Japanese candlesticks will change to Heikin Ashi candlesticks. This
FREE

Was: $299 Now: $99 Supply Demand uses previous price action to identify potential imbalances between buyers and sellers. The key is to identify the better odds zones, not just the untouched ones. Blahtech Supply Demand indicator delivers functionality previously unavailable on any trading platform. This 4-in-1 indicator not only highlights the higher probability zones using a multi-criteria strength engine, but also combines it with multi-timeframe trend analysis, previously confirmed swings a

FX Levels: Exceptionally Accurate Support & Resistance for All Markets Quick Overview
Looking for a reliable way to pinpoint support and resistance levels across any market—currencies, indices, stocks, or commodities? FX Levels merges our traditional “Lighthouse” method with a forward-thinking dynamic approach, offering near-universal accuracy. By drawing from real-world broker experience and automated daily plus real-time updates, FX Levels helps you identify reversal points, set profit targe

Gold Entry Sniper – Professional Multi-Timeframe ATR Dashboard for Gold Scalping & Swing Trading Gold Entry Sniper is a cutting-edge MetaTrader 5 indicator designed to give traders precise buy/sell signals for XAUUSD and other symbols, powered by ATR Trailing Stop logic and a multi-timeframe analysis dashboard . Built for both scalpers and swing traders, it combines real-time market direction , dynamic stop levels , and professional visual dashboards to help you identify high-probability gold en
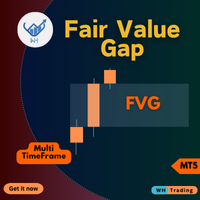
Experience trading like never before with our unparalleled Fair Value Gap MT5 Indicator,(FVG)
hailed as the best in its class. This MQL5 market indicator goes beyond the ordinary,
providing traders with an unmatched level of accuracy and insight into market dynamics. EA Version: WH Fair Value Gap EA MT5
SMC Based Indicator : WH SMC Indicator MT5
Features:
Best-in-Class Fair Value Gap Analysis. Multi-TimeFrame Support. Customization. Real-time Alerts. User-Friendly Perfection Seamless Compa
FREE

IX Power: Unlock Market Insights for Indices, Commodities, Cryptos, and Forex Overview
IX Power is a versatile tool designed to analyze the strength of indices, commodities, cryptocurrencies, and forex symbols. While FX Power offers the highest precision for forex pairs by leveraging all available currency pair data, IX Power focuses exclusively on the underlying symbol’s market data. This makes IX Power an excellent choice for non-forex markets and a reliable option for forex charts when deta
The Trend Line PRO indicator is an independent trading strategy. It shows the trend change, the entry point to the transaction, as well as automatically calculates three levels of Take Profit and Stop Loss protection.
Trend Line PRO is perfect for all Meta Trader symbols: currencies, metals, cryptocurrencies, stocks and indices. The indicator is used in trading on real accounts, which confirms the reliability of the strategy. Robots using Trend Line PRO and real Signals can be found here:

Support And Resistance Screener Breakthrough unique Solution With All Important levels analyzer and Markets Structures Feature Built Inside One Tool ! Our indicator has been developed by traders for traders and with one Indicator you will find all Imporant market levels with one click.
LIMITED TIME OFFER : Support and Resistance Screener Indicator is available for only 50 $ and lifetime. ( Original price 125$ ) (offer extended) The available tools ( Features ) in our Indicator are : 1. HH-LL S

Was: $249 Now: $99 Market Profile defines a number of day types that can help the trader to determine market behaviour. A key feature is the Value Area, representing the range of price action where 70% of trading took place. Understanding the Value Area can give traders valuable insight into market direction and establish the higher odds trade. It is an excellent addition to any system you may be using. Inspired by Jim Dalton’s book “Mind Over Markets”, this indicator is designed to suit the

Introducing Quantum Trend Sniper Indicator , the groundbreaking MQL5 Indicator that's transforming the way you identify and trade trend reversals! Developed by a team of experienced traders with trading experience of over 13 years, Quantum Trend Sniper Indicator is designed to propel your trading journey to new heights with its innovative way of identifying trend reversals with extremely high accuracy.
***Buy Quantum Trend Sniper Indicator and you could get Quantum Breakout Indicator for
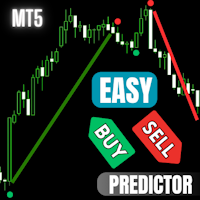
Easy Buy Sell is a market indicator for opening and closing positions. It becomes easy to track market entries with alerts.
It indicates trend reversal points when a price reaches extreme values and the most favorable time to enter the market. it is as effective as a Fibonacci to find a level but it uses different tools such as an algorithm based on ATR indicators and Stochastic Oscillator. You can modify these two parameters as you wish to adapt the settings to the desired period. It cannot
FREE

Discover the LT Regression Channel, a powerful technical indicator that combines elements of Fibonacci analysis, Envelope analysis, and Fourier extrapolation. This indicator is designed to assess market volatility while enhancing precision in identifying overbought and oversold levels through Fibonacci analysis. It also leverages Fourier extrapolation for predicting market movements by integrating data from these indicators. Our versatile tool can be used independently or in combination with oth
FREE

Fair Value Gap (FVG) Indicator Overview The Fair Value Gap (FVG) Indicator identifies inefficiencies in price action where an imbalance occurs due to aggressive buying or selling. These gaps are often created by institutional traders and smart money, leaving areas where price may later return to "fill" the imbalance before continuing its trend. Key Features: Automatic Detection of FVGs – The indicator highlights fair value gaps across different timeframes. Multi-Timeframe Support – View FVGs fr
FREE

ARIScalp is a powerful trading companion designed to generate high-probability entry signals with dynamic TP/SL/DP levels based on volatility. Built-in performance tracking shows win/loss stats, PP1/PP2 hits, and success rates all updated live. Key Features: Buy/Sell signals with adaptive volatility bands Real-time TP/SL/DP levels based on ATR Built-in MA Filter with optional ATR/StdDev volatility Performance stats panel (Success, Profit/Loss, PP1/PP2) Alerts via popup, sound, push, or email Cus

If you like this project, leave a 5 star review. Volume-weighted average price is the ratio of the value traded to total volume
traded over a particular time horizon. It is a measure of the average price at
which a stock is traded over the trading horizon. VWAP is often used as a
trading benchmark by investors who aim to be as passive as possible in their
execution. With this indicator you will be able to draw the VWAP for the: Current Day. Current Week. Current Month. Current Quarter. Current Y
FREE

I recommend you to read the product's blog (manual) from start to end so that it is clear from the beginning what the indicator offers. The indicator comes with a fully functional Expert Advisor. The indicator identifies when a divergence occurs between price and an oscillator/indicator. It identifies both regular and hidden divergences. It has a RSI, Bollinger Bands and ATR filter options which makes it possible to filter out only the strongest setups. The indicator also offers options to

The Trend Forecaster indicator utilizes a unique proprietary algorithm to determine entry points for a breakout trading strategy. The indicator identifies price clusters, analyzes price movement near levels, and provides a signal when the price breaks through a level. The Trend Forecaster indicator is suitable for all financial assets, including currencies (Forex), metals, stocks, indices, and cryptocurrencies. You can also adjust the indicator to work on any time frames, although it is recommen

The Haven FVG indicator is a market analysis tool that highlights inefficiency areas (Fair Value Gaps, FVG) on the chart, providing traders with key levels for price analysis and decision-making. Other products -> HERE Main Features: Customizable color settings: Color for Bullish FVG (Bullish FVG Color). Color for Bearish FVG (Bearish FVG Color). Flexible FVG visualization: Maximum number of candles for FVG detection. Additional extension of FVG zones by a specified number of bars. Opt
FREE

Shock Pullback v 3.5 + AI/ML forecasts:
- Add Integrated Artificial and deep learning have been integrated within the MQL5 environment.
- A qualitative addition for integrated future forecasts using deep learning and artificial intelligence (AI/ML) within MQL5, based on the methodology and operation of the core indicator built on the Shock Pullback and its inherent integrated functions.
- Suitable for scalping trading
How to Use the Indicator Shock Pullback: There are 3 images in the com

Available for MT4 and MT5 . Join the Market Structure Patterns channel to download materials available for study and/or additional informations.
Related posts: Market Structure Patterns - Introdução Market Structure Patterns is an indicator based on smart money concepts that displays SMC/ICT elements that can take your trading decisions to the next level. Take advantage of the alerts , push notifications and email messages to keep informed from when an element is form
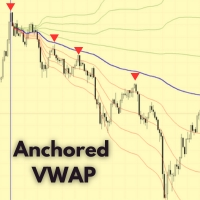
Anchored VWAP Indicator for MetaTrader 5 – Professional Volume Weighted Price Tool The Anchored VWAP Indicator for MT5 provides an advanced and flexible way to calculate the Volume Weighted Average Price (VWAP) starting from any selected candle or event point. Unlike standard VWAP indicators that reset daily, this version allows you to anchor VWAP to any moment, giving traders institutional-level precision for volume analysis , fair value discovery , and trend confirmation . Try the Candle Movem
FREE

Easy Buy Sell is a market indicator for opening and closing positions. It becomes easy to track market entries with alerts.
It indicates trend reversal points when a price reaches extreme values and the most favorable time to enter the market. it is as effective as a Fibonacci to find a level but it uses different tools such as an algorithm based on ATR indicators and Stochastic Oscillator. You can modify these two parameters as you wish to adapt the settings to the desired period. It cannot

Best Solution for any Newbie or Expert Trader! This Indicator is a unique, high quality and affordable trading tool because we have incorporated a number of proprietary features and a new formula. With only ONE chart you can read Currency Strength for 28 Forex pairs! Imagine how your trading will improve because you are able to pinpoint the exact trigger point of a new trend or scalping opportunity? User manual: click here That's the first one, the original! Don't buy a worthless wannabe clone
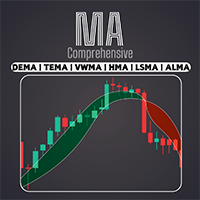
Access a wide range of moving averages, including EMA, SMA, WMA, and many more with our professional Comprehensive Moving Average indicator. Customize your technical analysis with the perfect combination of moving averages to suit your unique trading style / MT4 Version
Features Possibility to activate two MAs with different settings. Possibility to customize chart settings. Possibility to change the color of the candlesticks depending on crossed MAs or price crossed with MAs. Sending of
FREE

The Golden PainX and GainX Spike Indicator is a cutting-edge, AI-powered trading tool engineered exclusively for the synthetic indices market. It masterfully combines proprietary spike detection algorithms and real-time price action analysis to generate high-probability, non-repainting trade signals with exceptional accuracy. Important( Use only on PainX 400and GainX 400 (M1 one minute timeframe) Identifies high-probability spikes with non-repainting buy/sell arrows. Automatically sets profit t
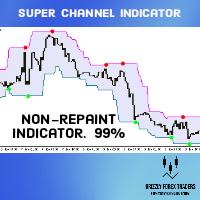
Super Signals Channel Indicator Its channel is a non-repaint indicator that reacts more with recent price movements. For this reason, the Super Signals Channel Indicator is a better match for short-term or day trading strategy. The Super Signals Channel only plots swing trading opportunities. So most of its trade signals appear during consolidation or sidelined periods of the market. Super Signals Channel Indicator for MT5 Explanation The green band below the price shows the dynamic support lev

Special offer : ALL TOOLS , just $35 each! New tools will be $30 for the first week or the first 3 purchases ! Trading Tools Channel on MQL5 : Join my MQL5 channel to update the latest news from me This indicator plots breakout detection zones, referred to as “Smart Breakout Channels”, which are based on volatility-normalized price movement. These zones are shown as dynamic boxes with volume overlays. The tool detects temporary accumulation or distribution ranges using a custom nor
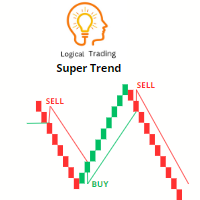
The Super Trend indicator is a popular technical analysis tool used by traders to identify the direction of a trend and potential entry and exit points in the market. It is a trend-following indicator that provides signals based on price action and volatility. The Super Trend indicator consists of two lines - one indicating the bullish trend (usually colored green) and the other indicating the bearish trend (usually colored red). The lines are plotted above or below the price chart, depending on
FREE
Market Structure Order Block Dashboard MT5 Market Structure Order Block Dashboard MT5 is an indicator for MetaTrader 5 that automates the analysis of market structure and ICT / Smart Money concepts. It does not open or manage any trades: it is a visual analysis tool , not a trading robot. What the indicator shows The indicator scans the chart and highlights the following information: Market structure: significant swings, HH, HL, LH, LL Breaks of structure: Break of Structure (BOS) and Change of

FX Dynamic: Track Volatility and Trends with Customized ATR Analysis Overview
FX Dynamic is a powerful tool that leverages Average True Range (ATR) calculations to give traders unparalleled insights into daily and intraday volatility. By setting up clear volatility thresholds—such as 80%, 100%, and 130%—you can quickly identify potential profit opportunities or warnings when markets exceed typical ranges. FX Dynamic adapts to your broker’s time zone, helps you maintain a consistent measure of
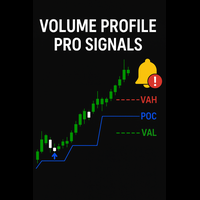
Volume Profile Pro Signals
Precision volume analysis meets automatic signal generation. What It Does
Volume Profile Pro Signals builds a live, data-driven picture of where trading volume truly occurs — exposing market zones where price is accepted or rejected. It highlights POC, VAH, VAL, and identifies HVN/LVN areas with exact accuracy. From that foundation, it generates real-time breakout signals (VAH/VAL) and plots smart SL/TP levels from ATR volatility data. Every component — from profile

The Area of Interest (AOI) Indicator is a powerful tool designed to help traders identify key market zones where price reactions are highly probable. This indicator specifically highlights two critical zones: Seller AOI (Area of Interest) : This zone represents areas where sellers are likely to enter the market, often acting as resistance. When the price approaches or touches this zone, it signals that a potential sell-off could occur. Buyer A OI (Area of Interest) : The BOI zone identifie
FREE

Our Basic Candlestick Patterns indicator makes identifying major candlestick patterns easier than ever. Discover patterns such as the Hammer, the Evening Star, the Three White Soldiers and many more with just a glance at your chart. With an intuitive interface and clear visual cues, our indicator helps you identify trading opportunities quickly and accurately / MT4 version Dashboard Scanner for this indicator: ( Basic Candlestick Patterns Dashboard )
Features
Accuracy : Automatically iden
FREE

Smart Volume Profile is a professional volume profile indicator that calculates and displays in real time the distribution of volumes between two vertical lines, with buy/sell split and POC, VAH, VAL levels. Designed for both discretionary and systematic trading, it allows you to see where the market traded the most and how buying and selling pressure was distributed within the selected period. Why this indicator Full control of the analysis period thanks to two draggable VLINEs that define the
FREE
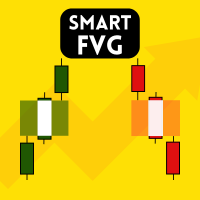
Smart FVG Indicator MT5 – Fair Value Gap and Imbalance Detection Smart FVG Indicator MT5 is a professional Fair Value Gap (FVG) and Imbalance detection tool for MetaTrader 5 . It is designed for traders who use Smart Money Concepts (SMC) and ICT-style analysis to study market structure, liquidity and price inefficiencies. The indicator automatically scans price action to find valid Fair Value Gaps and Imbalance zones , then draws and updates these zones directly on the chart. This helps you see
FREE
** All Symbols x All Time frames scan just by pressing scanner button ** After 18 years of experience in the markets and programming, Winner indicator is ready. I would like to share with you! *** Contact me to send you " Trend Finder indicator " free, instruction and add you in "M1 Signal Scanner group" for sharing or seeing experiences with other users. Introduction: M1 Signal Scanner is the indicator designed scalping M1 time frame to detect Small trend switching in the direction

AriX Indicator for MT5
A powerful trend-following and signal-evaluation tool AriX is a custom MT5 indicator that combines Moving Averages and ATR-based risk/reward logic to generate clear buy/sell signals. It visualizes dynamic SL/TP levels, evaluates past trade outcomes, and displays win/loss statistics in a clean on-chart panel. Key features include: Buy/Sell signals based on MA crossovers ATR-based SL/TP1/TP2/TP3 levels with visual lines and labels Signal outcome tracking with real-time stat
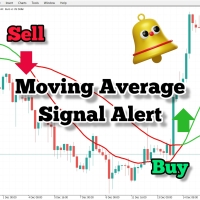
Ultimate Moving Average Crossover Alert Indicator Unlock the power of moving averages with our sophisticated crossover alert indicator, designed to enhance your trading strategy and ensure you never miss a crucial signal. Key Features Our Moving Average Crossover Alert Indicator is essential for traders who rely on moving averages. It not only identifies crossovers but also provides multiple forms of alerts to keep you informed, wherever you are. 1. Real-Time Alerts: Crossover Notifications: Re
FREE
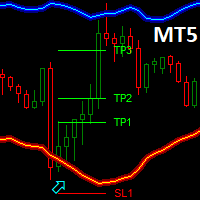
Dark Bands is an Indicator for intraday trading. This Indicator is based on Counter Trend strategy but use also Volatility. We can enter in good price with this Indicator, in order to follow the inversions on the current instrument.
Key benefits
Easily visible take profit/stop loss lines Reliable bands lines with futuristic colors, and Intuitive directional arrows Useful statistics , which indicate the win rate of the signals Plus Package available, leave a feedback to receive it for fr
FREE
The MetaTrader Market is the only store where you can download a free demo trading robot for testing and optimization using historical data.
Read the application overview and reviews from other customers, download it right to your terminal and test a trading robot before you buy. Only on the MetaTrader Market you can test an application absolutely free of charge.
You are missing trading opportunities:
- Free trading apps
- Over 8,000 signals for copying
- Economic news for exploring financial markets
Registration
Log in
If you do not have an account, please register
Allow the use of cookies to log in to the MQL5.com website.
Please enable the necessary setting in your browser, otherwise you will not be able to log in.