
Blahtech Supply Demand MT5
- Indicators
-
Blahtech Limited
 Professional IT developer with over 20 years of experience working with top tier investment banks (Barclays Capital, Credit Suisse, Merrill Lynch, ABN Amro, Mizuho Bank) - LinkedIn profile available on request
 - Version: 4.3
- Updated: 2 July 2024
- Activations: 16
Was: $299 Now: $99
Supply Demand uses previous price action to identify potential imbalances between buyers and sellers. The key is to identify the better odds zones, not just the untouched ones.
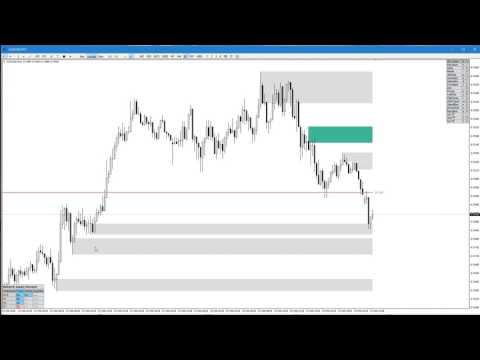
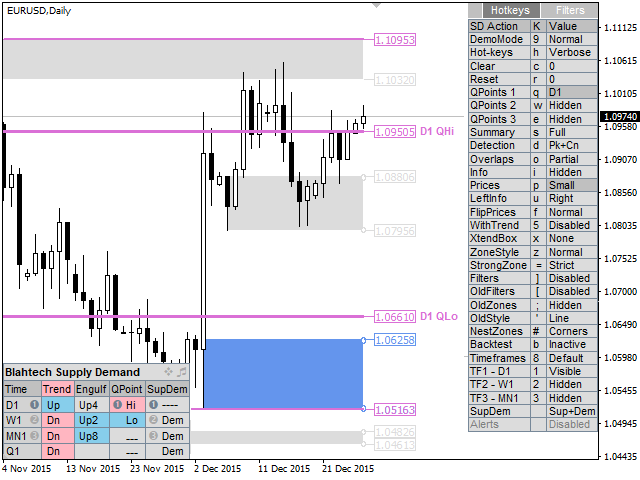
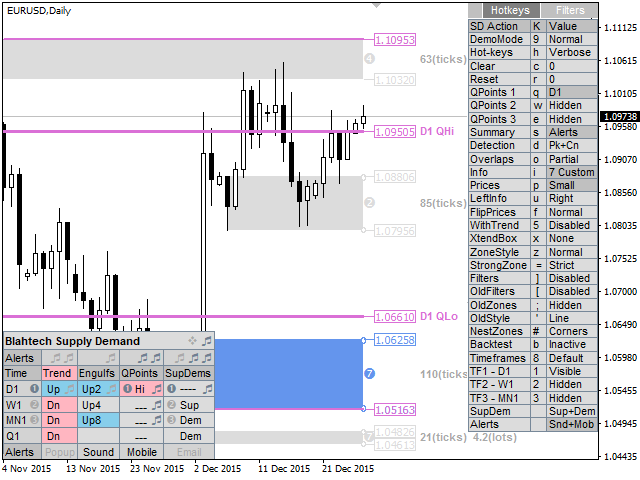
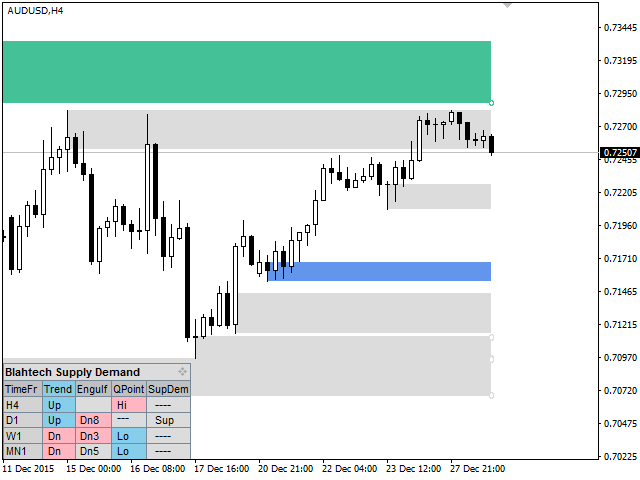
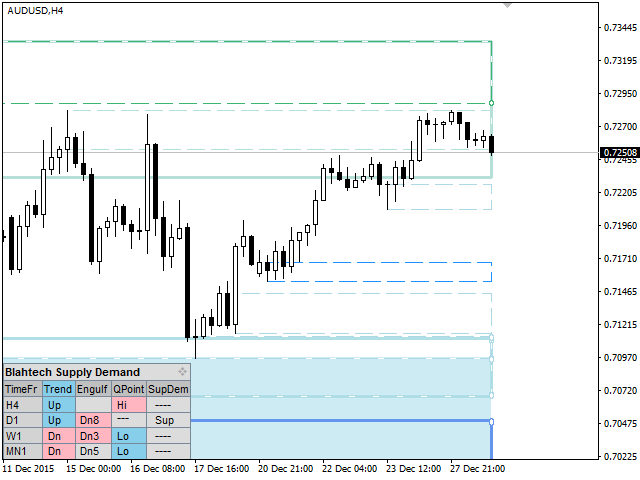
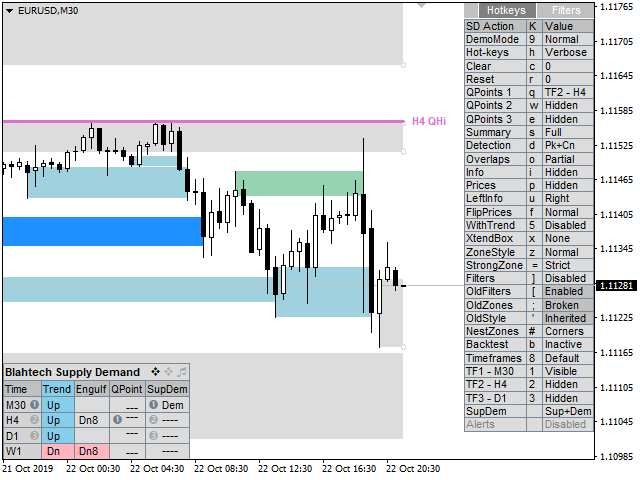
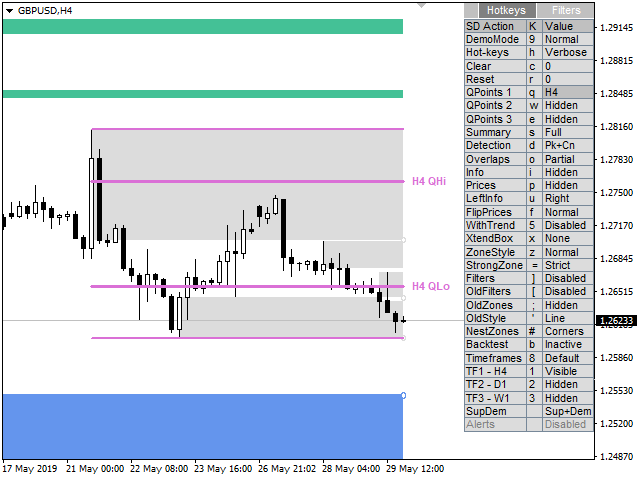
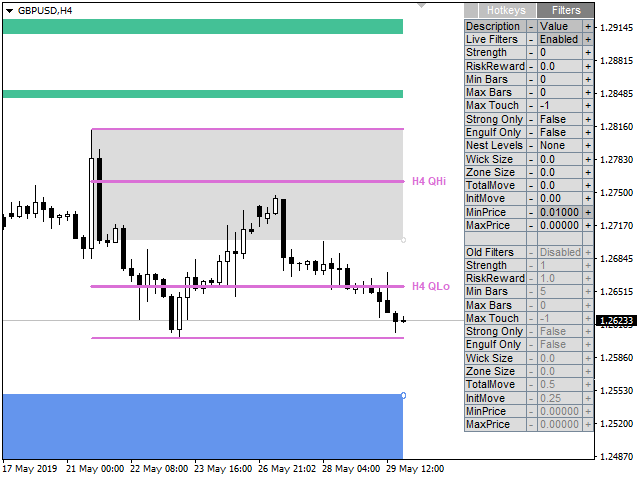
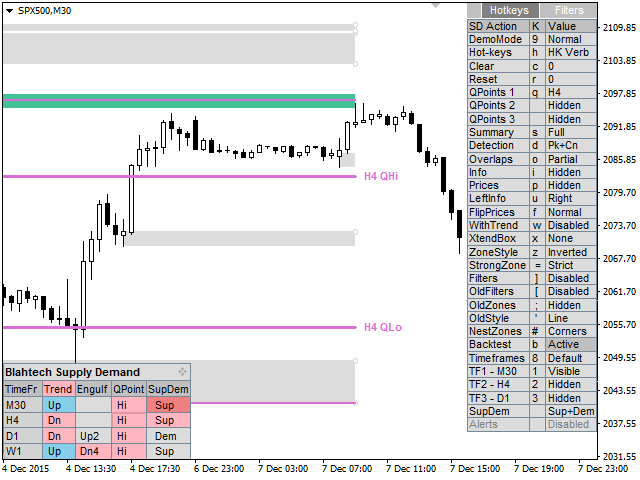
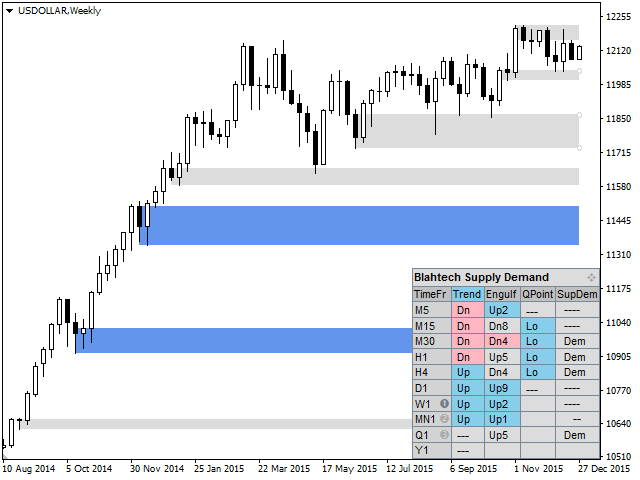
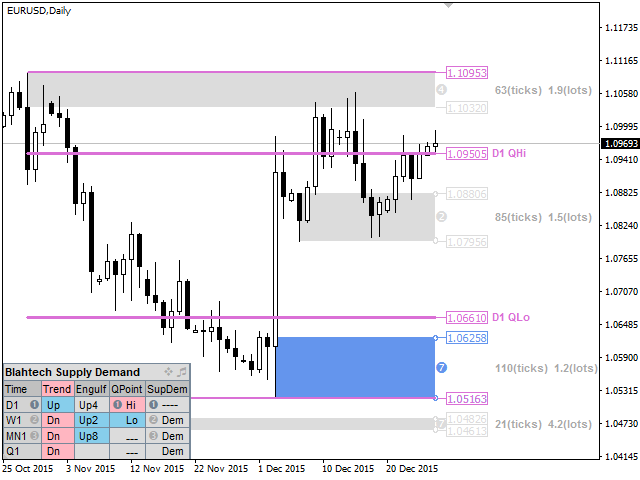
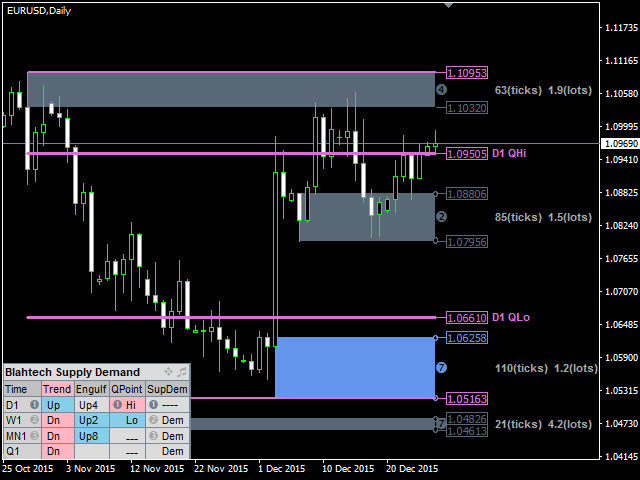
Blahtech Supply Demand indicator delivers functionality previously unavailable on any trading platform. This 4-in-1 indicator not only highlights the higher probability zones using a multi-criteria strength engine, but also combines it with multi-timeframe trend analysis, previously confirmed swings and engulfing detectors. Driven by an easy to use interface and innovative backtest mode this indicator is a must-have for all supply demand traders.
Links [ Install | Update | Documentation & Training ]
Feature Highlights
- Multi-timeframe display
- Backtest directly on the chart
- Summary panel
- Multi-timeframe trend analysis
- Confirmed swings (High and Low QPoints)
- Zone strength engine (seven criteria)
Feature Highlights continued...
- Advanced level detection (peaks, consolidations, drop-base-drops)
- Fast access hot-keys
- Alerts
- Engulfing detector
- Visibility Filters
- Old zones (broken levels or trend changes)
- Highlight of Nested zones
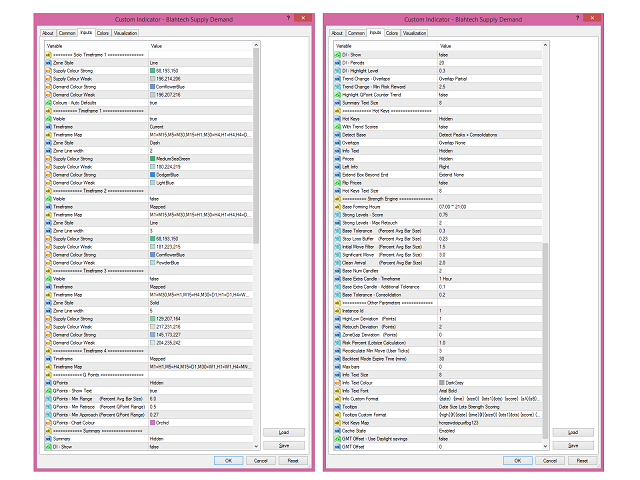
Input Parameters
- Download documentation using link above for details
































































Hello, I'm building an Expert Advisor around Blahtech Supply Demand MT5 (and Blahtech Market Profile MT5) using `iCustom()` buffer reads, per the "Expert Advisor Mode -- Reserved for iCustom calls from an Expert Advisor. Code examples available on request" note in your documentation. I'd like to request those code examples, and also have three specific technical questions that would help me integrate correctly: 1. "Avg Bar Size" calculation Your QPoints parameters (Min Range, Min Retrace, Min Approach) are all expressed as multiples/percentages of "Avg Bar Size." Could you confirm: The exact averaging method (simple average of high-low range? ATR-style? something else?) The lookback window length used I've built an independent swing-detector using a 20-bar simple average of (high-low) range, and while my confirmed swing highs are landing close to your displayed QHi levels, my detector requires a materially larger range to confirm a swing low than what your indicator appears to accept -- suggesting our "Avg Bar Size" figures may differ even though we're both using "6.0x" as the Min Range multiplier. 2. QPoint confirmation mechanism Is QPoint/swing confirmation based on a standard zigzag-style pivot re-anchoring approach (i.e., a candidate pivot is replaced whenever price makes a new extreme past it, before the opposite-direction range/retrace conditions are met), or a different mechanism entirely? Understanding this would help me match your confirmed-swing output more precisely. 3. Zone boundary buffers Via `iCustom()`, I can only read one boundary per zone (SupLow for supply zones, DemHigh for demand zones) -- there's no SupHigh or DemLow buffer exposed. Can you confirm: Whether the opposite boundary is intentionally not exposed, and if so, the recommended way for an EA to reconstruct it (e.g., via the originating candle indicated by SupBarNum/DemBarNum) Which of the two boundaries is intended as the "distal" (invalidation) edge vs. the "proximal" (entry-trigger) edge for each zone type Any documentation, code examples, or clarification you can share on these three points would be a big help. Happy to provide more detail on my specific `iCustom()` setup if useful. Thank you for your time, Fabian