
Shock Pullback
- Indicators
- Version: 4.0
- Updated: 29 March 2026
- Activations: 7

Discount offer for several days
Shock Pullback Indicator is a genuine breakthrough in detecting pullbacks and accumulation zones. Built on a completely innovative algorithm, it empowers traders to identify trading opportunities, track price movements, and detect pullbacks, accumulation zones, gaps, and breakouts with ease and absolute clarity.
integrated analysis system.
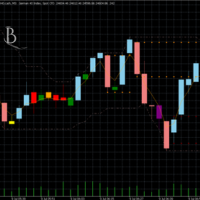
1 two movement lines to detect and display upper and lower pullback gaps in an accurate and innovative way – with the ability to control the gap colors or hide them.
2 an arrow when an upper pullback gap or a lower pullback gap is confirmed. The beginning of this zone is marked with a Bidirectional Arrow in yellow, with the option to change the color or hide the arrow.
3 Display midline baselines (Standard + Stepped): "Blue - Middle Pullback", "Lime Green - Bullish Buying Movement", and "Red - Bearish Selling Movement". Lines can be hidden through the color control menu.
4 Display profit Pips for active trades (shown in white), and show previous profitable Pip numbers in green or losing Pip numbers in red. All Pip numbers can be hidden through the control panel.
5 a ZigZag helper analysis function to detect waves and potential pullbacks.
6 an upper rectangle and a lower rectangle in the ZigZag pullback area, displaying the pullback price for the last two points.
7 a helper analysis function to search for and detect flag and pennant patterns, with customizable line colors and the option to show or hide the patterns.
8 Flexible Customization: Adjustable settings include the indicator period, band multiplier, line thickness, and the number of candles for breakout confirmation.
It is recommended to use the Shock Pullback indicator together with the SULEIMAN LEVEL indicator for a more comprehensive analysis and view levels, trend lines, supports, and more.
Wishing you all the best and profitable trading














































Good in analyzing price action