FX Volume MT5
- Indicators
- Version: 4.95
- Updated: 8 April 2026
- Activations: 10

FX Volume: Experience Genuine Market Sentiment from a Broker’s Perspective
Quick Overview
Looking to elevate your trading approach? FX Volume provides real-time insights into how retail traders and brokers are positioned—long before delayed reports like the COT. Whether you’re aiming for consistent gains or simply want a deeper edge in the markets, FX Volume helps you spot major imbalances, confirm breakouts, and refine your risk management. Get started now and see how genuine volume data can revolutionize your decision-making!
1. Why FX Volume Is Extremely Beneficial for Traders
Early Warnings with Unbeatable Accuracy
• Access near-instant updates on how many traders are buying or selling each currency pair—well ahead of the crowd.
• FX Volume is the only tool that compiles authentic multi-broker volume data and presents it in a clean, user-friendly format.Strong Risk Management
• Detect significant imbalances (long or short) that often signal trend reversals, helping you place stops and targets with more confidence.
• Authentic, exclusive data means you’ll enjoy reliable insights for every trading decision.Optimize Entry & Exit Points
• Identify “crowded trades” where most participants are stuck on one side, and confirm breakouts supported by real volume.
• Avoid misleading signals typical of standard indicators by relying on genuine, real-time flow.Works with Any Strategy
• Blend FX Volume seamlessly with trendlines, support/resistance, or indicators. Real volume data provides a unique layer of confirmation you won’t find anywhere else.
2. Learn More at Stein Investments
At Stein Investments, we offer:
• Expert Advisors and Indicators for a variety of markets.
• Tutorials, Videos, and Guides to accelerate your learning.
• A supportive community with exclusive trading chats.
Visit our Stein Investments page for strategies, updates, and resources—so you can get the most out of FX Volume and take your trading to the next level.
3. How to Get Started with FX Volume
Add the Required URL
• In your MetaTrader terminal, go to Tools > Options > Expert Advisors and add:
https://stein.investments
This allows FX Volume to retrieve genuine market data from our specialized data center.Install SI Connect
• Open a separate chart (any symbol/timeframe).
• Attach SI Connect there—it automatically downloads all data FX Volume needs.Add FX Volume to Your Main Chart
• Drag and drop FX Volume onto the chart you want real-time volume insights on.
• View long/short ratios, total volume, and net positions—all drawn from exclusive multi-broker data.
4. How FX Volume Works (Simple Explanation)
Every Trade Has Two Sides
• If you buy, a broker or institution sells—creating a live market position on the other side.Data Collection
• We collect real, anonymized volume data from retail traders and brokers, ensuring no personal info—just authentic volume metrics.
• FX Volume merges this info into one reliable feed so you can see exactly where market players stand.Aggregation & Analysis
• Our data center continually processes everything for FX Volume.
• SI Connect then downloads these ready-to-use files and updates them without any extra steps on your part.Contrarian Perspective
• If 80% of retail traders go long, major institutions often go short. FX Volume pinpoints these imbalances, giving you a clarity advantage so you can make stronger decisions.
5. Practical Ways to Use FX Volume
Identify Overcrowded Trades
• If the majority piles into one direction (long or short), a reversal could be near.
• Our exclusive feed lets you spot these shifts early and plan accordingly.Confirm Breakouts
• A breakout supported by rising buy/sell volume often suggests real momentum.
• Trust actual global retail volume for more credible breakout validation.Optimize Stop-Loss Placement
• Volume spikes show where big players move the price. Setting stops with this knowledge can reduce surprise volatility.Combine with Price Action
• Pair key support/resistance zones or candlestick patterns with FX Volume for double confirmation on your setups.
6. FX Volume Indicator Settings
Customize FX Volume to fit your preferred style and approach:
Broker DST Zone & GMT Shift
• Align your time settings with your broker’s local time to keep volume data consistent.Back Comparison In (Hours or Minutes)
• Decide if you’d like to compare the current data to an interval measured in hours or minutes.Compare with X Units Back
• Define how far back you look for sudden spikes or drops in volume.Display All History Lines
• True: Shows history lines for all relevant currencies.
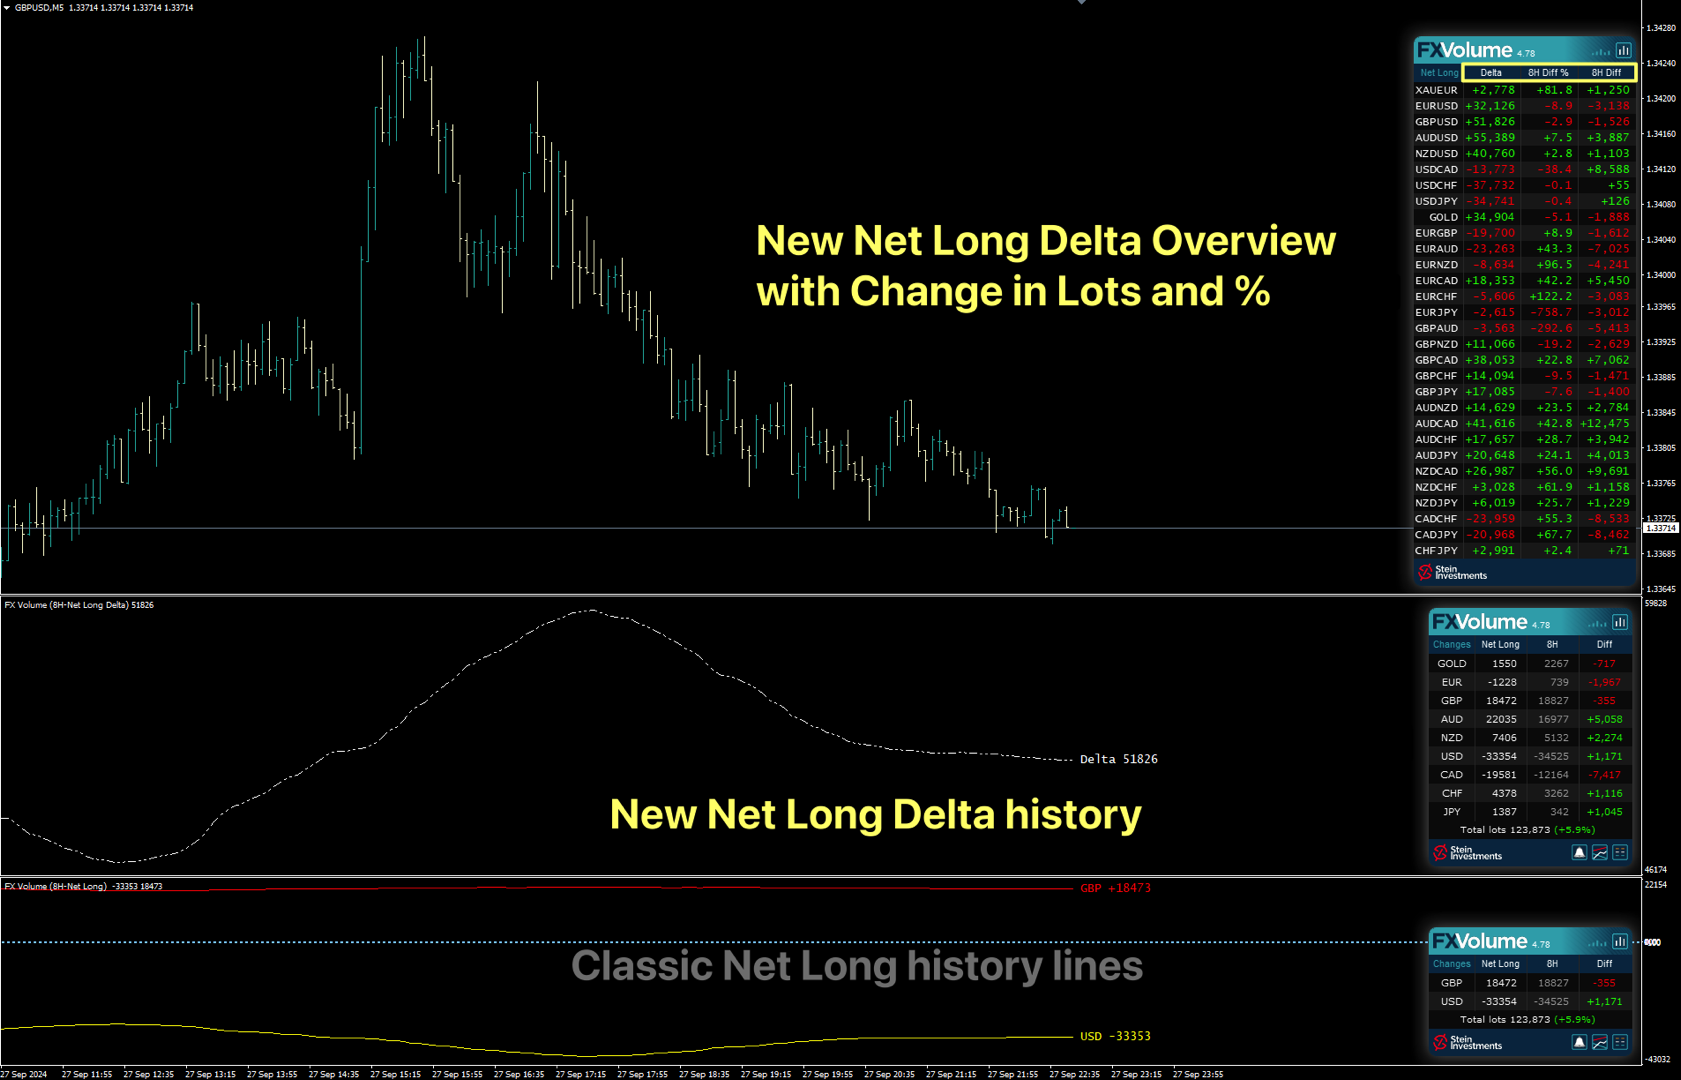
• False: Only lines linked to the current symbol.History Values
• Pick which volume data you want to see: Net Long, Long Volume, Short Volume, or Total Volume.Multi-Instance Settings
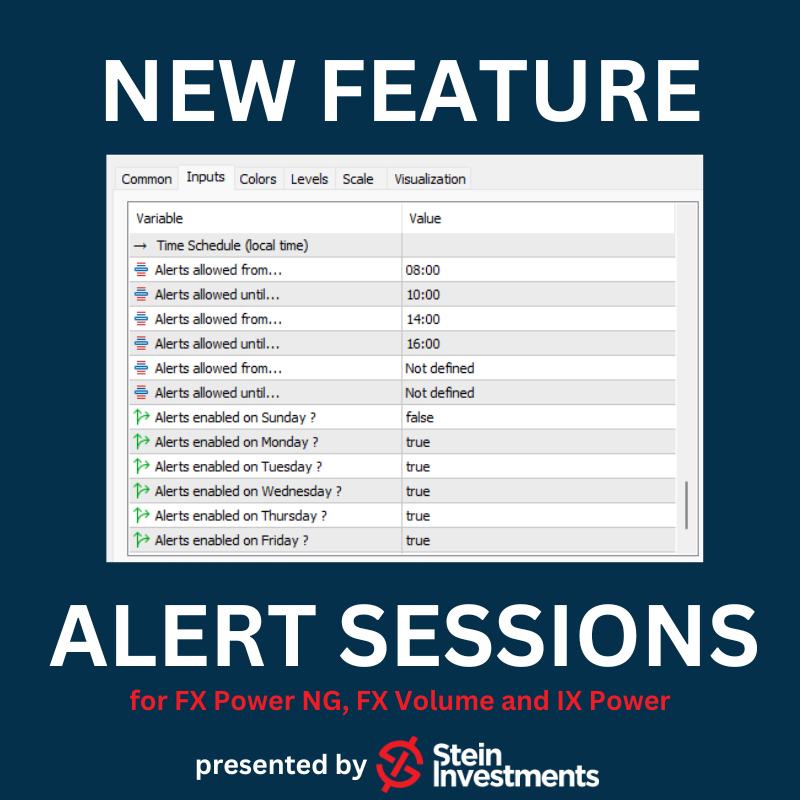
• If you run multiple FX Volume indicators in one window, assign a unique ID to each.Alert Settings
• Set volume thresholds or spike alerts—so you’re always aware of major shifts.Graphical Settings
• Adjust colors, line thickness, and overall layout to match your chart preferences.Schedule
• Control when FX Volume triggers alerts, perfect if you trade specific sessions.
7. Further Information & Help
• FX Volume FAQ: Explore our FX Volume FAQ for deeper insights and troubleshooting.
• Community Chat: Join our private group to exchange strategies, ask questions, and connect with other FX Volume users.
• Support: Need help or have questions? Contact us. We’re here to guide you.
Ready to Transform Your Trading?
• Access Exclusive Data: We gather genuine volume from multiple retail brokers, revealing the real market stance.
• Trade with Greater Precision: Confirm sentiment, spot reversals, and reinforce your strategies with top-quality, real-time data.
• Join Stein Investments’ Community: Rely on our tools, guides, and supportive network to pursue your trading goals with confidence.
Don’t wait! Install FX Volume today and experience the game-changing power of real volume data—seize the advantage and elevate every trade.
Happy Trading!
Daniel & Alain


Really very accurate, just the fact that this indicator is linked to a data center where the data is transmitted and sent gives us a real sense of the volume where forex pair trades are concentrated. It's extraordinarily good.