A very useful utility that works well. Thanks to the author.
- Overview
- Reviews (1)
- Comments
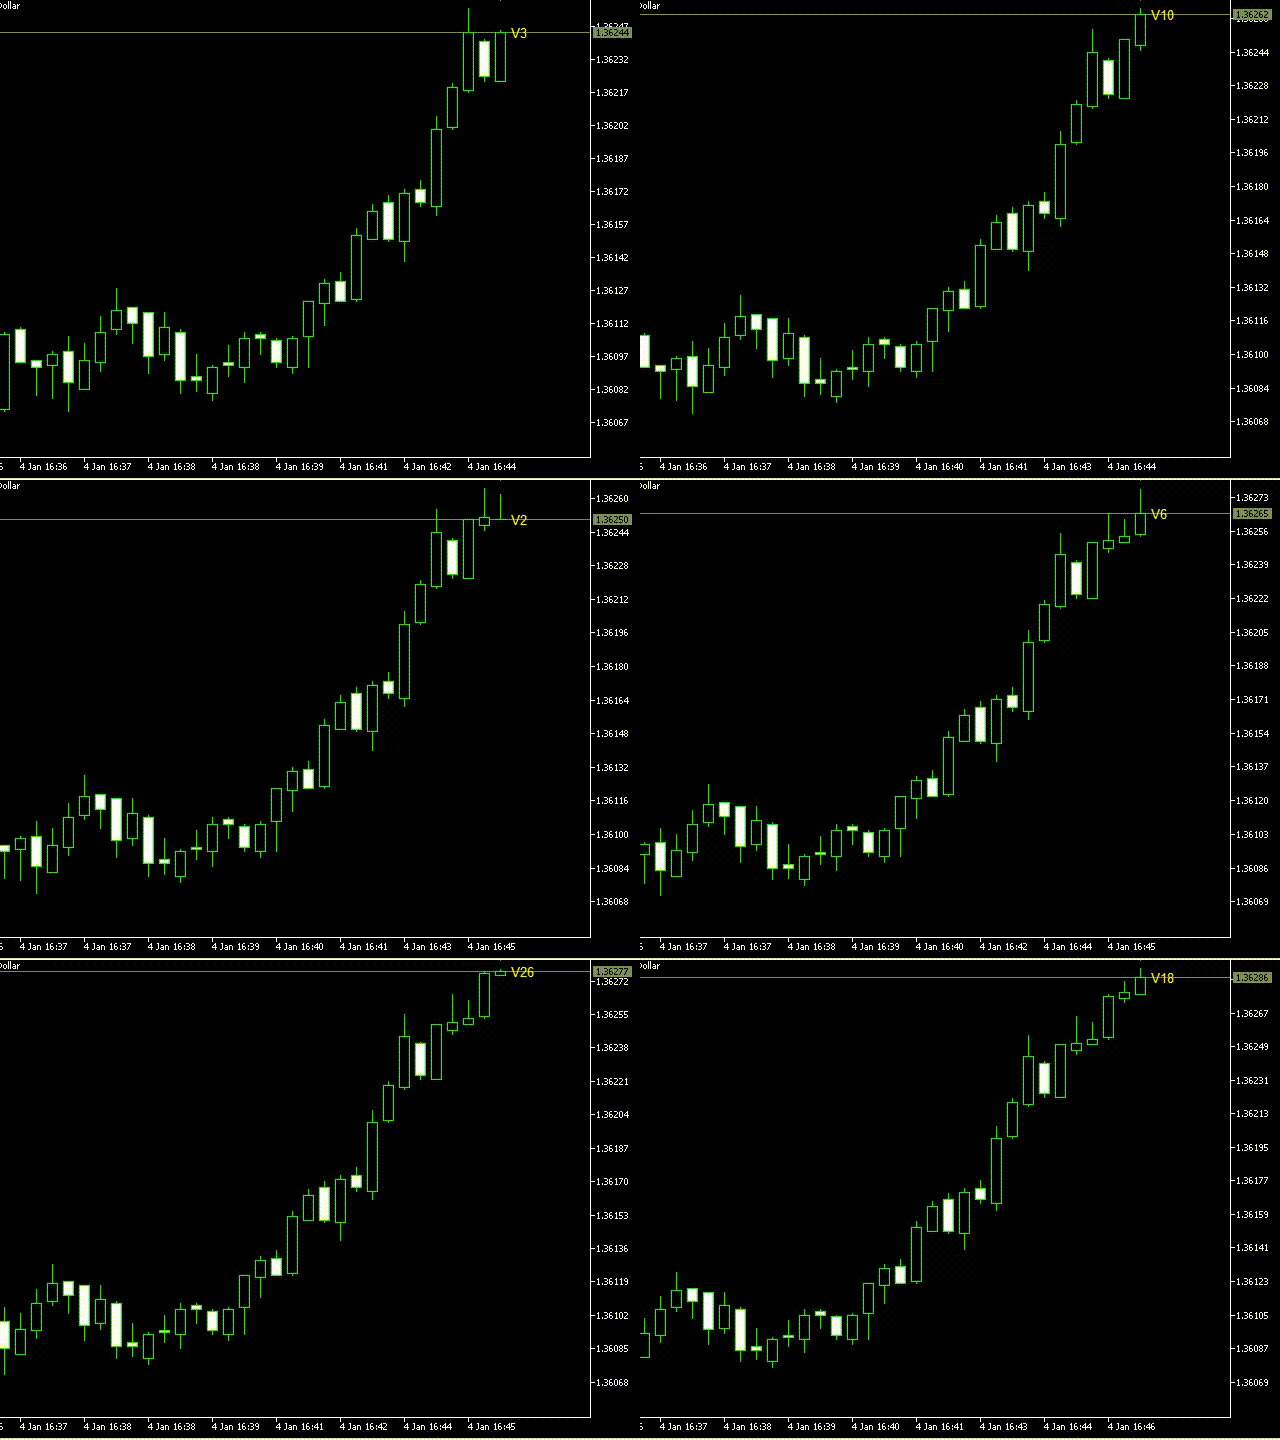
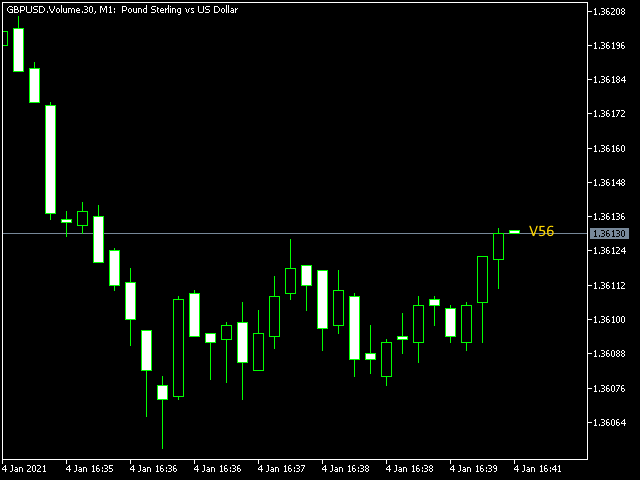
Countdown timer for Tick and Volume charts
A countdown timer for the Volume bar chart generator and Tick chart generator products, which are available for download from the MQL5 Market:
- Tick chart generator: https://www.mql5.com/en/market/product/29215
- Volume bar chart generator: https://www.mql5.com/en/market/product/47197
The counter conveniently displays the number of ticks or transactions (depending on the chart) that need to pass for a new bar to start printing.
The user can set the following indicator inputs.
- Volume type (Tick volume or Real volume) - the data type that is used to create the given chart. Tick Volume should be used for the Tick chart generator. Tick or real volume can be used with the Volume bar chart.
- Counter color - the color of the counter
- X offset - the number of pixels that the counter display should be offset to the right
- Counter prefix - a string prefix that should be printed before the counter digits.
Reviews 1
Recommended products

Waves PRO Demo
FREE
Flavio Jarabeck
For those who appreciate Richard Wyckoff approach for reading the markets, we at Minions Labs designed a tool derived - yes, derived, we put our own vision and sauce into this indicator - which we called Waves PRO . This indicator provides a ZigZag controlled by the market volatility (ATR) to build its legs, AND on each ZigZag leg, we present the vital data statistics about it. Simple and objective. This indicator is also derived from the great book called " The Secret Science of Price and Volum

Simple Weis Wave
40 USD Jean Jacques Huve Ribeiro
One of the best tools for analyzing volume,
Weis Wave was idelized by David Weis, to facilitate the reading of directional flow. For the VSA method disciples it is an evolution of the practices created by Richard Wycoff, facilitating a predictive reading of the market, always seeking an accumulation and distribution of the negotiated contracts.
Cumulative wave volume Range of wave ( removed) Average Wave volume Ref "Tim Ord lectures" ( removed)

VWAP Indicator
FREE
LUC JACOBUS A VERHEECKE
Volume Weighted Average Price (VWAP) The volume weighted average price (VWAP) is a trading benchmark used by traders that gives the average price a security has traded at throughout the day, based on both volume and price. It is important because it provides traders with insight into both the trend and value of a security. This indicator VWAP V2 is free and is the manual version of the extended Easy VWAP indicator (30 Euro), where the date and time properties are automatically entered. Wit

Weis Waves
FREE
Flavio Jarabeck
The original author is David Weis, an expert in the Wyckoff Method. The Weis Wave is a modern adaptation of the 1930's Wyckoff Method, another expert in Tape Reading techniques and Chart Analysis. Weis Waves takes market volume and stacks it into waves according to price conditions giving the trader valuable insights about the market conditions. If you want to learn more about this subject you can find tons of videos in YouTube. Just look for "The Wickoff Method", "Weis Wave" and "Volume Spread

Waves Sizer
FREE
Flavio Jarabeck
Wyckoff fans, enjoy!
Ideally to be used with the Weis Waves indicator, but it can be easily used alone, the Waves Sizer puts the range (in resulting Price movement) done by the Price on its market swings. You can control how accurate or loose will be the swings. This tool is very helpful for visually know how much the Price has traveled in your Timeframe. This way you can confront this level of effort with the resulting Volume, etc... Weis Waves indicator:
https://www.mql5.com/en/market/pro

Market Profile Demo
FREE
Thiago Duarte
Market Profile is an amazing tool! It is also known as Volume Profile. With it you can identify regions of strong and weak negotiation, finding regions of accumulation (support and resistance), thus seeing the market with other eyes. Instead of measuring each candle volume as default volume indicator does, the Market Profile measure the volume by price . Paid version: https://www.mql5.com/pt/market/product/38938 Configurations: MAIN OPTIONS From period - period to extractvolume data. To per

Cumulative Delta MT5
FREE
Evgeny Shevtsov
The indicator analyzes the volume scale and splits it into two components - seller volumes and buyer volumes, and also calculates the delta and cumulative delta. The indicator does not flicker or redraw, its calculation and plotting are performed fairly quickly, while using the data from the smaller (relative to the current) periods. The indicator operation modes can be switched using the Mode input variable: Buy - display only the buyer volumes. Sell - display only the seller volumes. BuySell -

Aggression Volume
FREE
Flavio Jarabeck
Aggression Volume Indicator is the kind of indicator that is rarely found in the MQL5 community because it is not based on the standard Volume data provided by the Metatrader 5 platform. It requires the scrutiny of all traffic Ticks requested on the platform... That said, Aggression Volume indicator requests all Tick Data from your Broker and processes it to build a very special version of a Volume Indicator, where Buyers and Sellers aggressions are plotted in a form of Histogram. Additionally,

Follow The Line MT5
FREE
Oliver Gideon Amofa Appiah
Follow The Line This indicator obeys the popular maxim that: "THE TREND IS YOUR FRIEND" It paints a GREEN line for BUY and also paints a RED line for SELL. (you can change the colors). It gives alarms and alerts of all kinds. IT DOES NOT REPAINT and can be used for all currency pairs and timeframes. Yes, as easy and simple as that. Even a newbie can use it to make great and reliable trades.
NB: For best results, get my other premium indicators for more powerful and reliable signals. Get them

PipTick Volume MT5
37 USD Michal Jurnik
The PipTick Volume indicator is a great tool for measuring tick volume or real volume activity. It quickly and easily helps traders to evaluate the current size of volume. The indicator for classification of the volume size uses moving average and its multiples. Accordingly, the area where the volume is located (relative to the moving average) is labeled as ultra low, low, average, high, very high or ultra high. This indicator can calculate moving average by four methods: SMA - Simple Moving Ave

BoxInside MT5
FREE
Evgeny Shevtsov
This indicator calculates the volume profile and places labels that correspond to the VAH, VAL and POC levels, for each candle individually.
Indicator operation features The indicator works on the timeframes from M3 to MN, but it uses the history data of smaller periods: M1 - for periods from M3 to H1, M5 - for periods from H2 to H12, M30 - for the D1 period, H4 - for the W1 period, D1 - for the MN period. The color and location of the VAL, VAH and POC labels on the current candle are consider

Free Automatic Fibonacci MT5
FREE
Tonny Obare
Free automatic fibonacci is an indicator that automatically plots a fibonacci retracement based on the number of bars you select on the BarsToScan setting in the indicator. The fibonacci is automatically updated in real time as new highest and lowest values appears amongst the selected bars. You can select which level values to be displayed in the indicator settings. You can also select the color of the levels thus enabling the trader to be able to attach the indicator several times with differe

Binary Profit Gainer
FREE
Myo Min Aung
This indicator is especially for the binary trading. Time frame is 1 minutes and exp time 5 or 3 minutes only. You must be use martingale 3 step. So you must put lots size is 10 % at most. You should use Mt2 trading platform to connect with my indicator to get more signal without human working. This indicator wining rate is over 80% but you may get 100% of profit by using martingale 3 step. You should use MT2 Trading Platform to connect meta trader platform and binary platform . You can get mt2

VWAP and MVWAP
FREE
Flavio Jarabeck
Volume Weighted Average Price (VWAP) is a trading benchmark commonly used by Big Players that gives the average price a Symbol has traded throughout the day. It is based on both Volume and price. Additionally we put in this indicator the MVWAP (Moving Volume Weighted Average Price). For those who do not know the usage and the importance od this indicator I recommend a great article about this subject at Investopedia (https://www.investopedia.com/articles/trading/11/trading-with-vwap-mvwap.asp).

Bar Color Trend
FREE
Germano Chagas
Combining the best of Price Action , Directional Movement , and Divergence/Convergence analysis, Candle Color Trend is a easy and reliable way to identify trend direction. The indicator automatically paints the candles according to the assumption that an uptrend is defined by prices that form a series of higher highs and higher lows. In contrast, a downtrend is defined by prices that form a series of lower highs and lower lows. Additionally, ADX Wilder indicator is used to measure trend weakness

Indicador de Volume
FREE
Edilson Domingos
This indicator is a volume indicator it changes the color of the candles according to a certain number of ticks, and this number of ticks can be informed by the user both the number of ticks and the color of the candles, this indicator works in any graphical time or any asset, provided that the asset has a ticker number to be informed.
This indicator seeks to facilitate user viewing when analyzing candles with a certain number of ticks.

Market book lite
FREE
Aliaksandr Hryshyn
Depth of market display. Up to sixteen instruments can be displayed. There is auto-scrolling of prices, which can be turned off by clicking on "A" at the top of the window. It is quite a beautiful indicator, it can act as a splash screen, it will not be so boring to look like a regular chart, just right for meditation, especially after big losses in the market. The indicator is not for trading, so your deposit will be more complete. The video shows the fast playback of the previously saved data.

MIDAS Super VWAP
FREE
Flavio Jarabeck
Imagine VWAP, MVWAP and MIDAS in one place... Well, you found it! Now you can track the movement of Big Players in various ways, as they in general pursue the benchmarks related to this measuring, gauging if they had good execution or poor execution on their orders. Traders and analysts use the VWAP to eliminate the noise that occurs throughout the day, so they can measure what prices buyers and sellers are really trading. VWAP gives traders insight into how a stock trades for that day and deter

Volume Spread Pattern Detector MT5
FREE
Young Ho Seo
Introduction This indicator detects volume spread patterns for buy and sell opportunity. The patterns include demand and supply patterns. You might use each pattern for trading. However, these patterns are best used to detect the demand zone (=accumulation area) and supply zone (=distribution area). Demand pattern indicates generally potential buying opportunity. Supply pattern indicates generally potential selling opportunity. These are the underlying patterns rather than direct price action. T

Rainbow MT5
FREE
Jamal El Alama
Description :
Rainbow MT5 is technical indicator based on Moving Average with period 34 and very easy to use. When price crosses above MA and MA changes color to green, then this is a signal to buy. When price crosses below MA and MA changes color to red, then this is a signal to sell. The Expert advisor ( Rainbow EA MT5 ) based on Rainbow MT5 indicator is now available here . MT4 version is available here .

Blahtech Candle Timer MT5
FREE
Blahtech Limited
Blahtech Candle Timer displays the remaining time before the current bar closes and a new bar forms. It can be used for time management
YouTube Channel : https://www.youtube.com/c/MarketStalkers
Update Instructions : https://www.mql5.com/en/blogs/post/742590
Feature Highlights No stutter and no lag Tracks server time not local time Multiple colour Schemes Configurable Text Selectable Location Customisable alerts and messages Optimised to reduce CPU usage
Input Parameters Text L

Magic EA Free MT5
FREE
Kyra Nickaline Watson-gordon
Magic EA is an Expert Advisor based on Scalping, Elliot Waves and with filters such as RSI, Stochastic and 3 other strategies managed and decided with the robot smartly. Large number of inputs and settings are tested and optimized and embedded in the program thus inputs are limited and very simple. Using EA don't need any professional information or Forex Trading Knowledge. EA can trade on all symbols and all time frames, using special and unique strategies developed by the author.
The EA wo

Mini Chart Indicators DEMO
FREE
Flavio Jarabeck
The Metatrader 5 has a hidden jewel called Chart Object, mostly unknown to the common users and hidden in a sub-menu within the platform. Called Mini Chart, this object is a miniature instance of a big/normal chart that could be added/attached to any normal chart, this way the Mini Chart will be bound to the main Chart in a very minimalist way saving a precious amount of real state on your screen. If you don't know the Mini Chart, give it a try - see the video and screenshots below. This is a gr

Important Lines
FREE
Terence Gronowski
This indicator displays Pivot-Lines, preday high and low, preday close and the minimum and maximum of the previous hour. You just have to put this single indicator to the chart to have all these important lines, no need to setup many single indicators.
Why certain lines are important Preday high and low : These are watched by traders who trade in a daily chart. Very often, if price climbs over or falls under a preday low/high there is an acceleration in buying/selling. It is a breakout out of

Weis Waves RSJ
FREE
Roberto Sant Ana Junqueira
The Weis Waves RSJ Indicator sums up volumes in each wave.
This is how we receive a bar chart of cumulative volumes of alternating waves. Namely the cumulative volume makes the Weis wave charts unique. It allows comparing the relation of the wave sequence characteristics, such as correspondence of the applied force (expressed in the volume) and received result (the price progress).

PZ Penta O MT5
FREE
Arturo Lopez Perez
The Penta-O is a 6-point retracement harmonacci pattern which usually precedes big market movements. Penta-O patterns can expand and repaint quite a bit. To make things easier this indicator implements a twist: it waits for a donchian breakout in the right direction before signaling the trade. The end result is an otherwise repainting indicator with a very reliable trading signal. The donchian breakout period is entered as an input. [ Installation Guide | Update Guide | Troubleshooting | FAQ | A

Aggression Wave RSJ
FREE
Roberto Sant Ana Junqueira
Aggression Wave RSJ This indicator sums up the difference between the sells aggression and the buys aggression that occurred in each Candle, graphically plotting the waves of accumulation of the aggression volumes. Through these waves an exponential average is calculated that indicates the direction of the business flow.
Note: This indicator DOES NOT WORK for Brokers and/or Markets WITHOUT the type of aggression (BUY or SELL).
Settings: Aggression by volume (Real Volume) or by number

MW Volume
FREE
Martin Bittencourt
The Martinware Volume indicator plots a colored moving average over volume bars. The coloring uses three colors and can be done in different ways choosable by the user and is applied both to the average as to the volume bars.
Three types of coloring are possible: None: no coloring is done Increasing or decreasing: changes the color depending on the current value being bigger or lesser than the previous one Volume relative to average: colors vary if the current volume is bigger or lesser then

Gekko ADX Plus
30 USD Rodrigo Galeote
This is Gekko's Cutomized Cutomized Average Directional Index (ADX), a customized version of the famous ADX indicator. Use the regular ADX and take advantage two entry signals calculations and different ways of being alerted whenever there is potential entry or exit point.
Inputs Period: Period for the ADX calculation; PlotSignalType: How will the indicator calculate entry (swing) signals: 1- ShowSwingsOnTrendLevel : Show Signals for Trend Confirmation Swings; 2- ShowSwingsOnTrendLevelDirectio

Stackable VWAP
FREE
Flavio Jarabeck
Volume Weighted Average Price (VWAP) is a trading benchmark commonly used by Big Players that gives the average price a Symbol has traded throughout the day. It is based on both Volume and price. Additionally we put in this indicator the MVWAP (Moving Volume Weighted Average Price). For those who do not know the usage and the importance od this indicator I recommend a great article about this subject at Investopedia (https://www.investopedia.com/articles/trading/11/trading-with-vwap-mvwap.asp).
Buyers of this product also purchase

Entry Points Pro for MT5
125 USD Yury Orlov
This is an indicator for MT5 providing accurate signals to enter a trade without repainting.
It can be applied to any financial assets: forex, cryptocurrencies, metals, stocks, indices . It will provide pretty accurate estimations and tell you when it's best to open a deal and close it. Watch the video (6:22) with an example of processing only one signal that paid off the indicator! Most traders improve their trading results during the first trading week with the help of the Entry Point

VR Sync Charts MT5
52 USD Vladimir Pastushak
VR Sync Charts is a program designed as an indicator for the MetaTrader trading terminal. The program solves the problem of synchronization of chart windows by drawing a trend line in one chart window. the program copies and synchronizes the line with another chart in the MetaTrader terminal. Syncing will occur regardless of which period is set in the other chart. In the picture below, you can see how the trader manages the trend line, and the program synchronizes the line in another chart. The

PipTick Bid Ask Volume MT5
67 USD Michal Jurnik
PipTick Bid-Ask Volume indicator is a tool that needs every scalper and intraday trader. It uses a special algorithm to determine the activity of buyers and sellers and displays it in the form of histogram. With this feature, the trader can easily compare the level of aggression on the part of buyers and sellers and read the context of the market. As we all know, the forex market is decentralized and therefore we do not have a reliable information about real volume. We also do not know actual an

ACPD Auto Candlestick Patterns Detected
50 USD Dmitriy Zabudskiy
ACPD – «Auto Candlestick Patterns Detected» - The indicator for automatic detection of candlestick patterns. The indicator is useful both for novice and professional traders. It can be used as an independent tool (good results can be achieved on stocks and currency pairs) and as an additional tool to a trading system. The Indicator of Candlestick Patterns ACPD is Capable of: Determining 40 reversal candlestick patterns by their main parameters; it displays over 40 signals based on these models.

FX Power MT5
75 USD Daniel Stein
You want to become a constantly profitable 5-star forex trader? 1. Read the basic description of our simple trading system & and it's major strategy update in 2020 2. Send a screenshot of your purchase to get your personal invitation to our exclusive trading chat FX Power MT5 is the first currency strength meter with a complete history across all time frames.
It analyzes the momentum and strength of all major currencies to determine high probability trades. Key Features of FX Power M

PipFinite Trend PRO MT5
98 USD Karlo Wilson Vendiola
Breakthrough Solution For Trend Trading And Filtering With All Important Features Built Inside One Tool! Trend Pro's smart algorithm detects the trend, filters out market noise and gives entry signals with exit levels. The new features with enhanced rules for statistical calculation improved the overall performance of this indicator.
Important Information Revealed Maximize the potential of Trend Pro, please visit www.mql5.com/en/blogs/post/713938 Test the demo version and explore its feature

TrendLine PRO MT5
120 USD Evgenii Aksenov
PROMO: Buy Trend Line PRO today and contact us to get for free: 1) User's Manual about the indicator and built in pop-up Scanner 2) Setting files for Bitcoin, GOLD, EURUSD, GBPUSD 3) HTF Histogram (basement indicator) which shows Higher TimeFrame trend in the bottom of chart Contact me after purchased to receive useful files: profitcamp@mail.ru The TrendLine PRO MT5 indicator is a version for MT5 of the popular INFINITY TrendLine PRO indicator (mt4). The calculation of indicato

Color Candles Identify the Major Trend
50 USD Ziheng Zhuang
The indicator includes two parts. Part I: Color Candles Show the Major Trend Color candles is to identify the market state by color candlesticks. As shown in the screenshots, if the color is Aqua, the market is in a state when you should place long orders or exit short orders. If the color is Tomato, it is the time to place short orders or exit long orders. If the color is changing, it is better to wait for its completion (until the current bar is closed). Part II: Draw bands The inner bands is

TPA Sessions MT5
50 USD InvestSoft
"TPA Sessions" indicator is a very important tool to complement "TPA True Price Action" indicator . Did you ever wonder, why many times the price on your chart suddently turns on a position you can't explain? A position, where apparently no support or resistance level, or a pivot point, or a fibonacci level is to identify? Attention!!! The first run of the TPA Session indicator must be in the open market for the lines to be drawn correctly.
Please visit our blog to study actual

FX Volume MT5
75 USD Daniel Stein
You want to become a constantly profitable 5-star forex trader?
1. Read the basic description of our simple trading system & and it's major strategy update in 2020 2. Send a screenshot of your purchase to get your personal invitation to our exclusive trading chat Following the smart money is finally possible! FX Volume is the FIRST and ONLY volume indicator that provides a REAL insight into the market sentiment from a broker's point of view.
It provides awesome insights into how i

Support and Resistance with Trendlines
50 USD Ammar Yaseen
This indicator would help you I DENTIFY different HORIZONTAL SUPPORT / RESISTANCE LEVELS AND TRENDLINES.
ADVANTAGES: Use up till 5 different levels of Support and Resistance Use up till 5 different trend lines Use true/false options to display for Support/Resistance or Trend line Image
PARAMETERS: nPeriod: the time period to decide
Limits: the candles limit to look back
UseHorizontalLines: true/false option to display Horizontal Support and Resistance Lines UseTrendline: true/false opti

Aggression On Bars
60 USD Flavio Jarabeck
Imagine a Buy and Sell Pressure monitor on your chart that shows in REAL-TIME this data, bar by bar? Well, imagine no more. We present you an exclusive creation of Minions Labs : Aggression On Bars indicator. On every new bar on you chart this indicator will start counting in real-time the BUY/SELL pressure and present this data statistics directly inside your chart. As soon as a new bar is created in your chart, the counter restarts. Simple and effective. Just watch the video to see it running

Lighthouse MT5
75 USD Daniel Stein
You want to become a constantly profitable 5-star forex trader? 1. Read the basic description of our simple trading system & and it's major strategy update in 2020 2. Send a screenshot of your purchase to get your personal invitation to our exclusive trading chat
Lighthouse is an amazing precise and reliable support and resistance indicator.
It displays the most important trading levels and draws them according to their relevance.
If a level is clearly broken, it changes its r

FX Trend MT5
75 USD Daniel Stein
You want to become a constantly profitable 5-star forex trader?
1. Read the basic description of our simple trading system & and it's major strategy update in 2020 2. Send a screenshot of your purchase to get your personal invitation to our exclusive trading chat
FX Trend displays the trend direction, duration, intensity and the resulting trend rating for all time frames in real time.
You'll see at a glance at which direction the trends are running, how long they last and how powe

Gann Square of 144 for MT5
52 USD Taras Slobodyanik
The Gann Box (or Gann Square) is a market analysis method based on the "Mathematical formula for market predictions" article by W.D. Gann. This indicator can plot three models of Squares: 90, 52(104), 144. There are six variants of grids and two variants of arcs. You can plot multiple squares on one chart simultaneously.
Parameters Square — selection of a square model: 90 — square of 90 (or square of nine); 52 (104) — square of 52 (or 104); 144 — universal square of 144; 144 (full) — "full" ve

Blahtech Market Profile MT5
124 USD Blahtech Limited
Market Profile defines a number of day types that can help the trader to determine market behaviour. A key feature is the Value Area, representing the range of price action where 70% of trading took place. Understanding the Value Area can give traders valuable insight into market direction and establish the higher odds trade. It is an excellent addition to any system you may be using. Blahtech Limited presents their Market Profile indicator for the MetaTrader community. Inspired by Jim Dalton’s

AguiaTraders F12 PRO
70 USD Renato Fiche Junior
This tool was developed to help traders on candle by candle and replay training. In the indicator settings, the user can set the training start datetime. The indicator will autommatically hide all candles after this datetime. So the user can make studies before starting the training. Starting the training, the user can simulate your trades quickly and easily!
Note: Demo version for testing can be found here: https://www.mql5.com/en/market/product/38314
This is a product developed by Renato F

Shepherd Gann Squares MT5
100 USD Abdullah Alrai
This indicator is a market analysis method based on the "Mathematical formula for market predictions" article written by W.D. Gann depending on square of nine and square of 144 methods.
Indicator has a panel, which allows you to: Move between SQ144 and SQ9 methods. Choose perfect style to trade on (Levels, Channel, Star, GannFan, Circles, and Grid for SQ9). Choose Angle/Time/Space (Square Of 9 Basics). View higher timeframes analysis on the current chart by using the frame method. Show/hide sq

PZ Wolfe Waves MT5
149 USD Arturo Lopez Perez
Wolfe Waves are naturally occurring trading patterns present in all financial markets and represent a fight towards an equilibrium price. These patterns can develop over short and long-term time frames and are one of the most reliable predictive reversal patterns in existence, normally preceding strong and long price movements. [ Installation Guide | Update Guide | Troubleshooting | FAQ | All Products ] Clear trading signals Amazingly easy to trade Customizable colors and sizes Implements perfo

PipFinite Exit EDGE MT5
88 USD Karlo Wilson Vendiola
Did You Have A Profitable Trade But Suddenly Reversed? In a solid strategy, exiting a trade is equally important as entering.
Exit EDGE helps maximize your current trade profit and avoid turning winning trades to losers.
Never Miss An Exit Signal Again
Monitor all pairs and timeframes in just 1 chart www.mql5.com/en/blogs/post/726558
How To Trade You can close your open trades as soon as you receive a signal
Close your Buy orders if you receive an Exit Buy Signal. Close your Sell orde

Bitcoin Manager MT5
50 USD Denys Babiak
Description
Bitcoin Manager is the best indicator for trading Bitcoin cryptocurrency. It is calculated based on the price deviation from the moving average line channel. Ascending and descending arrows indicate potential points and levels for opening buy and sell positions.
How to use?
We strongly recommend using this indicator on the H1 timeframe. An up arrow indicates a buy level. Down Arrow - Sell Level.
Parameters
Maximum History Bars - maximum count of history bars to calculate

FiboPlus MT5
70 USD Sergey Malysh
The indicator automatically plots and tracks buy and sell Fibo levels at any symbol and timeframe. FiboPlus displays: Fibo levels of the probable upward or downward price movements. entry points are shown using "up arrow", "down arrow" icons. The data is doubled on SELL and BUY buttons. rectangle area limited by levels 0-100. Trading is performed from one level to another (no trend).
Features price movement forecast, market entry points, stop loss and take profit for orders. ready-made trading

Pivot Prof
69 USD Paul Anscombe
Advanced Support & Resistance Trading Made Easy... Get simple, effective trade opportunities with Pivot Prof and use the Support and Resistance levels professionals use. Pivot Prof brings premium levels to the trader where the market is most likely to react, which is the very thing a trader needs to enter or exit the market, there is little point in trading in no-mans land, that gives the trader no edge whatsoever and leads to larger SL, larger drawdown, smaller TP and more risk. Pivot Prof is

Royale Scalping Indicator
149 USD Mostafa Tarakameh
Royal Scalping Indicator is an advanced price adaptive indicator designed to generate high-quality trading signals. Built-in multi-timeframe and multi-currency capabilities make it even more powerful to have configurations based on different symbols and timeframes. This indicator is perfect for scalp trades as well as swing trades. Royal Scalping is not just an indicator, but a trading strategy itself.
Features
Price Adaptive Trend Detector Algorithm Multi-Timeframe and Multi-Currency Trend

Dark Absolute Trend MT5
50 USD Marco Solito
Dark Absolute Trend is an Indicator for intraday trading. This Indicator is based on Trend Following strategy but use also candlestick patterns and Volatility. We can enter in good price with this Indicator, in order to follow the main trend on the current instrument. It is advised to use low spread ECN brokers. This Indicator does Not repaint and N ot lag . Recommended timeframes are M5, M15 and H1. Recommended working pairs: All. Follow us on Telegram: https://t.me/darktradingchan

PipFinite Breakout EDGE MT5
98 USD Karlo Wilson Vendiola
The Missing Edge You Need To Catch Breakouts Like A Pro. Follow a step-by-step system that detects the most powerful breakouts!
Discover market patterns that generate massive rewards based on a proven and tested strategy.
Unlock Your Serious Edge
Get it here www.mql5.com/en/blogs/post/723208
Have access to the game changing indicator that will take your trading to the next level!
How To Trade
Execute your trades in 3 Easy Steps!
Step 1: Trade Setup Enter a signal if Success Rate is

A2SR MT5 Automated Actual Support and Resistance
150 USD Yohana Parmi
A. What is A2SR ? A2SR is a leading indicator , has special technique in determining the levels of Support (demand) and Resistance (supply) . Leading indicator is prepare all actual SR levels before price reach there . Unlike the ordinary way that we seen on the net, A2SR has a original concept for determining SR levels. The original technique was not taken from the internet , and it has never been published on the internet either. A2SR will auto select the SR level according to your trading sty

OBOS Indicator for MT5
149 USD Renaud Candel
OBOS Indicator is an exclusive indicator to spot entries based on price action. The OBOS Indicator is both effective and user friendly. Indicator uses simple color codes and levels to indicate Overbought and Oversold conditions. No more headache. The OBOS Indicator will only gives you indication when there are possible entries. Means you only get useful information. To use the indicator, please follow the rules: wait for the indicator to give you an overbought or oversold signal (usually blue an

Pin Bar Indicator for MT5
97 USD Renaud Candel
Pin Bar Indicator is a pattern recognition indicator for Forex and Binary Options. The Pin Bar Indicator is a pattern recognition indicator of the popular Pin Bar. The strategy that comes with the Pin Bar is purely based on price action.
Inputs
Distance: distance in pixels relative to top or bottom of candle to display the arrow symbol UseAlerts (true/false): enable alerts PopAlerts (true/false): enable alerts in the popup window EmailAlerts (true/false): enable email alerts PushAlers (true/f

Elder Force Index With ATR Channels
50 USD Financial Trading Seminars Inc.
Adding Average True Range (ATR) channels to Force Index had been suggested by Kerry Lovvorn. Adding these channels turns Force Index into an excellent tool for identifying intermediate tops and bottoms. Force Index with ATR channels does not catch all turns, but the ones it identifies deserve very serious attention. Note: the word “true” in Average True Range refers to dealing with price gaps. Since there are no gaps in Force Index, here ATR is the same as the Average Range. Whenever the Force I
More from author

Tick chart generator
38 USD Artur Zas
A utility used to create custom Tick charts and provide real-time updates. This is an MT4 "offline" chart equivalent which is very simple to use. You can attach any MT5 compatible indicator or template to the tick chart and perform your technical analysis.
Tick charts measure the number of transactions per bar. You can choose any number of ticks per bar but most traders choose Fibonacci numbers (1, 2, 3, 5, 8, 13, 21, 34, 55, 89, 144, 233...). The generator uses tick data to plot the historical

RangeBars offline chart generator
35 USD Artur Zas
Professional range bar charting on a custom symbol chart accurate pricing to the tick accurate timeline (no future date projections) very responsive charts An Expert Advisor (EA) is used to create a RangeBar custom chart and provide real-time updates. It is an MT4 "offline" range bars chart equivalent. The simplicity of use - Attach the EA to any time-based chart that you wish to see Range Bars for, input your desired parameters and you are ready to go! You can attach any MT5 compatible indicat

Trend Scalper Candles
30 USD Artur Zas
The trend scalper candles are used to identify short-term trends based on the readings of the MACD, RSI and ATR indicators. All indicator calculations are visualized by candle colors which are overlapped on the chart. The indicator uses gray , green and red colors to paint individual candles, which gives you a lot of useful and easy to read information.
Gray candles Gray candles indicate a range bound period and the information can be used to trade breakouts. Simply mark the high and low of th

Renko chart generator
39 USD Artur Zas
Professional renko charting on a custom symbol chart
accurate pricing to the tick accurate timeline (no future date projections )
every renko variation in a single package very responsive charts
An Expert Advisor (EA) used to create custom Renko charts and provide real-time updates. This is an MT4 "offline" chart equivalent which is very simple to use. All historical renkos are constructed using real tick data from the broker's server.
You can attach any MT5 compatible indicator or temp

Range Bars
45 USD Artur Zas
The robust charting solution that enables creating custom live range bar charts on the MetaTrader 4 trading platform. You can apply all of the standard and custom indicators and technical studies directly to the range bar charts and you can run EAs directly on these charts as well* (for details see text below the input summary). To create a range bar chart you need to attach the Range Bar indicator to a standard time frame (1 minute is recommended) and use the indicator's settings to generate a

Ultimate Renko
45 USD Artur Zas
Ultimate Renko is a full implementation of a robust Renko style charting solution for MetaTrader 4. It enables creating custom live charts resembling Median Renko , Mean Renko , Turbo Renko , and Better Renko candles as well as Vanilla Renko and Renko with wicks , PointO charts and many more. This all in one package provides all of the signals needed by day traders, scalpers and even long-term traders. You can apply all of the standard and custom indicators and technical studies as well as templ

Median and Turbo renko indicator bundle
45 USD Artur Zas
Robust median Renko style indicator for creating custom charts resembling Median Renko, Mean Renko, Turbo Renko and Better Renko candles as well as vanilla Renko with wicks plus Point-O charts. This all in one package provides all of the signals needed by day traders, scalpers, and even long-term traders.
Main characteristics The indicator is an overlay on the main chart so it is possible to utilize one-click trading and order manipulation directly on the custom charts. Visual order placement

X Tick Chart
45 USD Artur Zas
Tick charts measure the number of transactions per bar. To give you an example if you have a 233 tick chart, each bar measures 233 transactions per bar and a new bar is plotted after 233 transactions. You can choose any number of ticks per bar but most traders choose Fibonacci numbers (1, 2, 3, 5, 8, 13, 21, 34, 55, 89, 144, 233...). The indicator uses tick data to plot the historical tick chart for a particular setting and real ticks for plotting live charts. This method of calculation gives ve

Range Bars Charting
45 USD Artur Zas
Range Bars for MetaTrader 5 is a unique tool for conducting technical analysis directly on the charts, as the indicator is an overlay on the main chart and range bars are calculated using real tick data. The trader can place and modify orders directly on the range bar chart (even with the use of one-click trading). Apart from range candles, the indicator also includes the most commonly used technical studies which are 3 moving averages (Simple, Exponential, Smooth, Linear-weighted, Volume-weight

Seconds timeframe chart
30 USD Artur Zas
Create and trade timeframes in seconds. The bar time duration is freely adjustable from 1 second and up. The chart is accurately constructed using real ticks from the broker's server. Main characteristics The indicator is an overlay on the main chart, making it possible to utilize one-click trading and on-chart order manipulation. History calculated using real tick data. Built-in technical studies: 4 moving averages (Simple, Exponential, Smooth, Linear-weighted, Volume-weighted using tick or rea

Choppy Market Index indicator
30 USD Artur Zas
CMI - Profiting from trending and ranging markets. The CMI indicator is a two-part system used to trigger both trend and counter-trend trades, that has been introduced by Daniel Fernandez in an article published in Currency Trading Magazine (August 2011 issue). It is a simple, yet effective indicator, which gauges whether the market has behaved in a choppy (non-directional) manner or trending (directional) manner. CMI calculates the difference between the most recent bar's close and the close n

Scalper Signal Indicator
10 USD Artur Zas
Scalper Signal indicator for MetaTrader 4 is a visual way to help determine whether to buy or sell against a pivot level (it does not repaint). The painted bars mark a "pivot high" or "pivot low". This is done after 3 higher closes or 3 lower closes. Red arrows above the bar mark a continuing downtrend confirmation while the Green arrows below the bar mark a continuing uptrend confirmation. The faster the timeframe, the faster the confirmation, because the indicator measures price action when yo

Extreme Volume Indicator
10 USD Artur Zas
The extreme volume indicator helps identify turning points in the market by pinpointing spots of higher than average volume. Such points usually indicate the start of a trend or a turning point in the market. The indicator averages out volume readings over an extended period of time and calculates a volume threshold level. When this level is breached, it identifies the most likely trend direction using the trend of the candle that breached the volume threshold. The direction indicator (red or gr

Line Break chart generator
45 USD Artur Zas
The professional line break chart generator is used to create live line break charts (i.e. 3 line break ). The chart is plotted using MT4's offline charging facility thus making it possible to trade* directly from the chart as well as attach any of the standard or custom indicators to perform technical analysis. The line break chart can be displayed as the most widely used 3 line break chart or a custom variation such as 2 or 5 line break chart . Wicks can be displayed or hidden on the chart - t

Line break chart PRO
30 USD Artur Zas
A professional line break chart which is displayed directly in the chart window thus making it possible to trade directly from the MetaTrader 5 charts. The line break chart can be displayed as the most widely used 3 line break chart or a custom variation such as 2 or 5 line break chart . Wicks can be displayed or hidden on the chart - they give a lot of additional information regarding the underlying price action. The indicator's settings include: Line break number - determines the number of lin

Trading panel with risk management
30 USD Artur Zas
Robust trading panel for use on any symbol (including RangeBars or Renko custom symbols). The tool can be placed anywhere on the chart and offers the following array of features: One-click instant order entry. Pending order entry using horizontal lines on the chart Pending order entry using keys in Entry price (E/P) and optional Stop Loss (S/L) and/or Take Profit (T/P) A choice between fixed trading volume or risk-based volume calculation based on the available account equity, entry price, and t

Volume bar chart
45 USD Artur Zas
A volume-based chart designed for use with exchange-traded instruments only (futures, stocks, etc.). Real volume data is needed for the chart to display. If no real volume data is present the chart will fallback to a "tick volume" bar chart. Tick volume mode can also be set using the indicator's settings.
Real trade volume is used to calculate both live and historical bars. A new bar is formed only after a user-defined number of contracts are traded, aka volume!
For example, on a 4000 volume

Volume bar chart generator
38 USD Artur Zas
A utility for creating volume bar charts with real-time updates. This is an MT4 "offline" chart equivalent, which is very simple to use. You can attach any MT5 compatible indicator or template to the tick chart and perform your technical analysis using various objects like trend lines. A volume-based chart mainly designed for use with exchange-traded instruments (futures, stocks, etc.). Real volume data is needed for the volume chart to display. If no "real volume" data is present, the generat

Trade Tracker for Custom Symbols
30 USD Artur Zas
The Trade Tracker Library is used to automatically detect and display trade levels on custom charts.
It is an especially useful add-on for EAs that trade on custom charts in MT5. With the use of this library, the EA users can see trades as they are placed via the EA (Entry, SL & TP levels) in real-time.
The header file and two examples of EA skeleton files are attached in the comments section (first comment).
The library will automatically detect the tradable symbol for the following custom
Filter:

A very useful utility that works well. Thanks to the author.