Watch the Market tutorial videos on YouTube
How to buy а trading robot or an indicator
Run your EA on
virtual hosting
virtual hosting
Test аn indicator/trading robot before buying
Want to earn in the Market?
How to present a product for a sell-through
Technical Indicators for MetaTrader 5

New Update of Smart Trend Trading System MT5 For 2026 Market: If You Buy this Indicator you will Get my Professional Trade Manager + EA for FREE . First of all Its worth emphasizing here that this Trading System is Non-Repainting , Non Redrawing and Non Lagging Indicator Which makes it ideal from both manual and robot trading . [Online course] , [manual] and [download presets] . The Smart Trend Trading System MT5 is a comprehensive trading solution tailored for new and experienced traders

FX Trend NG: The Next Generation Multi-Market Trend Intelligence Overview
FX Trend NG is a professional multi-timeframe trend and market monitoring tool designed to give you a complete structural overview of the market in seconds. Instead of switching between dozens of charts, you instantly see which symbols are trending, where momentum is fading, and where strong alignment exists across timeframes. Launch Offer – Get FX Trend NG for $30 (6 Months) or $80 Lifetime . Already part of the Stein I

SuperScalp Pro – Advanced Multi-Filter Scalping Indicator System SuperScalp Pro is an advanced scalping indicator system that combines the classic Supertrend with multiple intelligent confirmation filters. The indicator performs efficiently across all timeframes from M1 to H4 and is especially suitable for XAUUSD, BTCUSD and major Forex pairs. It can be used as a standalone system or flexibly integrated into existing trading strategies. The indicator integrates more than 11 filters, including fa

Each buyer of this indicator also receives the following for free:
The custom utility "Bomber Utility", which automatically manages every trade, sets Stop Loss and Take Profit levels, and closes trades according to the rules of this strategy Set files for configuring the indicator for various assets Set files for configuring Bomber Utility in the following modes: "Minimum Risk", "Balanced Risk", and "Wait-and-See Strategy" A step-by-step video manual to help you quickly install, configure, and s

ARIPoint is a powerful trading companion designed to generate high-probability entry signals with dynamic TP/SL/DP levels based on volatility. Built-in performance tracking shows win/loss stats, PP1/PP2 hits, and success rates all updated live. Key Features: Buy/Sell signals with adaptive volatility bands Real-time TP/SL/DP levels based on ATR Built-in MA Filter with optional ATR/StdDev volatility Performance stats panel (Success, Profit/Loss, PP1/PP2) Alerts via popup, sound, push, or email Cu

Entry In The Zone and SMC Multi Timeframe is a real-time market analysis tool developed based on Smart Money Concepts (SMC). It is designed to analyze market structure, price direction, reversal points, and key zones across multiple timeframes in a systematic way. The system displays Points of Interest (POI) and real-time No Repaint signals, with instant alerts when price reaches key zones or when signals occur within those zones. It functions as both an Indicator and a Signal System (2-in-1), c

Super Signal – Skyblade Edition Professional No-Repaint / No-Lag Trend Signal System with Exceptional Win Rate | For MT4 / MT5 It works best on lower timeframes, such as 1-minute, 5-minute, and 15-minute charts.
Core Features: Super Signal – Skyblade Edition is a smart signal system designed specifically for trend trading. It applies a multi-layered confirmation mechanism to detect only strong, directional moves supported by real momentum. This system does not attempt to predict tops or bottom

Game Changer is a revolutionary trend indicator designed to be used on any financial instrument to transform your metatrader in a powerful trend analyzer. It works on any time frame and assists in trend identification, signals potential reversals, serves as a trailing stop mechanism, and provides real-time alerts for prompt market responses. Whether you’re a seasoned, professional or a beginner seeking an edge, this tool empowers you to trade with confidence, discipline and a clear understand

Power Candles – Strength-Based Entry Signals for Any Market Power Candles brings Stein Investments’ proven strength analysis directly onto your price chart. Instead of reacting to price alone, each candle is colored based on real market strength, allowing you to instantly identify momentum build-ups, strength acceleration, and clean trend transitions. One Logic for All Markets Power Candles works automatically on all trading symbols . The indicator detects whether the current symbol is a Forex p

LAUNCH PROMO Azimuth Pro price is initially set at 299$ for the first 100 buyers. Final price will be 499$ .
THE DIFFERENCE BETWEEN RETAIL AND INSTITUTIONAL ENTRIES ISN'T THE INDICATOR — IT'S THE LOCATION.
Most traders enter at arbitrary price levels, chasing momentum or reacting to lagging signals. Institutions wait for price to reach structured levels where supply and demand actually shift.
Azimuth Pro maps these levels automatically: swing-anchored VWAP, multi-timeframe structure lines, an

Trend Screener Indicator --Professional Trend Trading & Market Scanning System for MetaTrader Unlock the true power of trend trading with Trend Screener Indicator — a complete multi-currency, multi-timeframe trend analysis solution powered by Fuzzy Logic,Trend Pulse Technology and advanced market structure algorithms. Trend Screener transforms your MetaTrader platform into a professional-grade Trend Analyzer and Market Scanner, helping you identify high-probability trend opportunities, early

FX Power: Analyze Currency Strength for Smarter Trading Decisions Overview
FX Power is your go-to tool for understanding the real strength of currencies and Gold in any market condition. By identifying strong currencies to buy and weak ones to sell, FX Power simplifies trading decisions and uncovers high-probability opportunities. Whether you’re looking to follow trends or anticipate reversals using extreme delta values, this tool adapts seamlessly to your trading style. Don’t just trade—trade
try and test AI Forecasts MT5: https://www.mql5.com/en/market/product/154838
and test Shock Pullback v 3.5 + AI/ML forecasts : https://www.mql5.com/en/market/product/145042 Important Note: The image shown in Screenshots is of my 2 indicators, first one with Shock Pullback V 3.3 indicator , and other for Suleiman Levels and RSI Trend V indicator, including of course attached "Time Candle", which is originally part of the comprehensive indicator for advanced analysis and exclusive levels
FREE

Top indicator for MT5 providing accurate signals to enter a trade without repainting! It can be applied to any financial assets: forex, cryptocurrencies, metals, stocks, indices . Watch the video (6:22) with an example of processing only one signal that paid off the indicator! MT4 version is here It will provide pretty accurate trading signals and tell you when it's best to open a trade and close it. Most traders improve their trading results during the first trading week with the help of

Smart Stop Indicator – Intelligent Stop-Loss Precision Directly on Your Chart Overview
The Smart Stop Indicator is the tailored solution for traders who want to place their stop loss clearly and methodically instead of guessing or relying on gut feeling. This tool combines classic price-action logic (higher highs, lower lows) with modern breakout recognition to identify where the next logical stop level truly is. Whether in trending markets, ranges, or fast breakout phases, the indicator displ
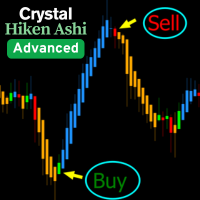
Crystal Heikin Ashi – Advanced Visual Heikin Ashi with Smart Volume Support Overview
Crystal Heikin Ashi is a professional-grade Heikin Ashi indicator for MetaTrader 5.
It provides enhanced visualization of price trends and momentum, with advanced customization options, theme integration, and seamless compatibility with volume-based tools. Designed for manual traders, scalpers, and algorithmic analysts, this indicator offers superior clarity for trend detection, momentum strength, and reversal
FREE

New Update of Atomic Analyst MT5 For 2026 Market: If You Buy this Indicator you will Get my Professional Trade Manager + EA for FREE . First of all Its worth emphasizing here that this Trading Indicator is Non-Repainting , Non Redrawing and Non Lagging Indicator Indicator, Which makes it ideal from both manual and robot trading.
User manual: settings, inputs and strategy . The Atomic Analyst is a PA Price Action Indicator that uses Strength and Momentum of the price to find a bet

Gold Entry Sniper – Professional Multi-Timeframe ATR Dashboard for Gold Scalping & Swing Trading Gold Entry Sniper is a cutting-edge MetaTrader 5 indicator designed to give traders precise buy/sell signals for XAUUSD and other symbols, powered by ATR Trailing Stop logic and a multi-timeframe analysis dashboard . Built for both scalpers and swing traders, it combines real-time market direction , dynamic stop levels , and professional visual dashboards to help you identify high-probability gold en

The Supply and Demand Order Blocks: [User manual , Recommendations] and [Tested Presets] Click the Links. The "Supply and Demand Order Blocks" indicator is a sophisticated tool based on Smart Money Concepts, fundamental to forex technical analysis. It focuses on identifying supply and demand zones, crucial areas where institutional traders leave significant footprints. The supply zone, indicating sell orders, and the demand zone, indicating buy orders, help traders anticipate potential reversals
FREE

Every day, many traders encounter a common challenge: price appears to break a key level, they enter a trade, and then the market reverses, triggering their stop loss. This is known as a false breakout — a price movement that briefly exceeds a support or resistance level before reversing direction. These moves can result in stop losses being triggered before the actual price direction becomes clear.In technical analysis, this phenomenon is commonly referred to as a "liquidity sweep" or "stop hu

If you trade with moving averages, this indicator will be your best assistant. Here's what it can do: it shows signals when two moving averages intersect (for example, a fast moving average breaks through a slow moving average from bottom to top - growth is possible). It notifies you in all ways: it beeps in the terminal, sends a notification to your phone and an email to your email — now you definitely won't miss a deal. It can be flexibly adjusted: you can choose exactly how to calculate the m
FREE

Candle Timer Countdown displays the remaining time before the current bar closes and a new bar forms. It can be used for time management. MT4 version here!
Feature Highlights Tracks server time not local time Configurable Text Color and Font Size Optional Visualization of the Symbol Daily Variation Optimized to reduce CPU usage Input Parameters Show Daily Variation: true/false Text Font Size Text Color
If you still have questions, please contact me by direct message: https://www.mql5.com/en/u
FREE

Crystal Volume Profile Auto POC — Smart Volume Visualization for Precise Trading Decisions For MT4 Version: https://www.mql5.com/en/market/product/145517 Crystal Volume Profile Auto POC is a professional indicator for MetaTrader 5 that provides traders with accurate visualization of market volume activity. It highlights the Point of Control (POC) automatically and helps detect hidden support and resistance levels created by high-volume trading areas. This tool is designed for traders who want t
FREE

The Trend Catcher: Download this Indicator you will Get my Professional Trade Manager + EA for FREE . [User manual , Recommendations] and [Tested Presets] Click the Links. The Trend Catcher Strategy with Alert Indicator is a versatile technical analysis tool that aids traders in identifying market trends and potential entry and exit points. It features a dynamic Trend Catcher Strategy , adapting to market conditions for a clear visual representation of trend direction. Traders can customize
FREE

Critical Zones has been created especially for manual traders looking for more accurate market entries. This indicator uses advanced algorithms to detect areas of interest by calculating the most relevant support and resistance on the chart as well as their breakouts and retests. This indicator can be configured to send alerts and notifications when potentially lucrative buy/sell opportunities are detected, allowing traders to stay on top of trading opportunities even when they are not in fro
FREE

Trend Ai indicator mt5 is great tool that will enhance a trader’s market analysis by combining trend identification with actionable entry points and reversal alerts. This indicator empowers users to navigate the complexities of the forex market with confidence and precision
Beyond the primary signals, Trend Ai indicator identifies secondary entry points that arise during pullbacks or retracements, enabling traders to capitalize on price corrections within the established trend. Important Advan

FX Levels: Exceptionally Accurate Support & Resistance for All Markets Quick Overview
Looking for a reliable way to pinpoint support and resistance levels across any market—currencies, indices, stocks, or commodities? FX Levels merges our traditional “Lighthouse” method with a forward-thinking dynamic approach, offering near-universal accuracy. By drawing from real-world broker experience and automated daily plus real-time updates, FX Levels helps you identify reversal points, set profit targe

Over 100,000 users on MT4 and MT5 Blahtech Candle Timer displays the remaining time before the current bar closes and a new bar forms. It can be used for time management Links [ Install | Update | Training ] Feature Highlights
The only candle timer on MT5 with no stutter and no lag S electable Location Tracks server time not local time Multiple colour Schemes Configurable Text Customisable alerts and messages Optimised to reduce CPU usage Input Parameters Text Location - Beside / Upper Le
FREE

Pointer Trend Switch — precision trend reversal indicator Pointer Trend Switch is a high-precision arrow indicator designed to detect key moments of trend reversal based on asymmetric price behavior within a selected range of bars. It identifies localized price impulses by analyzing how far price deviates from the opening level, helping traders find accurate entry points before a trend visibly shifts. This indicator is ideal for scalping, intraday strategies, and swing trading, and performs equa

Crystal Heikin Ashi Signals - Professional Trend & Signal Detection Indicator Advanced Heikin Ashi Visualization with Intelligent Signal System for Manual & Automated Trading
Final Price: $149 ---------> Price goes up $10 after every 10 sales .
Limited slots available — act fast .
Overview Crystal Heikin Ashi Signals is a professional-grade MetaTrader 5 indicator that combines pure Heikin Ashi candle visualization with an advanced momentum-shift detection system. Designed for both manual traders

Let me introduce you to an excellent technical indicator – Grabber, which works as a ready-to-use "All-Inclusive" trading strategy.
Within a single code, it integrates powerful tools for technical market analysis, trading signals (arrows), alert functions, and push notifications. Every buyer of this indicator also receives the following for free: Grabber Utility for automatic management of open orders Step-by-step video guide: how to install, configure, and trade with the indicator Custom set fi

The Support and Resistance Levels Finder: [User manual , Recommendations] and [Tested Presets] Click the Links. The Support and Resistance Levels Finder is an advanced tool designed to enhance technical analysis in trading. Featuring dynamic support and resistance levels, it adapts in real-time as new key points unfold on the chart, providing a dynamic and responsive analysis. Its unique multi-timeframe capability allows users to display support and resistance levels from different timeframes
FREE
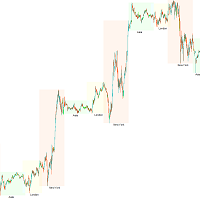
Trading Session ICT KillZone — Unlock the Power of Market Timing Successful traders know one truth: timing is everything. Different trading sessions bring different levels of activity, volatility, and opportunities. To help you clearly see and take advantage of these shifts, we created the Trading Session KillZone Indicator. This indicator highlights the active times of the Asian, London, and New York sessions, giving you a complete picture of when the market is most alive. You can customize th
FREE

If you like this project, leave a 5 star review. Volume-weighted average price is the ratio of the value traded to total volume
traded over a particular time horizon. It is a measure of the average price at
which a stock is traded over the trading horizon. VWAP is often used as a
trading benchmark by investors who aim to be as passive as possible in their
execution. With this indicator you will be able to draw the VWAP for the: Current Day. Current Week. Current Month. Current Quarter. Current Y
FREE

Introducing Quantum Breakout PRO , the groundbreaking MQL5 Indicator that's transforming the way you trade Breakout Zones! Developed by a team of experienced traders with trading experience of over 13 years, Quantum Breakout PRO is designed to propel your trading journey to new heights with its innovative and dynamic breakout zone strategy.
Quantum Breakout Indicator will give you signal arrows on breakout zones with 5 profit target zones and stop loss suggestion based on the breakout b

The Trading Sessions Time Indicator: [User manual , Recommendations] and [Tested Presets] Click the Links.
The "Trading Sessions Time Indicator" is a powerful technical analysis tool designed to enhance your understanding of different trading sessions in the forex market. This seamlessly integrated indicator provides crucial information about the opening and closing times of major sessions, including Tokyo, London, and New York. With automatic time zone adjustment, it caters to traders global
FREE

The indicator highlights zones where interests are being declared then shows their accumulation zone. Transaction Speed works like an order book in big scale.
This is the indicator for the biggest money. It's performance is exceptional. Whatever interest there is in the market you will see it.
The Transaction Speed is a new concept indicator that shows where and when large orders accumulates on the market and benefits of this. It detects trend changes at very early stage. In Forex, volume is

note: this indicator is for METATRADER4, if you want the version for METATRADER5 this is the link: https://www.mql5.com/it/market/product/108106 TRENDMAESTRO ver 2.5 TRENDMAESTRO recognizes a new TREND from the start, he never makes mistakes. The certainty of identifying a new TREND is priceless. DESCRIPTION TRENDMAESTRO identifies a new TREND in the bud, this indicator examines the volatility, volumes and momentum to identify the moment in which there is an explosion of one or more of these da

TREND LINES PRO - helps understand where the market is truly changing direction. The indicator shows real trend reversals and points where major players re-enter.
You see BOS lines Trend changes and key levels on higher timeframes — without complex settings or unnecessary noise. Signals don't repaint and remain on the chart after the bar closes.
MT4 VERSION - Reveals its maximum potential when combined with the RFI LEVELS PRO indicator What the indicator shows:
Real shifts trend

Dark Support Resistance is an Indicator for intraday trading. This Indicator is programmed to identify Support and Resistance Lines , providing a high level of accuracy and reliability.
Key benefits
Easily visible lines Only the most important levels will be displayed Automated adjustment for each timeframe and instrument Easy to use even for beginners Never repaints, never backpaints, Not Lag 100% compatible with Expert Advisor development All types of alerts available: Pop-up, Email, Push

Quantum Entry is a powerful price action trading system built on one of the most popular and widely known strategies among traders: the Breakout Strategy! This indicator produces crystal clear buy and sell signals based on breakouts of key support and resistance zones. Unlike typical breakout indicators, it uses advanced calculations to accurately confirm the breakout! When a breakout occurs, you receive instant alerts. No lag and no repaint : All signals are delivered in real-time, with no l

Stratos Pali Indicator is a revolutionary tool designed to enhance your trading strategy by accurately identifying market trends. This sophisticated indicator uses a unique algorithm to generate a complete histogram, which records when the trend is Long or Short. When a trend reversal occurs, an arrow appears, indicating the new direction of the trend.
Important Information Revealed Leave a review and contact me via mql5 message to receive My Top 5 set files for Stratos Pali at no cost !
Down

Introducing Quantum TrendPulse , the ultimate trading tool that combines the power of SuperTrend , RSI , and Stochastic into one comprehensive indicator to maximize your trading potential. Designed for traders who seek precision and efficiency, this indicator helps you identify market trends, momentum shifts, and optimal entry and exit points with confidence. Key Features: SuperTrend Integration: Easily follow the prevailing market trend and ride the wave of profitability. RSI Precision: Detect

RelicusRoad Pro: Quantitative Market Operating System 70% OFF LIFETIME ACCESS (LIMITED TIME) - JOIN 2,000+ TRADERS Why do most traders fail even with "perfect" indicators? Because they trade Single Concepts in a vacuum. A signal without context is a gamble. To win consistently, you need CONFLUENCE . RelicusRoad Pro is not a simple arrow indicator. It is a complete Quantitative Market Ecosystem . It maps the "Fair Value Road" price travels on, distinguishing between random noise and true structur

Available for MT4 and MT5 . Join the Market Structure Patterns channel to download materials available for study and/or additional informations.
Related posts: Market Structure Patterns - Introduction Beyond Fancy Order Blocks: Using True Volumetric Analysis with Market Structure Patterns & Timeless Charts Market Structure Patterns is an indicator based on smart money concepts that displays SMC/ICT elements that can take your trading decisions to the next level. Take advantage

First of all Its worth emphasizing here that this Trading Tool is Non Repainting , Non Redrawing and Non Lagging Indicator , Which makes it ideal for professional trading . [Online course] , and [manual] The Smart Price Action Concepts Indicator is a very powerful tool for both new and experienced traders . It packs more than 20 useful indicators into one , combining advanced trading ideas like Inner Circle Trader Analysis and Smart Money Concepts Trading Strategies . This indicator focuses

MT4 Version
Golden Hunter has been developed for traders who trade manually in the markets. It is a very powerful tool consisting of 3 different indicators: Powerful entry strategy: Formed by an indicator that measures the volatility of the currency pair and identifies the market trend. LSMA: Smoothes the price data and is useful to detect the short term trend. Heikin Ashi: Once the indicator is attached to the chart, the Japanese candlesticks will change to Heikin Ashi candlesticks. This
FREE

Support And Resistance Screener Breakthrough unique Solution With All Important levels analyzer and Markets Structures Feature Built Inside One Tool ! Our indicator has been developed by traders for traders and with one Indicator you will find all Imporant market levels with one click.
LIMITED TIME OFFER : Support and Resistance Screener Indicator is available for only 50 $ and lifetime. ( Original price 125$ ) (offer extended) The available tools ( Features ) in our Indicator are : 1. HH-LL S

For a limited time, an offer on the first 20 copies sold at 50% off
Before: ̶$̶1̶2̶5̶ Now: Only $60
Candle Smart Range (CRT) for MetaTrader 5 Candle Smart Range is a technical indicator designed for the automatic identification of price ranges across multiple timeframes. This tool analyzes market structure based on candle formations and the interaction of price with previous highs and lows. Main Features: Range Detection: Automatically identifies consolidation zones before impulsive movemen

Fair Value Gap (FVG) Indicator Overview The Fair Value Gap (FVG) Indicator identifies inefficiencies in price action where an imbalance occurs due to aggressive buying or selling. These gaps are often created by institutional traders and smart money, leaving areas where price may later return to "fill" the imbalance before continuing its trend. Key Features: Automatic Detection of FVGs – The indicator highlights fair value gaps across different timeframes. Multi-Timeframe Support – View FVGs fr
FREE
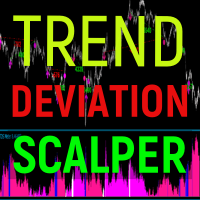
Trend deviation scalper - is the manual system to scalp choppy market places. Indicator defines bull/bear trend and it's force. Inside exact trend system also defines "weak" places, when trend is ready to reverse. So as a rule, system plots a sell arrow when bull trend becomes weak and possibly reverses to bear trend. For buy arrow is opposite : arrow is plotted on bear weak trend. Such arrangement allows you to get a favorable price and stand up market noise. Loss arrows are closing by common p

FX Dynamic: Track Volatility and Trends with Customized ATR Analysis Overview
FX Dynamic is a powerful tool that leverages Average True Range (ATR) calculations to give traders unparalleled insights into daily and intraday volatility. By setting up clear volatility thresholds—such as 80%, 100%, and 130%—you can quickly identify potential profit opportunities or warnings when markets exceed typical ranges. FX Dynamic adapts to your broker’s time zone, helps you maintain a consistent measure of
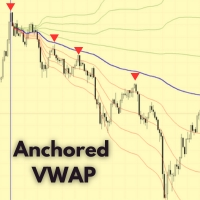
Anchored VWAP Indicator for MetaTrader 5 – Professional Volume Weighted Price Tool The Anchored VWAP Indicator for MT5 provides an advanced and flexible way to calculate the Volume Weighted Average Price (VWAP) starting from any selected candle or event point. Unlike standard VWAP indicators that reset daily, this version allows you to anchor VWAP to any moment, giving traders institutional-level precision for volume analysis , fair value discovery , and trend confirmation . Try the Candle Movem
FREE

Introducing the Quantum Heiken Ashi PRO charts with integrated alerts Designed to provide clear insights into market trends, the Heiken Ashi candles are renowned for their ability to filter out noise and eliminate false signals. Say goodbye to confusing price fluctuations and hello to a smoother, more reliable chart representation. What makes the Quantum Heiken Ashi PRO truly unique is its innovative formula, which transforms traditional candlestick data into easy-to-read colored bars. Red and g

Market Structure Order Block Dashboard MT5 is an MT5 indicator focused on Market Structure and ICT / Smart Money Concepts: HH/HL/LH/LL , BOS , ChoCH , plus Order Blocks , Fair Value Gaps (FVG) , Liquidity (EQH/EQL, sweeps), Sessions / Kill Zones , and an integrated Volume Profile with a compact confluence dashboard. Important: This is an analysis tool . It does not execute trades (not an EA). Buyer Bonus
After purchase, you can receive 2 bonus indicators (your choice) from my store. How to clai

Experience trading like never before with our unparalleled Fair Value Gap MT5 Indicator,(FVG)
hailed as the best in its class. This MQL5 market indicator goes beyond the ordinary,
providing traders with an unmatched level of accuracy and insight into market dynamics. EA Version: WH Fair Value Gap EA MT5
SMC Based Indicator : WH SMC Indicator MT5
Features:
Best-in-Class Fair Value Gap Analysis. Multi-TimeFrame Support. Customization. Real-time Alerts. User-Friendly Perfection Seamless Compa
FREE

Trend Hunter is a trend indicator for working in the Forex, cryptocurrency, and CFD markets. A special feature of the indicator is that it confidently follows the trend, without changing the signal when the price slightly pierces the trend line. The indicator is not repaint; a signal to enter the market appears after the bar closes. When moving along a trend, the indicator shows additional entry points in the direction of the trend. Based on these signals, you can trade with a small StopLoss. Tr

ATREND: How It Works and How to Use It How It Works The " ATREND " indicator for the MT5 platform is designed to provide traders with robust buy and sell signals by utilizing a combination of technical analysis methodologies. This indicator primarily leverages the Average True Range (ATR) for volatility measurement, alongside trend detection algorithms to identify potential market movements. Leave a massage after purchase and receive a special bonus gift.
Key Features: ⦁ Dynamic Trend Detect

This indicator recognizes all support and resistance levels. A number of unique high-performance techniques have been applied, which made the existence of this indicator possible.
All formed channels are naturally visible: horizontal linear linear parabolic cubic (Polynomial 3 degrees - Wave) This is due to a bundle of approximating channels. The formed channels form "standing waves" in a hierarchical sequence. Thus, all support and resistance levels are visible.
All parameter management is i

Best Solution for any Newbie or Expert Trader! This Indicator is a unique, high quality and affordable trading tool because we have incorporated a number of proprietary features and a new formula. With only ONE chart you can read Currency Strength for 28 Forex pairs! Imagine how your trading will improve because you are able to pinpoint the exact trigger point of a new trend or scalping opportunity? User manual: click here That's the first one, the original! Don't buy a worthless wannabe clone

The " Dynamic Scalper System MT5 " indicator is designed for the scalping method of trading within trend waves.
Tested on major currency pairs and gold, compatibility with other trading instruments is possible.
Provides signals for short-term opening of positions along the trend with additional price movement support.
The principle of the indicator.
Large arrows determine the trend direction.
An algorithm for generating signals for scalping in the form of small arrows operates within trend wav

[ My Channel ] , [ My Products ] The Lorentzian Distance Classifier is a machine-learning-based trading indicator that uses Lorentz distance as its core metric within the Approximate Nearest Neighbors (ANN) framework. Instead of relying on traditional Euclidean distance, it treats financial price action as if it occurs in a “distorted” price–time space (similar to how massive objects bend spacetime in relativity). This approach makes the classifier significantly more robust to market noise, outl

IX Power: Unlock Market Insights for Indices, Commodities, Cryptos, and Forex Overview
IX Power is a versatile tool designed to analyze the strength of indices, commodities, cryptocurrencies, and forex symbols. While FX Power offers the highest precision for forex pairs by leveraging all available currency pair data, IX Power focuses exclusively on the underlying symbol’s market data. This makes IX Power an excellent choice for non-forex markets and a reliable option for forex charts when deta

The Haven FVG indicator is a market analysis tool that highlights inefficiency areas (Fair Value Gaps, FVG) on the chart, providing traders with key levels for price analysis and decision-making. Other products -> HERE Main Features: Customizable color settings: Color for Bullish FVG (Bullish FVG Color). Color for Bearish FVG (Bearish FVG Color). Flexible FVG visualization: Maximum number of candles for FVG detection. Additional extension of FVG zones by a specified number of bars. Opt
FREE

Smart Volume Profile is a professional volume profile indicator that calculates and displays in real time the distribution of volumes between two vertical lines, with buy/sell split and POC, VAH, VAL levels. Designed for both discretionary and systematic trading, it allows you to see where the market traded the most and how buying and selling pressure was distributed within the selected period. Why this indicator Full control of the analysis period thanks to two draggable VLINEs that define the
FREE

CLICK HERE TO SEE ALL MY FREE PRODUCTS
When it comes to recognizing perfect market opportunities and trading breakouts precisely, RangeXpert is one of the most effective tools on the market. Developed by me specifically for beginners and semi-professionals, it delivers analysis quality that you usually only know from professional trading tools for banks, institutional traders and hedge funds . The indicator identifies market areas that often lead to strong movements and marks them so clearly a
FREE
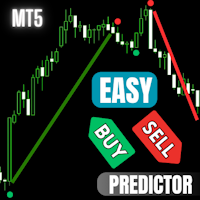
Easy Buy Sell is a market indicator for opening and closing positions. It becomes easy to track market entries with alerts.
It indicates trend reversal points when a price reaches extreme values and the most favorable time to enter the market. it is as effective as a Fibonacci to find a level but it uses different tools such as an algorithm based on ATR indicators and Stochastic Oscillator. You can modify these two parameters as you wish to adapt the settings to the desired period. It cannot
FREE

FX Volume: Experience Genuine Market Sentiment from a Broker’s Perspective Quick Overview
Looking to elevate your trading approach? FX Volume provides real-time insights into how retail traders and brokers are positioned—long before delayed reports like the COT. Whether you’re aiming for consistent gains or simply want a deeper edge in the markets, FX Volume helps you spot major imbalances, confirm breakouts, and refine your risk management. Get started now and see how genuine volume data can

Discover the LT Regression Channel, a powerful technical indicator that combines elements of Fibonacci analysis, Envelope analysis, and Fourier extrapolation. This indicator is designed to assess market volatility while enhancing precision in identifying overbought and oversold levels through Fibonacci analysis. It also leverages Fourier extrapolation for predicting market movements by integrating data from these indicators. Our versatile tool can be used independently or in combination with oth
FREE
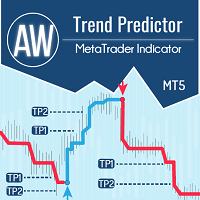
The combination of trend and breakdown levels in one system. An advanced indicator algorithm filters market noise, determines the trend, entry points, as well as possible exit levels. Indicator signals are recorded in a statistical module, which allows you to select the most suitable tools, showing the effectiveness of the signal history. The indicator calculates Take Profit and Stop Loss marks. Manual and instruction -> HERE / MT4 version -> HERE How to trade with the indicator: Trading wit
123456789101112131415161718192021222324252627282930313233343536373839404142434445464748495051525354555657585960616263646566676869707172737475767778798081828384858687888990919293949596979899100101102103104105106107108109110111112113114115116117118119120121122123124125126127128129130131132133134135136137138139140141
The MetaTrader Market is a simple and convenient site where developers can sell their trading applications.
We will help you post your product and explain you how to prepare your product description for the Market. All applications on the Market are encryption-protected and can only be run on a buyer's computer. Illegal copying is impossible.
You are missing trading opportunities:
- Free trading apps
- Over 8,000 signals for copying
- Economic news for exploring financial markets
Registration
Log in
If you do not have an account, please register
Allow the use of cookies to log in to the MQL5.com website.
Please enable the necessary setting in your browser, otherwise you will not be able to log in.