TPA True Price Action MT5 Indicator
- Indicators
-
InvestSoft
 We work from Monday to Friday. We do not reply to messages over the weekend.
 - Version: 2.3
- Updated: 27 October 2022
- Activations: 10
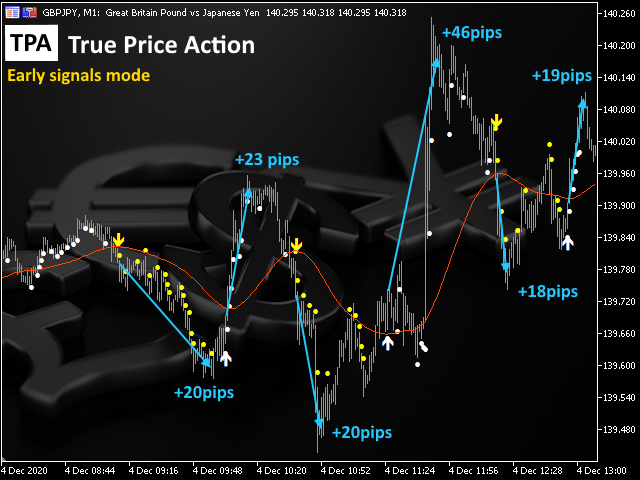
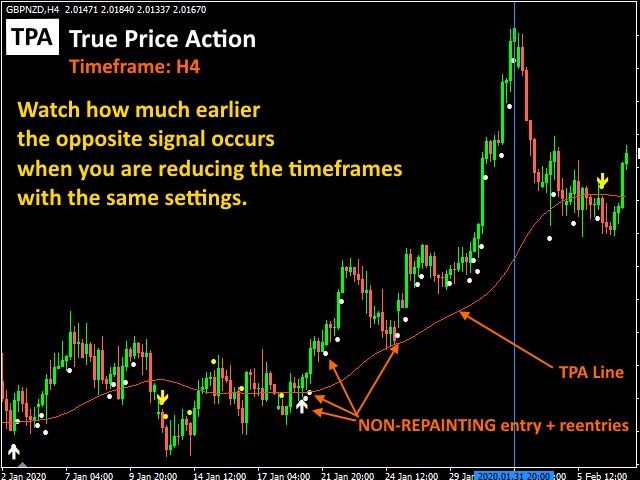
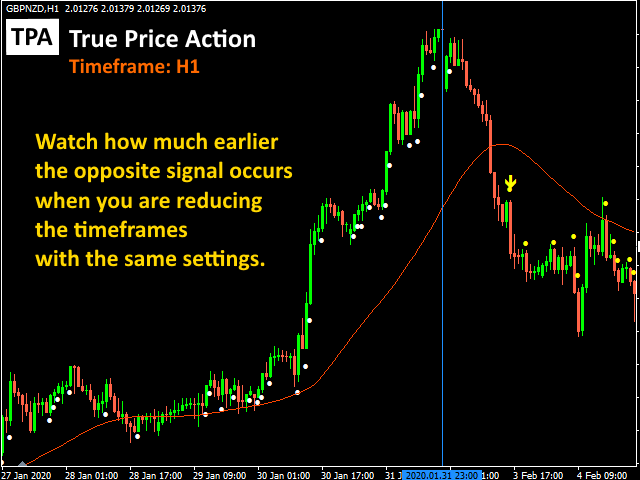
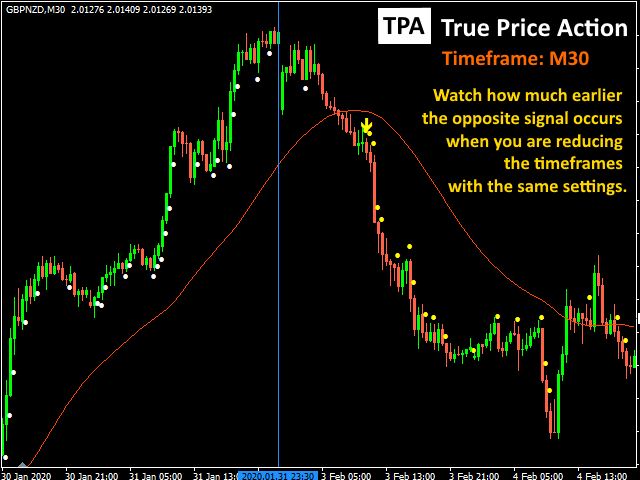
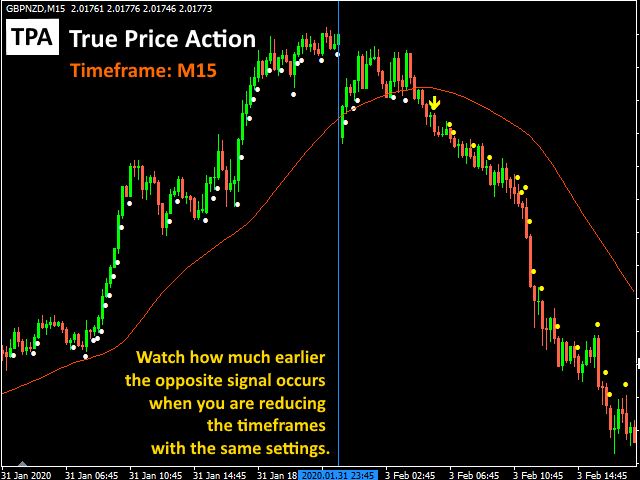
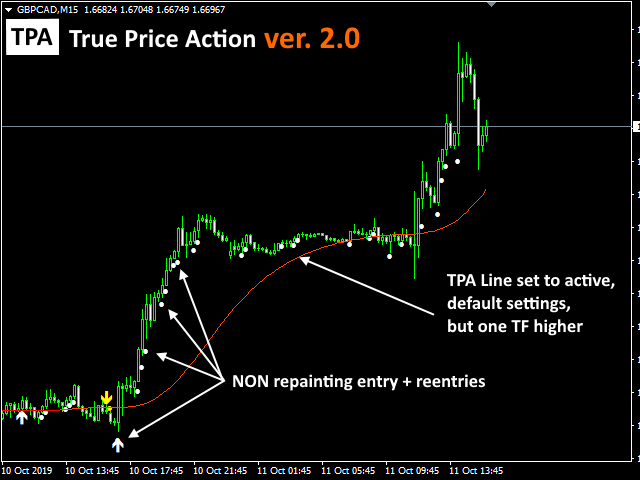
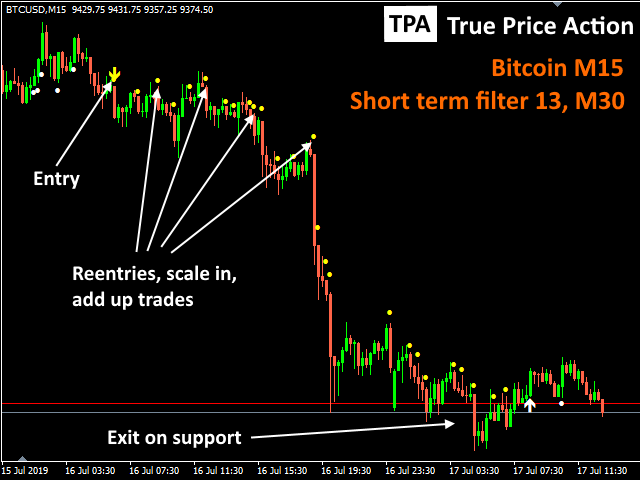
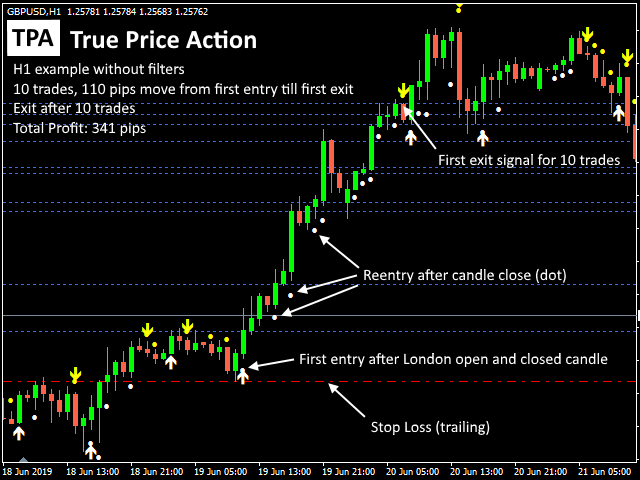
TPA shows entries and re-entries, every time the bulls are definitely stronger than the bears and vice versa. Not to confuse with red/green candles. The shift of power gets confirmed at the earliest stage and is ONE exit strategy of several.
| There are available now two free parts of the TPA User Guide for our customers. The first "The Basics" and the second "Advanced Trading Techniques". Everybody who wants to get the PDF can contact us (visit our profile). Please send a screenshot from your mql5 account (Purchases tab on the right menu) to check if you rented or purchased TPA. The first part of the PDF is meant for renters in the first place. The 2nd extended part of the PDF is meant only for the owners of lifetime license for TPA and contains even more techniques, tips and tricks, which are not to be seen at first. Both parts of the PDF are definitely worth it, because they contain our experiences over years. |
|---|
TPA has been developed by traders for traders and is not another combination out of existing indicators or a "magic, solve all situations" tool.
It is the answer for beginners and experienced traders about the misleading concepts of the mainstream, causing 90% of retail traders, never making a living out of trading.
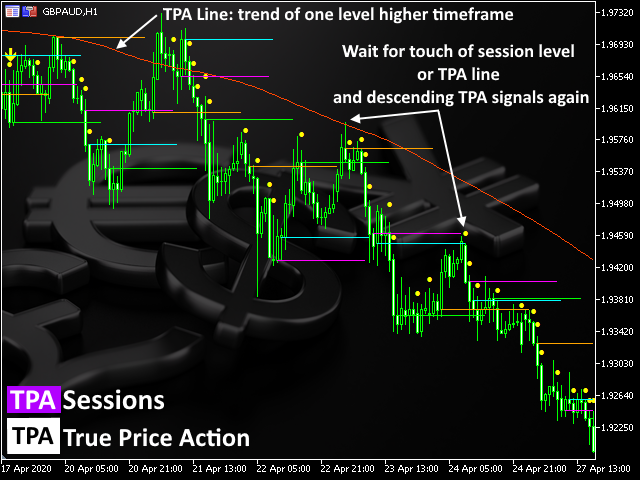
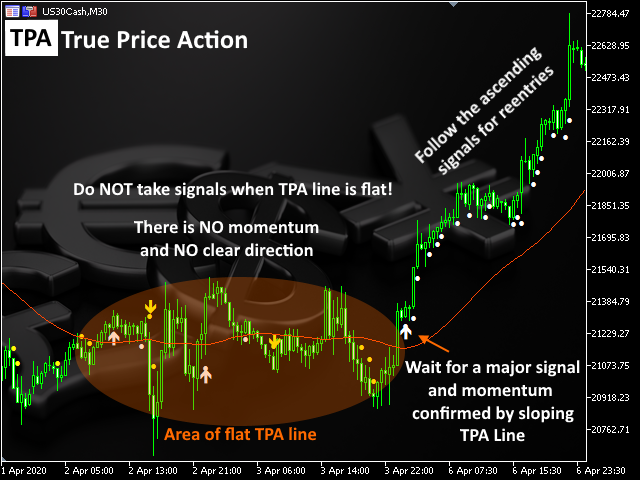
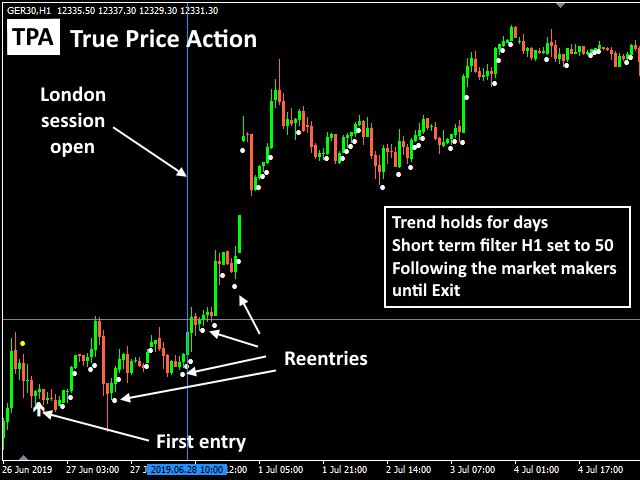
Successful traders are "following the smart money" and do NOT try to catch every move from start to end. Consistent traders catching the large moves after a confirmed start with a good money management. They stay out of choppy, low momentum phases in smaller timeframes and wait for the right signal to enter and re-enter the large moves. This fits to the different trading style like a swing trading or scalping. For a scalpers, after the consultations with our customers we added "early signals" mode to the TPA indicator. It makes better quality of signals but sometimes it can repaint however, this does not spoil the profits.
Once you recognize the potential of so many confirmed re-entries, exit strategies, you'll see that TPA is far from mainstream concepts.Profitable trading is a kind of art and needs knowledge and training. There is no magic holy grail, solving every situation on every market. By getting away from mainstream thinking, not rushing in and getting rid of illusions about being rich in a month, you are finally on the right track, getting a consistent and successful trader.
Successful traders do, what unsuccessful traders are unwilling to do!
Trading needs discipline and strong decisions, not a "gambling attitude"
Settings are very flexible and user-friendly, please take a look at pictures. We highly recommend to visit our blog for more insights. Link is in profile.
There is a demo version available, to run on strategy tester. A lot of articles prove, that backtesting is not meaningful for future profits. Past happenings and actions of the market makers, after news for example, cannot be used for future results.
Therefore we keep that low the price to rent TPA for a full month (less than $ 2 a day) to give everybody the chance to see by himself, what it means to follow the market makers.


TPA is an outstanding little system that's light on your computer, just takes some time to find the right setting for different pairs. plenty of setting to do the tick, only downside for me is that due to work i do miss some trades, would love to see an EA for this. thanks