Trend and levels
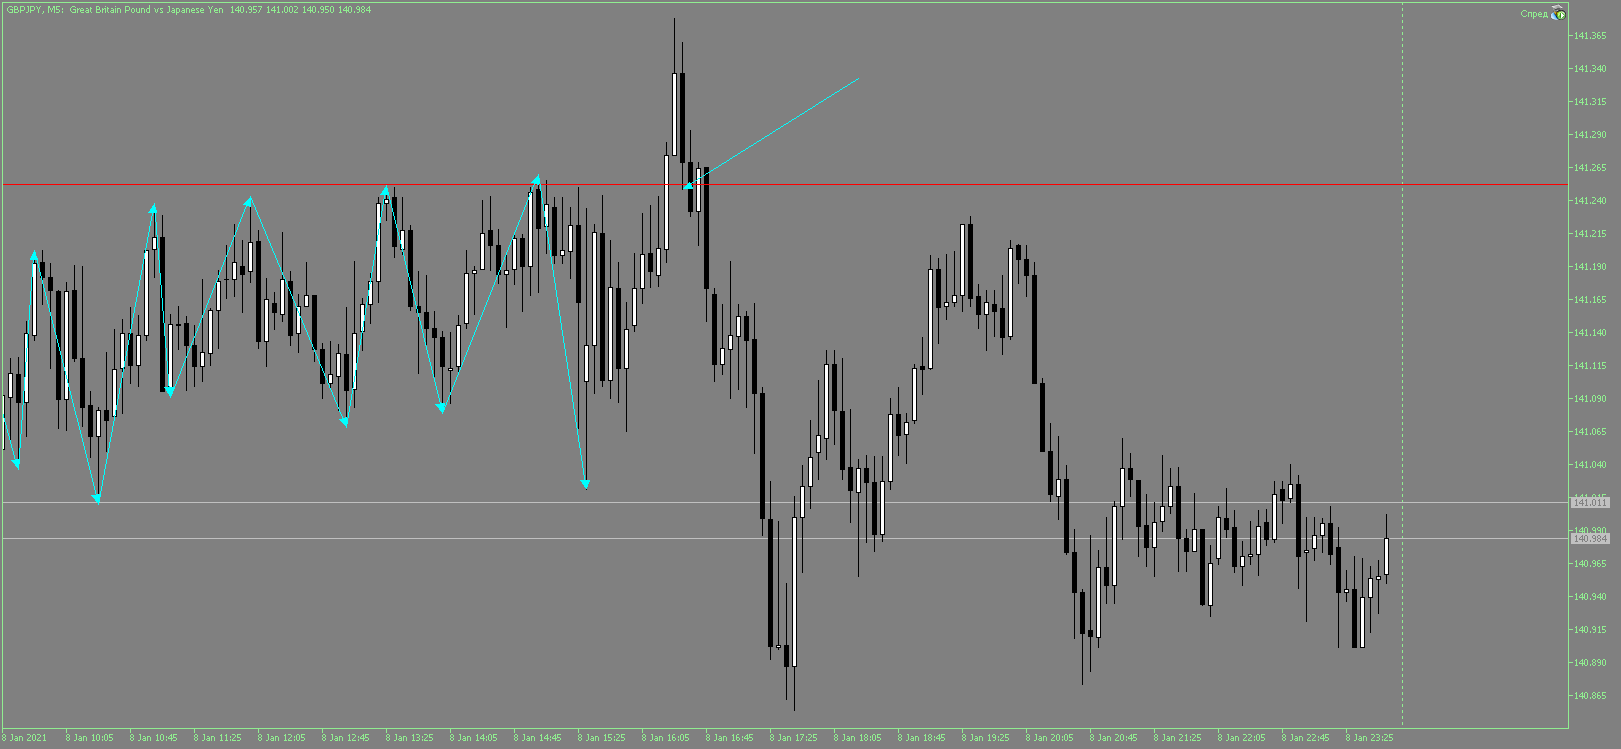
Now I looked more carefully, GBPJPY, the example from the first post, TVX on False Breakdown, ATP(5) with D1 82.0 pips, if you enter after the upside, on the return, the stop is supposed to be with the 10.0 pips spread, price passed 39.0 pips, so the move with a risk / profit 1 to 3.5

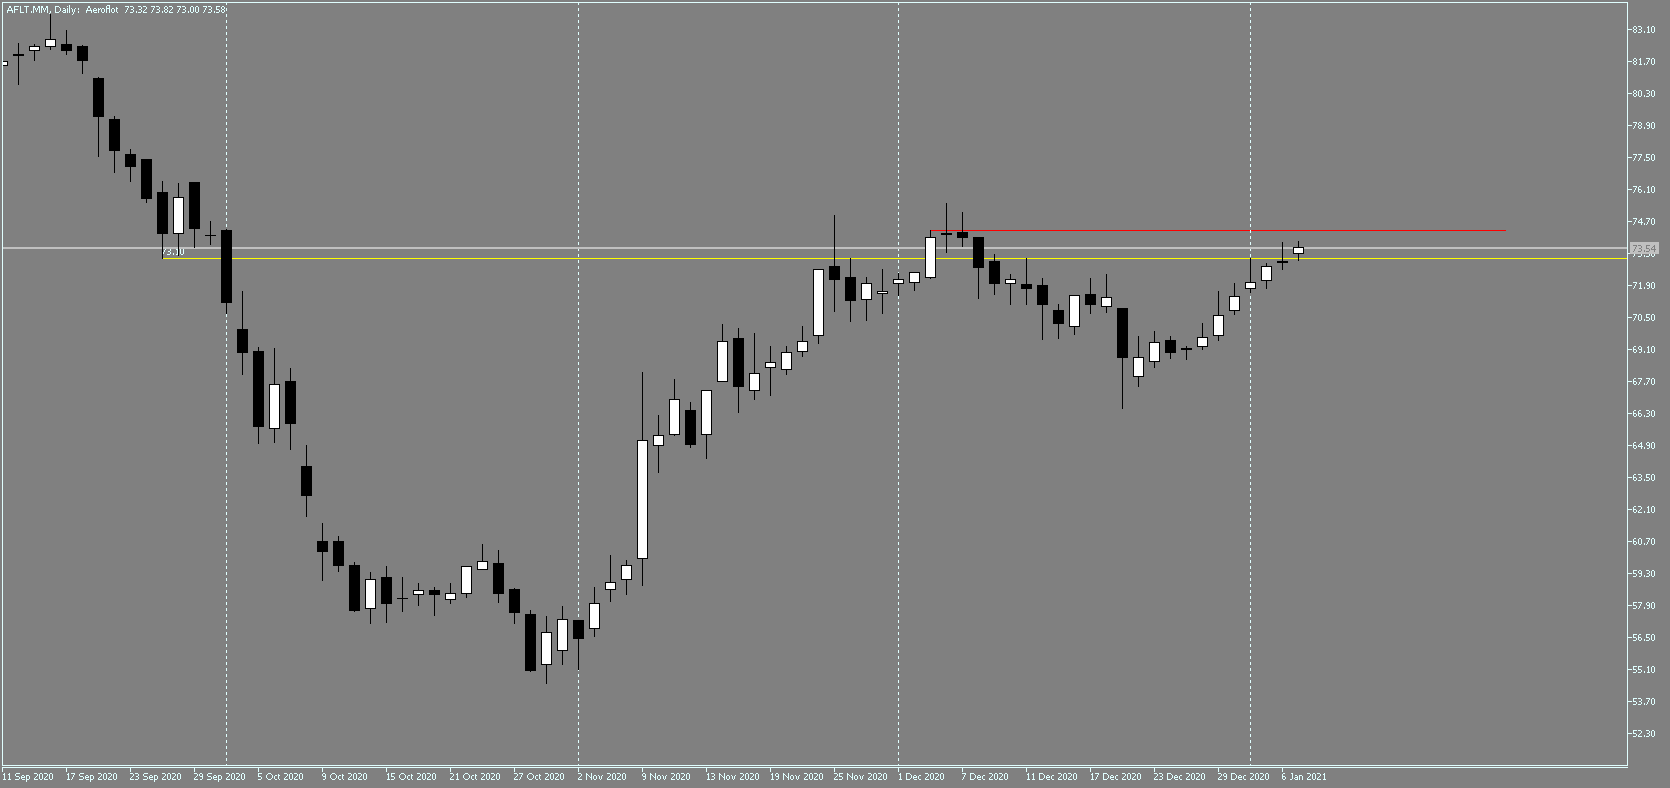
I looked at the Russian stock market for fun, where the concept of levels comes from, there they (levels) are point to point, while in Forex it is more blurred, although the principle is the same. 73.10 was out of the question long time ago and it became a mirror, and I noticed it afterwards
I wrote about trends here https://www.mql5.com/ru/articles/8184 If you're interested, read it. And in another article https://www.mql5.com/ru/articles/8231 I showed how to use this definition of trends.
As for the levels... Yes, they are there, but it's better to watch them and analyse them in a tumbler. On forex levels are conditional, they work the same way as on a random walk. On stocks, you can analyse them in the cup.

- www.mql5.com
I wrote about trends here https://www.mql5.com/ru/articles/8184 If you're interested, read it. And in another article https://www.mql5.com/ru/articles/8231 I showed how to use this definition of trends.
As for the levels... Yes, they are there, but it's better to watch them and analyse them in a tumbler. On forex levels are conditional, they work the same way as on a random walk. On shares, you can analyse them in the market.
I read your article once again (I read it before when you published it), but I don't understand what I should do with this knowledge. Maybe you can explain?
where to download HighVolumeBar VertikalHistogram v2 cluster volume indicator
google it, it's all there
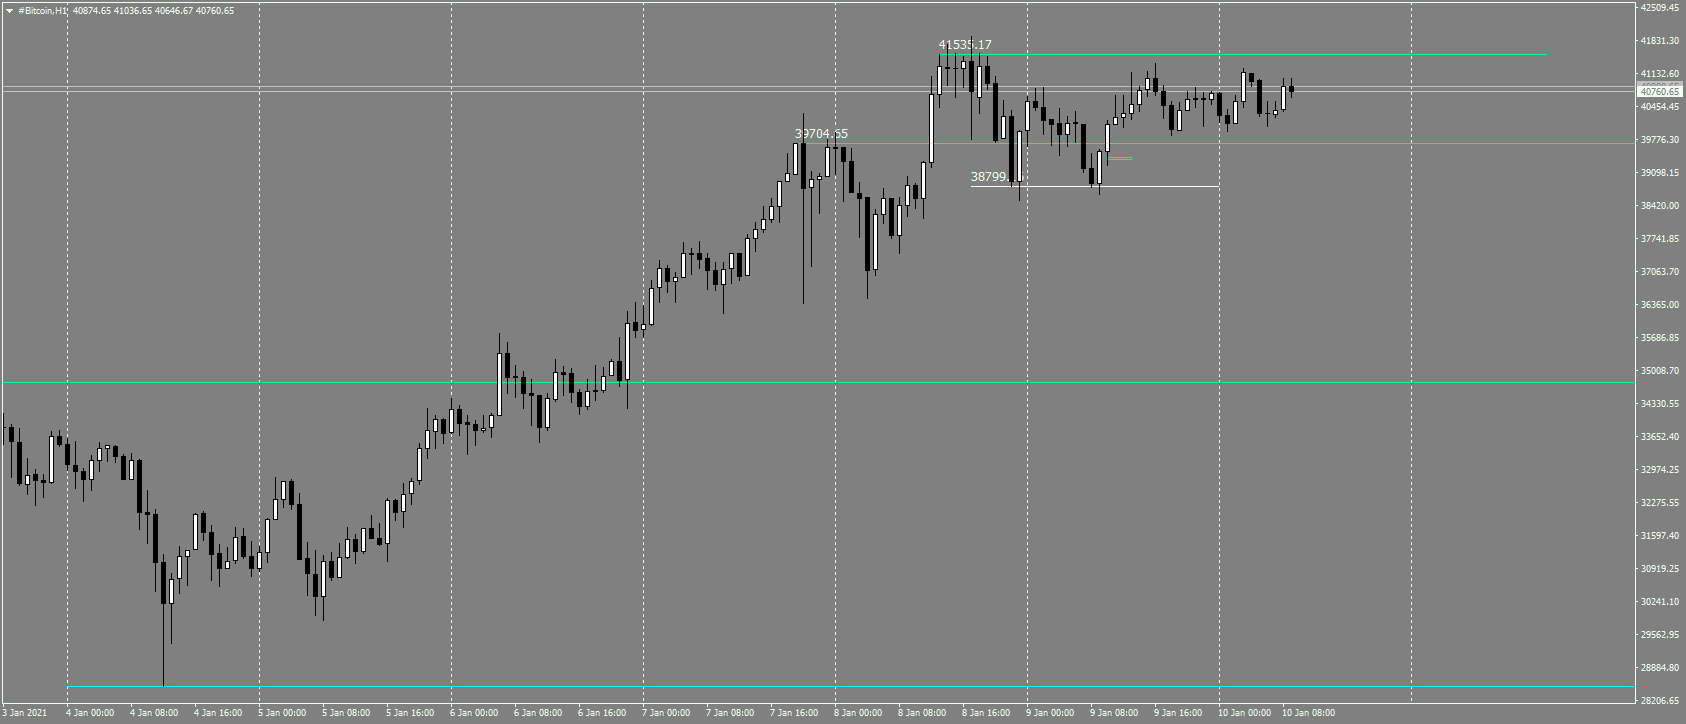
Bitcoin, the point to join the uptrend9 if it continues) should be the level where the history shows a change of bullish dominance, which is the start of a corrective pullback, because if the price passes it, it will mean that the bears have finally lost strength, 41535, from which the Buy
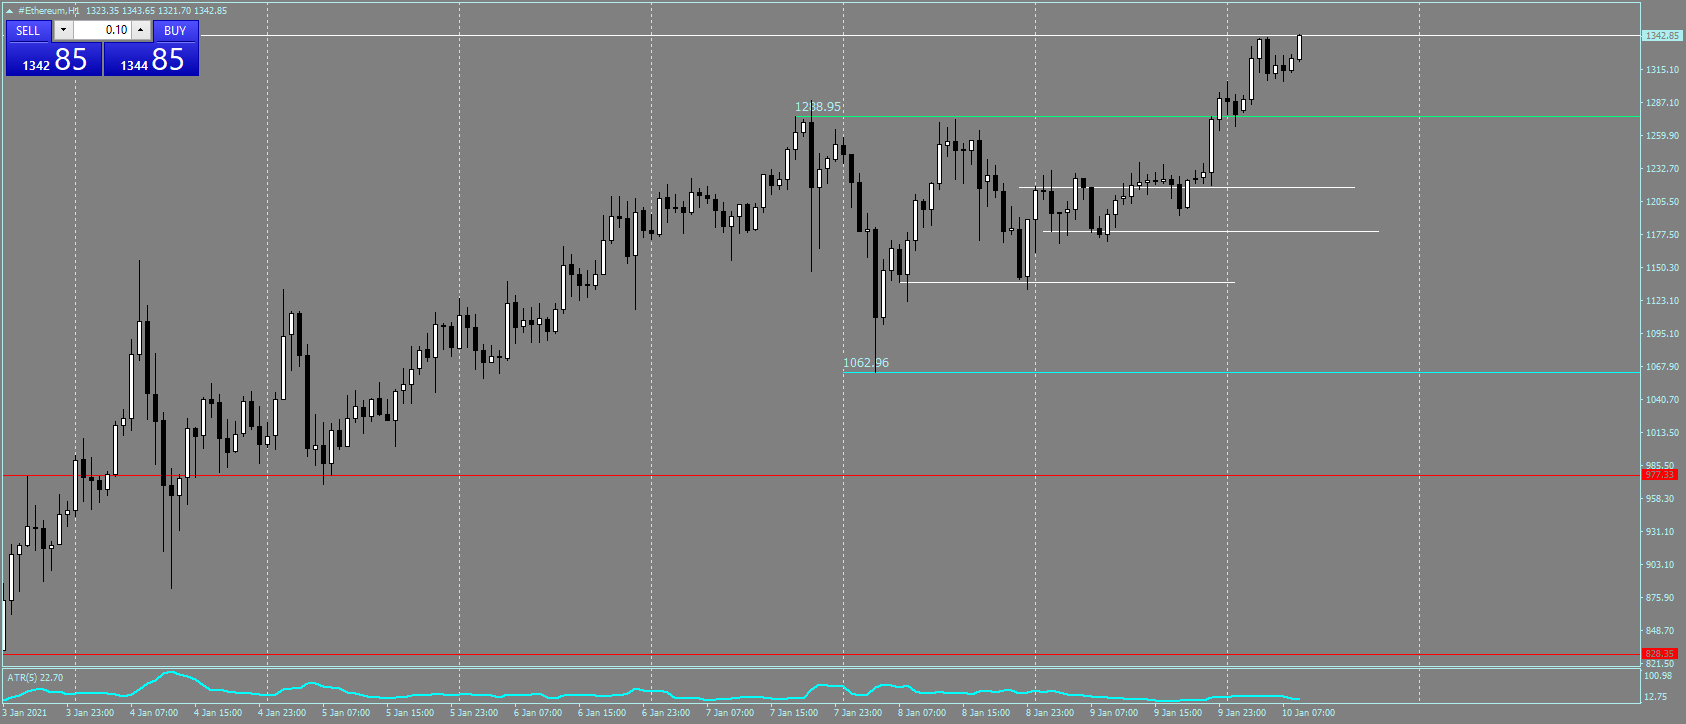
And here is how the ether broke out of the pullback, the level of 1288.95, the level of the end of the move up, and the beginning of the correction, yesterday at 22:00 Close of the hour candle 1) came right under the level, 2) Close of the candle under Hai, that is, despite the fact that the price is under the level, not flying away from it, the level attracts, well after the breakdown on the Impulse, and the subsequent rebound with a new impulse.
I've read your articles again (I already did until today, as soon as you published them), but I don't understand what I should do with this knowledge? Maybe you can explain?
Bitcoin, the point to join the uptrend9 if it continues) should be the level where the history shows a change of bullish dominance, which is the start of a corrective pullback, because if the price passes it, it will mean that the bears have finally lost strength, 41535, from which the Buy
- Free trading apps
- Over 8,000 signals for copying
- Economic news for exploring financial markets
You agree to website policy and terms of use
I would like to discuss this topic, Trend and levels
A trend is a directional movement of price, but this is the definition in general, so details are needed. A trend can be defined in different ways, but I am inclined to the definition given by Dow and given by Murphy, an uptrend is every subsequent Top and Trough above the previous one, whereas a downtrend is every subsequent Trough and Trough below the previous one, if none of the conditions is fulfilled, there is no trend.
The question arises right away: what to count on? How to determine these tops and troughs?
Help immediately comes to Gerchik and other authors who work with levels, which are in fact these tops and troughs, it was a significant event, in which the bulls/bears gained a winning position and this winning position has led to an important market event, confirmed the trend (Re-Low, ReHigh), broke the trend (Breaking of the trend) or the price was below/above the level (Limit Level).
Thus, the levels (and thus the trends) will differ in time (timeframe), on which they are visible.
Now the question needs to be solved: what value to take for drawing of the level? The first way, not very accurate, is High/Low of the extremum when the price reached its peak but there is a more accurate way (suggested by Gerchik) which is more accurate (IMHO), the level is bound to the close price of the candle. If the Close and High/Low candle are higher/lower than the previous High/Low, the level will be High/Low; if the candle shows a Close below the previous High/Low, the level will be the previous extremum; I attach the picture with all possible variants.
Sort of figured out the trend and the levels drawn on its key values, Key trend points connecting: 1) the beginning of the Impulse, 2) the end of the Impulse, the beginning of a pullback/correction, 3) the end of the correction/the same as the beginning of the impulse.
- - - - - - -
Now the question about entry points, levels are places where a break/break of bulls/bears happened in the past, so let's assume that if the price approaches the level of resistance (place of break-up in the past), something happened in the market that changed the bias, and now the bulls are in force, and a good entry point for buying is the level where bears won in the past, because it is a zone, the passage of which confirms the bears have no power.
But the observations showed that simple ТВх from the level at the approach to it is not very reliable, the matter is that the indirect evidence allows to find out what the market is ready to do, to break through it or will not be able to break through it and rebound.
According to Gerchik, it is called a squeeze of the price to the level, or break of the squeeze, or leveling. If the price presses the level, a breakout is more probable; if it is pressed down, a squeeze-out occurs, the breakout is questionable, most probably a stop-out or a rebound.
And then MM comes into play, any forecast for TVX provides probability hardly differing from 50%, will it be 70%? What if they don't give a stable profit? You need an MM with high risk/profit, or risk should be close to zero (within reasonable limits of course) and take to infinity, in fact if you have risk/profit 1 to 3 you won't get sunk.
In the drawings, the uptrend, so it is desirable to look for tbh in its direction, because in a trend impulses are always longer than the corrective pullbacks
To find the Tx, we go inside the day.
The level 39796, from it there was a strong drop in the past, i.e. there was an opinion that it's time to sell, after it passed, and it turned into a Mirror level, Impulse 1 is a new pullback, Impulse 2, correction, Impulse 3, a new attempt to go South, but it shows that the bears weakened, failed to renew Impulse 1 low, after it forms a good situation for a Buy attempt, from the level.
Go even lower (in time), as seen on M5, the price approaches the level of a stable trend (trend), it is in the language of forex, squeeze, sustained movement, so buy from the level, stop for the last Hollow in the trend, or 10% of the APR(5) with D1, the risk is small as you see, and the profit is at least 1 to 3 of the risk9 or better more). At the time of publishing the screenshot the risk/profit has reached 1 to 4.
Now about the Smoothing pattern, the GBP/JPY, the price comes to the level in the trend, but breaks it all the time (breaks a previous Trough), and as a predictor of the rebound, it is right, so after the Up Pulse there was a rebound, this is a pattern for a False Breakout from the level.
The topic is interesting enough, everything I could dig out, I wrote, but as the real market shows, there are many dark places in the whole story with levels and trends. So I need your help, dear readers.
In the application available Gerchik's book, but it is tied to the stock market, there everything is tight in time, in Forex everything is stretched, but in general, everything is the same, with its specifics.
Marat Gazizov's course (playlist on YouTube). This is for those who want to see primary sources.