ElectroFX Pure Price Action Trading
Quick look at one of my charts
Just so you can understand how my charts look

2 types of trading
I will be teaching you all about using Price Action for:
Swing Trading
&
Breakout Trading
The main focus is swing trading but various breakout techniques can be used to add to your position as it goes further in to profit.
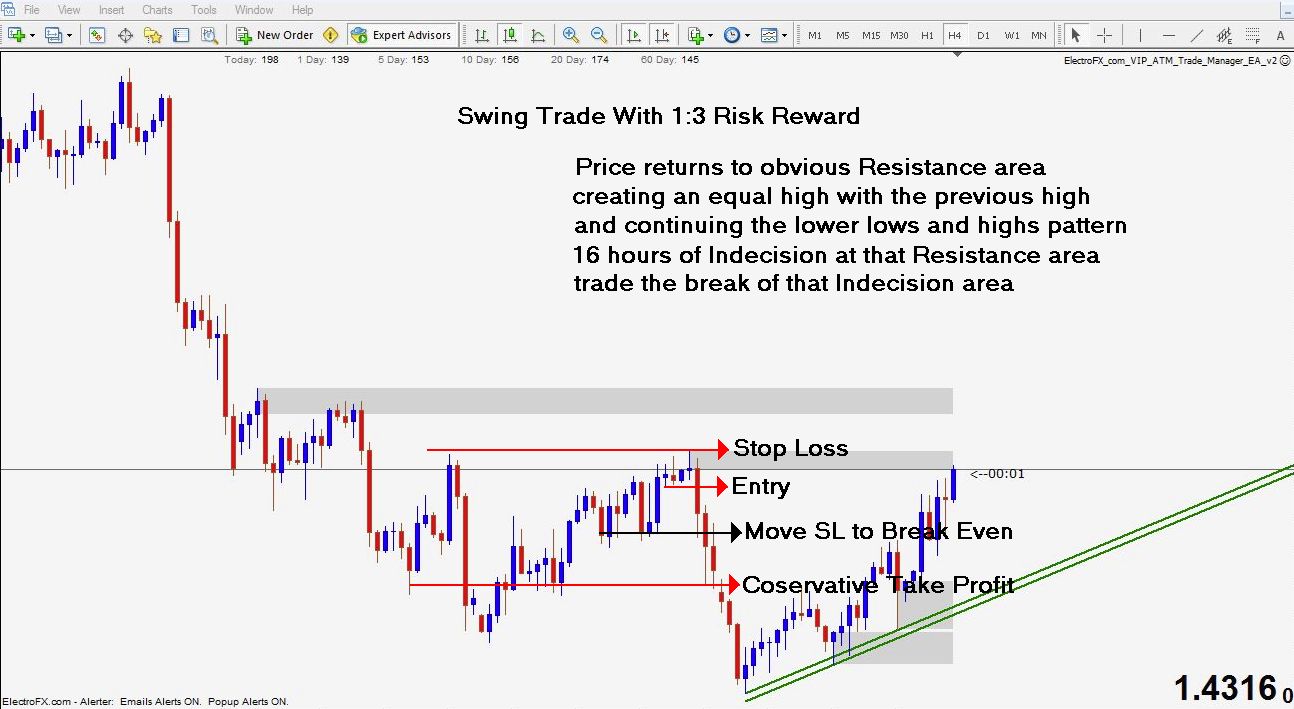
Swing Trade Example
Using that same image above here is a clear cut swing trade that set up based on my rules.. which as you will see soon enough are very black and white.
I Like It - Bring it on Electro.
Hello, I only registered on this site/forum today. I tend to find myself accidentaly looking at various threads on a forum after I've Googled summat which often leads me to a trading forum. Anyway I took the plunge and made a commitment today to this Site and upon confirming my registration I went to the home page and took at a look of at this article by Mr ElecroFX and find that we seem to have a lot in common except experience, mine is lacking in trading but I share a similar view regarding price and charts. A great start to your sharing your insights Electro. I look forward to more with eager anticipation. Thank you very much.
Look forward to seeing more picture. I also like price action.
Hi ElectroFX, Thank you for share the Pure Price Action Trading System
I will try to dedicate my first post in this forum, in this thread  . Please to continue for the next lessons
I'm glad to see there are some people interested in trading price action because I have to tell you that I have been down the Indicator path myself... way back at the start of my trading journey.
I did find uses for Indicators IF you used them WITH price action but when used alone they NEVER work consistently or give you intelligent places for SL and TP, and of course the ability to judge RR.
Sorry about the mini speech, I'm like the Indicator police or something 
......
First things first... lets use the last image I posted just above and make sure everyone understands everything I explained about that particular trade.. even right down to the reasons behind me drawing that TL where I did.
So please ask questions or at least confirm that you understand every single element of the trade as I explained it.
I believe everyone should understand each example in full before moving on to the next.
One more explanation from me before you ask questions though:
When I look at the move UP I see 3 waves of movement upwards with the 2 pullback waves. By looking at that alone I am able to understand what the current market swing sizes are, therefore giving me a scale of relativity to judge the future waves by.
I see that the last wave of movement up was much weaker than the previous wave of movement up signifying a weakening of that trend. This is then followed by a wave of movement down with is much more powerful that the previous wave of movement down (the pullback on the TL) AND it broke the previous swing low that was made on that TL.
It is at that point that you know you are waiting for a wave of movement up to reach an area of resistance that will help it maintain a lower high than the high created before the TL was broken. This will then give you the Lower Low Lower High scenario AFTER a TL break that is required for this type of trade... the Core Trade.
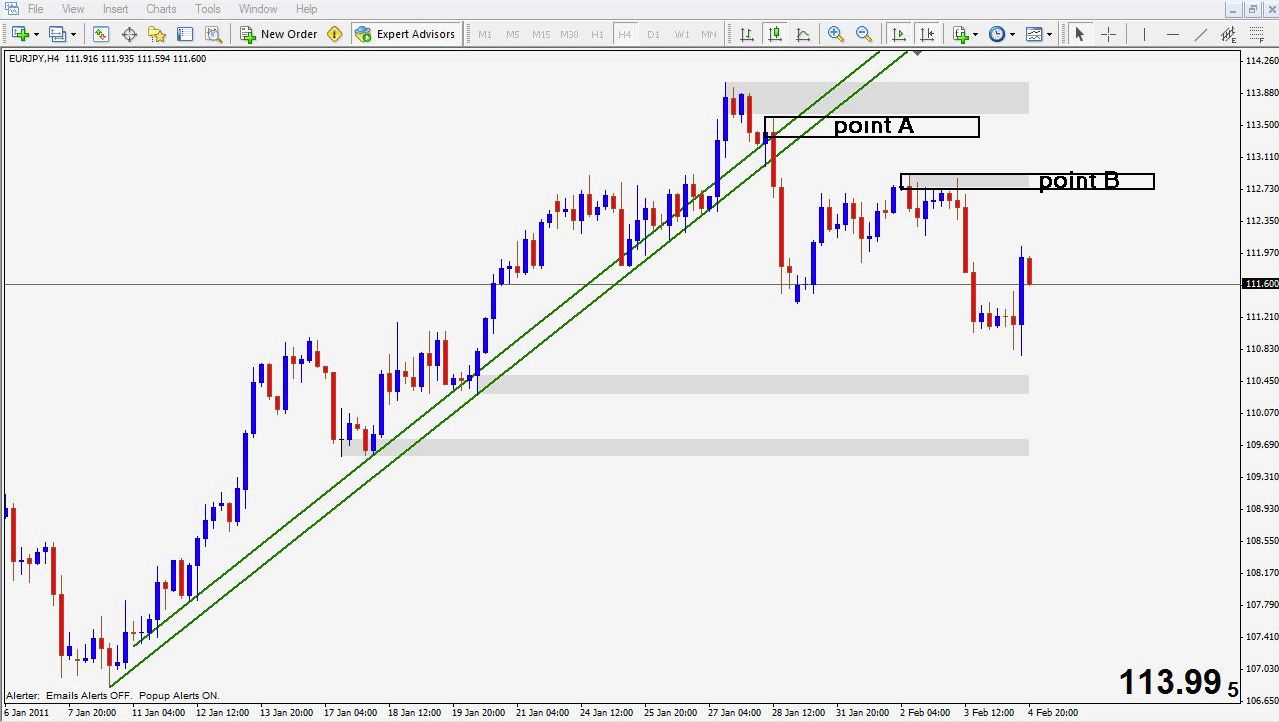
In this particular case I was waiting for price to come back to point A on the attached picture and give me some Indecision candles so I could find a trade but instead price pulled back to a different area and created a new area of Resistance which I have labelled point B on the attached picture.
Since point B was created as the new Resistance I then waited for the area to be re-tested and confirmed so I could enter a trade
Price came back and re-tested the area with a nice PinBar (please ask if you don't know what that is) and so at the time that PinBar closed I was able to find a price just below it to enter on, my SL would clearly be the new Resistance area and because we are following the lower low lower high scenario we are expecting another lower low, therefore aiming for a slightly higher low or equal low is playing it very safe.
It is at this point that you have an entry point plotted out, a SL and a TP also pre-planned (previous post picture), and you can now check to make sure you are not risking more than you are trying to gain (RR). Because this trade is going with the current trends direction in this example you are risking half the amount you are trying to gain and so this trade is an all systems go.
Thats about as detailed as I can get in typed words so please do ask questions about anything you don't understand.
EXTRA INFO:
This type of trade will work on any timeframe and you will always need a closed candle to decide on a trade. This means if you trade the H4 chart you only have to look at your charts once every 4 hours, if you trade an M30 chart you only have to look at your charts once every 30 minutes.. and so on
Thank U For The Follow Up
Thanks very much for this example of a Core Trade. I can confirm that I understand the process and its description and why patience is indeed a virtue when awaiting for this set up to unfold. Never heard of a Pin Bar b4, but I can see how it wud be the bar/candlestick that formed a peak or valley which wud later become the reference/price point for entering the trade, I think!
Candlesticks
When it comes to candlesticks, the higher the timeframe the more powerful they become as a standalone tool. This is why they end up becoming part of my entry trigger. Since they are already a signal of their own, having them at the right location (judged by PA, SR, and TL's) makes them very powerful indeed.
I have simplified Candlesticks because there are so many names that people give them and only a few that I care for myself.
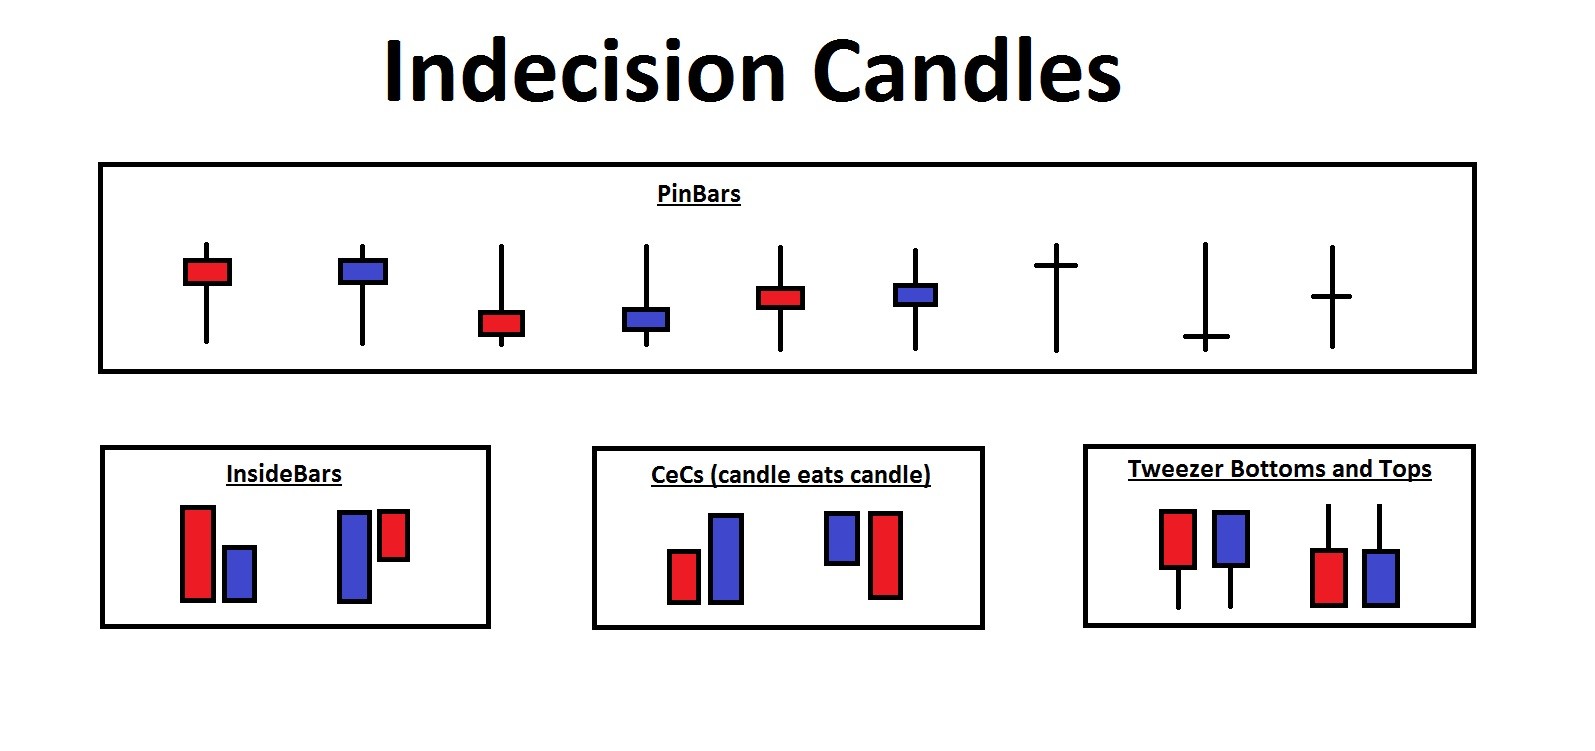
A Pinbar for me is simply a Candle that has a lot of wick and not much body, this way the name Pinbar for me covers what others call a Hammer, Hanging Man, Shooting Star, Inverted Hammer, Spinning Top, even Doji's really.
It is the Indecision I am interested in and although certain types of Pinbar are more powerful than others it can be generalized for simplicity at the beginner level.
The other Candle Patterns I look for are InsideBars, TweezerTops and Engulfing Patterns (always at the correct location)
*Engulfing patterns I ended up calling CeC's btw... candle eats candle.
I will create an image later today just to list out in picture form the types of Candlesticks I look for and label them how I will be naming them for the rest of this thread.
I whipped this up over breakfast to help simplify Candlesticks a little.
Don't forget that when we have the correct Candle Pattern at the correct location I then want that Pattern to be broken in the correct direction to enter the trade. This can be done via Pending Orders and you do not have to stare at the charts.
- Free trading apps
- Over 8,000 signals for copying
- Economic news for exploring financial markets
You agree to website policy and terms of use
Hello Forex-TSD Members,
I would like to start this thread to discuss trading Forex using nothing but Price Action, some people like to call it Naked Trading but I am dressed so I will stick with Price Action Trading
THIS IS A SET AND FORGET APPROACH TO TRADING THE MARKET ACCURATELY WITH LESS TIME STARING AT CHARTS AND THEREFORE LESS EMOTION
My first message will be to Newbies:
You are actually very lucky in some respects. You have a fresh perspective, do NOT cloud your new fresh Forex eyes with silly Indicators and squiggly lines. Everything you need to know lies within the price charts themselves. It keeps it very simple, gives you accurate information to base your decisions on without needing all the planets to align.
If you are not a Newbie:
Even if you have been working with fancy Indicators I implore you to focus more on Price Action. Unless of course you have something that works for you continuously throughout all the different market conditions. If you do then perhaps having extensive knowledge of Price Action concepts will help you to become even more accurate. Either way this thread will contain no Indicators.
Moving on....
I will introduce you to what I mean briefly then wait to see who is interested in hearing my opinions on trading, please post your interest and I will gladly continue the thread .
What exactly do I mean by Price Action and how do I trade?
Price Action is a massive topic that will take many posts and many questions but in summary price action can be broken down like this.
Support/Resistance (SR):
Also know as Supply and Demand, SR are simply areas on your chart where price is likely to change direction. SR could be traded all by itself if you were smart about your Money Management and Risk Reward but in my world it is just 1 of the core price action concepts that I combine.
Trend Lines (TL's):
Trend Lines can be very accurate tools but it is important to only place them when there is an obvious trend being born. They can be looked at as Angled SR and I like to use TL zones instead of single TL's just as I look at SR as a small area and not just a single price.
Highs and Lows (PA):
You're probably thinking why have I abbreviated this "PA". The quick answer is that everything else to do with Price Action has it's own name like SR, TL's etc.. so instead of having to say "The highs and lows being made in price swings" or "The swing highs and lows" I just call this price action (PA)
Candlesticks:
I don't need to abbreviate this piece of price action because it is just one word . Candlesticks are basically little pictures that tell you a small story about a specific period of time. If you use 4 hour charts for example then each candle can, at a glance, tell you a small story about that 4 hours. They will show you when there is Indecision or not. At the correct location (determined by SR, TL's and PA) you can use these little pictures to act as entry triggers.
Psychological Levels (PL's):
A final part of the trade decision process is to check for nearby levels of interest like 1.61000 as a major example. I break this down in to Major, Secondary, and Minor Psychological Levels. This is the final part of the entry point decision and only leaves for you to check the Risk Reward on the trade you are about to enter, make sure it is worth your time.
Money Management (MM):
I like to keep this one simple and generally round it off to safe trading being 0.1lot per $2000 in your account. I occasionally get aggressive and consider 0.1lot per $1000 in your account to be a maximum level of aggression.
Risk/Reward (RR)
This can make or break a trader right here. RR should not be ignored. I mean, what is the point of risking more than are aiming to get? It makes no sense but lots of amateur traders do it anyway. When you trade purely from price action then you have an exact price that you are waiting to enter the market at, you already know what your stop loss (SL) will be and you are able to see what a conservative take profit (TP) is also. This means that before you enter the trade you can judge your RR. If you always maintain that 1:1 minimum then winning 60-70% of your trades will make you a successful trader. However, when trading all these price action concepts I outline you are able to trade with the trend resulting in many trades that are 1:2 or 1:3. If your 1:1 is a minimum but you are trading with the trend and many times you get 1:2 or 1:3 then winning even 50% of your trades makes you a successful trader.
All that said, a 70-80% win rate is obtainable if you maintain a level of patience and discipline.
Well, that is my opening blabber and as I said I would be happy to continue if there is interest.
I have been teaching people all about price action trading for a few years now and I love watching people succeed, I will warn you though that my experience in teaching has shown me that it does take a while for anyone to get all of the price action concepts and get used to using them harmonically together.