Iurii Tokman / Seller
Published products

Line Profit Indicator of the visual line of profit in the deposit currency. Works only if there are open positions in the market for the symbol on which the indicator is installed. You can move the line with the mouse or enable automatic tracking of the Bid price. Description of indicator settings: colotLine - line color WidthLine - line width colotText - text color FontSize - the height of the text Anchor - an anchor method for text FollowBid - follow the Bid price
FREE

The Expert Advisor uses the FletBoxPush indicator for market analysis and for determining trading signals. The indicator is built into the Expert Advisor, there is no need to additionally run it on a chart. The EA trades breakouts of certain levels determined as flat borders. The EA uses Stop Loss.
Description of EA Parameters TimeFrames chart period required for the indicator colour - the color of the price zone defined as flat, a setting for the indicator Rectangle - show price zones defined

ChannelRSI5 The Relative Strength Index (RSI) indicator with dynamic levels of overbought and oversold zones.
Dynamic levels change and adjust to the current changes in the indicator and prices, and represent a kind of channel.
Indicator settings period_RSI - Averaging period for calculating the RSI index. applied_RSI - The applied price. It can be any of the price constants: PRICE_CLOSE - Closing price, PRICE_OPEN - Opening price, PRICE_HIGH - Maximum price for the period, PRICE_LOW - Minimum
FREE

StopLevel The meter controls the STOPLEVEL level. When the level changes, it signals with an alert. STOPLEVEL - the minimum offset in points from the current closing price for placing Stop orders, or the minimum allowable stop loss / take profit level in points. A zero value of STOPLEVEL means either the absence of a restriction on the minimum distance for stop loss / take profit, or the fact that the trading server uses external mechanisms for dynamic level control that cannot be transmitte
FREE

The Crazy Scalper trading robot does not use any indicators. It utilizes a scalping system, which trades in two directions simultaneously (buys and sells). Two opposite positions cannot bring profit at the same time, one of them will be losing. If there is a losing position, a lock is used. If the locking position fails and price reverses to the opposite, teh robot moves it to breakeven using the averaging system and pending orders.
Settings TakeProfit = 3; - the take profit in points; Lock_Lev

The indicator marks the volatile areas of price movement on the chart according to the specified settings.
Settings TrendPips - filter value in points TrendBars - filter value in the amount of bars signal_shift - shift relative to the current bar by the specified number of periods back, for signals CountBars - the number of bars to display the indicator Color_1 - one of the rectangle alternation colors Color_2 - the second color of the rectangles Alerts - show a dialog box containing custom dat
FREE

Double Price Channel Price channel indicator for a certain number of bars specified in the settings.
Indicator lines represent dynamic support or resistance levels. The upper limit is the price maximum for a certain number of periods, the lower one is the minimum. Unlike moving averages, which are based on close prices, the indicator is not “distracted” by small fluctuations. It will be recalculated only if the boundaries change. If the latter happens, then it is worth seriously thinking about
FREE

MovingInWL The Expert Advisor is designed to move the stop of open positions to no loss when they reach a certain predetermined profit level. Description of the advisor settings: MagicNumber - order identifier LevelProfit - The level of profit in points that the position must reach in order for its stop to be moved to the level without loss. LevelWLoss - The level without loss in points, to which the stop position will be transferred after its profit reaches the LevelProfit level in points
FREE

The indicator shows the difference between Open and Close prices. The indicator in a separate window shows the difference between the Opene price of the current bar with the Close price of the previous bar. The panel in the upper left corner shows the difference between the Open and Close prices of the current bar.
Parameters Count_Bars - number of bars to display the indicator data. If 0, the number is displayed on all available bars; display - enable numerical values; _fontsize - indicator fo
FREE

The indicator is based on the materials taken from the book: Bill Williams. Trading Chaos: Applying Expert Techniques to Maximize Your Profit. The indicator values at the top of each bar are calculated based on the location of the Open and Close relative to a third of the bar. The bar is divided into three parts. The lower third of the bar is the number three (3), the middle third of the bar is the number two (2), the upper third of the bar is the number one (1). The first number in the indicato
FREE

Shadow Height mt4 Shadow indicator.
Displays the size of candlestick shadows, in points, as a histogram. Works in three modes, user-selectable. Description of indicator settings Mode - indicator operation modes, three modes: first height - display mode for upper and lower candlestick shadows; the second difference - the mode of displaying the difference in candlestick shadows, the difference between the upper and lower candlestick shadows; the third superiority is the accumulated difference in
FREE

Unlock the Hidden Power of Every Candle with the Shadows Indicator! Tired of superficial price action analysis? Want a deeper understanding of the buying and selling pressure at each time frame? Introducing the Shadows Indicator – your indispensable tool for visualizing and analyzing the hidden dynamics of the market! This powerful indicator transforms the invisible battle between bulls and bears, reflected in the size of candle shadows, into a clear and informative histogram directly on your ch
FREE

ChannelRSI4 The Relative Strength Index (RSI) indicator with dynamic levels of overbought and oversold zones.
Dynamic levels change and adjust to the current changes in the indicator and prices, and represent a kind of channel.
Indicator settings period_RSI - Averaging period for calculating the RSI index. applied_RSI - The applied price. It can be any of the price constants: PRICE_CLOSE - Closing price, PRICE_OPEN - Opening price, PRICE_HIGH - Maximum price for the period, PRICE_LOW - Minimum
FREE

Trend indicator. The indicator identifies the major price movement trends and market them with different colors. It filters out and ignores the noise and short-term movements of the price against the main trend. This indicator is a tool that identifies the current trend in the market. With the default settings, the ascending ("bullish") trends are marked with green lines and the descending ("bearish") trends are marked with red lines. The indicator ignored sideways or flat movements, when the pr
FREE
The indicator shows the time of formation of the current bar in a percentage ratio.
Indicator Properties color_back1 - background color 1 color_flat1 - color of borders for background 11 color_back2 - background color 2 Alert_Percent - percent value for a sound alert Sound_file - the name of the sound file, the file must be located in the terminal_directory/Sounds and have the .wav extension
FREE
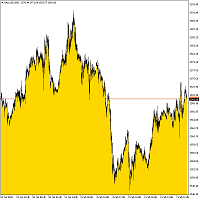
Bottom Background 4 The indicator sets the lower background of a certain color to the current price, depending on the settings. Description of indicator settings: MODE - three display options for the indicator: Low - display to the minimum price, Open / Close - display to the open or close price, whichever is lower, MA - display to the moving average. PeriodMA - moving average period.
FREE

Marginhedged Information indicator. Lot - set the required lot for calculations, set using the input field MARGININIT - Initial margin requirements for the specified lot MARGINHEDGED - Margin charged from overlapped orders per set lot PERCENT - Margin charged on overlapped orders expressed as a percentage Description of indicator settings: _color - set color An example of using the indicator:
One buy position with lot 1 is open in the market, the margin requirements in this case correspond t
FREE

The indicator displays a grid in the form of a "honeycomb" or regular hexagon. An alternative to the standard grid of the terminal. Description of the indicator settings: color_comb - grid color width - width, for example: 22 for a screen resolution of 1920*1080, 15 for a screen resolution of 1366*768, etc. height - height, for example: 6 for a screen resolution of 1920*1080, 4 for a screen resolution of 1366*768, etc.
FREE

Robo T Expert Advisor is a non-indicator trading system. Expert Advisor settings: Level_ord - distance from the current price for placing initial pending Buy Stop and Sell Stop orders, the default value is 22. Lot_1 - initial lot for buy series, the default value is 0.1. Lot_2 - initial lot for sell series, the default value is 0.1. TakeProfit - profit level, the default value is 30. TSProfitOnly - only profit is trailed. If disabled, trailing is also performed in the negative stop-loss area. Th

Hammering is an automated trading system which works on any currency pair. Multi-currency and single-currency trading is performed. Making decisions the EA uses signals of the Slope Direction Line indicator. Settings. Profit_Percent_AccountEquity = 0.4; - profit as percentage of free margin Fix_AccountEquity = 0; - fixed level of free margin FIX_PROFIT = 1000; - fixed level of profit period = 55; - indicator period. FilterNumber = 2; - indicator filter. ma_method = 3; - indicator averaging metho

ROBO GRID FX is a grid Expert Advisor. It is developed for intraday trading in the active market and on fast currency pairs. This is a grid EA with a closed-loop averaging system. The closed-loop averaging system represents a stable strategy of moving to breakeven in case of the deposit drawdown on fast and aggressive currency pairs. The EA places a grid of pending orders in both directions and locks it on the breakthrough of a quote fluctuation in the channel of 40-60 points in case of an unrpo

Pyramid MA - Characteristics of the EA: uses Moving Averages (MA) indicator. Changes order grid when a trend reverses. Exponent of order volume increase by the main trading grid against averaging positions. Works on pending BUYSTOP and SELLSTOP orders. Uses a system of averaging losses which controls a balance of open trades and moves it to breakeven. Sound alert about open and completed trades. You can easily create your own trading strategy on the basis of PYRAMID MA.
Expert Advisor settings:

The Expert Advisor is based on the indicator analysis. Trading decisions are made using Moving Average values. Indicators can be configured by external variables: TF = 0 - select a working timeframe. It can be one of the chart periods. 0 means the current chart period. 1 - 1 minute. 5 - 5 minutes. 15 - 15 minutes. 30 - 30 minutes. 60 - 1 hour. 240 - 4 hours. 1440 - 1 day. 10 080 - 1 week. 43 200 - 1 month. shift = 0 - index of obtained value from the indicator buffer (shifting back by specified

Forex Jumper is an Expert Advisor for trading EURJPY. Candlestick pattern analysis is used for generating trading signals. The EA uses BUYSTOP and SELLSTOP pending orders. Settings: Lot = 0 - manual setup of the opened orders' volume Risk = 13 - MM risk percentage, the parameter works if Lot = 0 MagicNumber = 208 - ID of EA orders and positions, magic number TP = 20 - virtual profit level in points if there is a single unidirectional open position on the market TP2 = 20 - virtual profit level in

Bands Jazz EA is based on the analysis of the Bollinger Bands indicator. The EA algorithm is simple - it uses Stop Loss, Take Profit and Trailing Stop.
Settings TimeBeginHour —trading start hour. Values 0 to 24. TimeBeginMinute —trading start minute. Values 0 to 60. TimeEndHour —trading end hour. Values 0 to 24. TimeEndMinute —trading end minute. Values 0 to 60. period —averaging period for Bollinger Bands calculations. deviation —number of standard deviations from the main line for Bollinger B

Smart YTG has been developed for trading GBPUSD on the H1 chart. This is a trend following system and works well during trending price behavior using STOP orders. It detects trend by analyzing the Price Channel indicator which is built straight into the Expert Advisor, therefore you do not need to additionally install any indicator. On the flat areas where the market is undecided, and further movement of the market is being determined, a breakeven function is activated, and if there are open pos

The Eureka Lock Expert Advisor detects flat price movement intervals relative to the specified settings. Trading is performed by BUY STOP and SELL STOP pending orders from the borders of the defined flat. Instead of limiting the losses, a loss-making position is locked by an increased volume. A virtual profit level is used as well.
Settings: TF_flet = 15 - timeframe a flat is detected at Bars_flet = 25 - amount of bars for a flat detection extern int Size_flet = 30 - distance limit between the

The product shows general information in a single chart window. It is convenient when you trade many symbols simultaneously. The indicator shows the total number of positions and pending orders. The following info is displayed for opened positions: symbol, amount of opened buy orders for this symbol and their total profit in deposit currency, amount of opened sell orders and their total profit, total profit of opened buy and sell orders. The following info is displayed for pending orders: symbol
Moving Average. Calculation method: average value of all prices used for determining a bar.
Description of External Settings of the EA: MA_period - period of averaging for calculation of the indicator. Recommended values: 5, 13, 21, 34. ma_method - averaging method. It can have any values of the Moving Average method (Moving Average). 0 - (SMA) Simple Moving Average. 1 - (EMA) Exponential Moving Average. SMMA 2 - (SMMA) Smoothed Moving Average. LWMA 3 - (LWMA) Linear weighed Moving Average.

Description of the Settings: MA_period_fast - The period of averaging for calculation of fast Moving Average. MA_period_slow - The period of averaging for calculation of slow Moving Average. price - price used. It can be any of the price constants. 0 - (CLOSE) Close price. 1 - (OPEN) Open price. 2 - (HIGH) The maximum price. 3 - (LOW) The minimum price. 4 - (MEDIAN) The average price, (high+low)/2. 5 - (TYPICAL) Typical price, (high+low+close)/3. 6 - (WEIGHTED) Weighed close price, (high+low+clo

The Piramida Grid EA analyzes the values of the Slope Direction Line indicator for determining position entry. The grid of orders changes once the market reverses. Works on pending BUYSTOP and SELLSTOP orders. Uses a system of averaging losses which controls a balance of open trades and moves it to breakeven. Automatic detection of 4 and 5 decimal places.
Expert Advisor Setup: period = 32; - period for the Slope Direction Line indicator FilterNumber = 2; - Slope Direction Line filter setup ma_m
The Martin Pristine trading robot analyzes the signals of the Price Channel Central indicator for trading decisions. No need to additionally attach the indicator to a chart, it's built into the Expert Advisor. After each losing trade, the lot is multiplied by 2. This Expert Advisor can detect 4 and 5-digit quotes automatically. Only one position can be open in the market at the same time.
Expert Advisor settings: TF = 15; - select the chart timeframe for Price Channel Central Bars_Count = 100;

The Future Price indicator shows the probable variants of a future price movement based on the searching for matches in the quotes history. The indicator works in two modes: the first iterates over and displays the specified number of variants, the second - the indicator displays one specified variant.
Settings Static_VARIANTS = 0; - display a specific variant; if = 0, iterates over all variants TOTAL_VARIANTS = 20; - the number of variants in the set, not greater than 30 is recommended Time_Se
This is a semi-automatic trading robot. Buttons are used to open/close positions. Further position tracking is performed automatically by virtual profit level. Loss-making positions are averaged by increased/decreased lots. The buttons do not work in the strategy tester meaning that you can check the EA only on demo and real accounts. Special settings OPEN_BUY and OPEN_SELL can be used to test the EA in the strategy tester.
Settings
MagicNumber - identifier of the EA's orders. The robot works o

The indicator determines flat areas of the price movement according to the specified parameters. Settings: FletPips - limit in points for determining the flat FletBars - limit in number of bars for determining the flat CountBars - number of bars in history for the analysis of price movement. 0 - all bars in history are analyzed colir - color of the price section determined as flat Dop - additional drawing of price labels Alerts - display a dialog box with custom data Text - custom text for notif

The BarKhan indicator is calculated as sum of differences of three digital moving averages. The calculation formula is as follows: the difference of digital moving averages 1 and 2 is added to the difference of digital moving averages 2 and 3 Description of the indicator settings: MA_Period1 - the period of the first digital moving average MA_Period2 - the period of the second digital moving average MA_Period3 - the period of the third digital moving average
Multi-currency indicator, analyzes 56 currency pairs simultaneously. It is important that all currency pairs are selected in the market watch with their history data downloaded. The indicator shows a rise or fall of a certain currency against the other 7 currencies as a total in the form of a line. The indicator values are expressed as a percentage.
Description of the indicator settings Type_Calculation - three options for calculating the percentage of the currency rise or fall Prefix - used wh

Multi-currency indicator, analyzes 56 currency pairs simultaneously:
AUD EUR GBP NZD CAD CHF JPY USD AUD SUMM EURAUD GBPAUD AUDNZD AUDCAD AUDCHF AUDJPY AUDUSD EUR EURAUD SUMM EURGBP EURNZD EURCAD EURCHF EURJPY EURUSD GBP GBPAUD EURGBP SUMM GBPNZD GBPCAD GBPCHF GBPJPY GBPUSD NZD AUDNZD EURNZD GBPNZD SUMM NZDCAD NZDCHF NZDJPY NZDUSD CAD AUDCAD EURCAD GBPCAD NZDCAD SUMM CADCHF CADJPY USDCAD CHF AUDCHF EURCHF GBPCHF NZDCHF CADCHF SUMM CHFJPY USDCHF JPY AUDJPY EURJPY GBPJPY NZDJPY CADJPY CHFJPY SUMM

The Expert Advisor does not use indicator, it is always in the market. The logic of the EA is based on the analysis of the previously opened orders present in the market. Expert Advisor settings: StopLoss_Percent - loss level in percent TakeProfit - profit level in points Risk - setting for automatic calculation of order volumes for the EA, works if LOT =0 LOT - fixed volume of orders Slippage - maximum allowed price slippage MagicNumber - magic number for EA's orders Show_Information - enable o
The Expert Advisor places a grid of orders with the specified step. Orders have the take profit level set at the distance of grid step, as well as the total stop loss level for all order of the same type. Trading is performed only within the time interval specified in the settings. Once the time ends, all pending orders are deleted and all open positions are force-closed. It is not recommended to use the EA as a fully automated trading system for continuous trading, only for working in certain m
The indicator works when there are open orders present in the market. It calculates the price, upon reaching which the total profit of all open orders will be equal to zero, the breakeven level. The calculation takes into account the orders of the currency pair the indicator is running on. Orders can be filtered by the magic number. Description of the indicator settings: Line_Create - display the breakeven line color_Line - line color style_Line - line style width_Line - line width Text_Create -
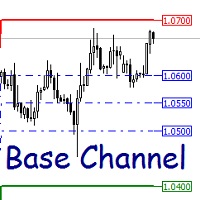
The indicator plots dynamic support and resistance levels. Description of the indicator settings: Channel_expansion_coefficient - channel expansion ratio
Main_Level - boundary size to recalculate the indicator levels ArrowRightPrice - enable/disable the display of the right price labels color_UP_line - color of the upper resistance line color_DN_line - color of the lower support line color_CE_line - color of the central lines style_ - style of the central lines width_ - width of the central lin
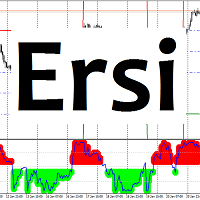
Ersi The indicator shows overbought and oversold zones. Zones can be adjusted by levels, set in the settings. Settings: Period_I - averaging period for calculating the indicator; Applied_Price - used price; Percent_Coefficient - percentage coefficient; Count_Bars - the number of bars to display the indicator; Overbought_level - overbought zone level; Oversold_level - oversold zone level; Overbought_color - color of the overbought zone; Oversold_color - color of the oversold zon

This version of the Hammering Expert Advisor has no multicurrency trading. Settings: Period_Indicators - averaging period for calculating the trading signals indicator Filter_Indicators - indicator filter setting
Method_Indicators - indicator averaging method Applied_Indicators - applied indicator price TimeFrame_Indicators - chart period for the indicator StopLoss_Percent - loss level, %. The value is set with a minus "-" sign, for example, -33 Trailing_Start - initial trailing level TrailingSt

The indicator measures the speed of ticks. The number of ticks per second. It is calculated as the number of ticks specified in an input, divided by the time of their appearance. It is possible to disable the audio signals about arrival of ticks using the button with the speaker icon: green - enabled, red - disabled.
Description of the indicator settings number_ticks - the number of ticks to start calculation. The calculation will start only after all the specified number of ticks fully arrives

The indicator works only on the chart periods smaller than the daily period. It shows the boundaries of the daily candle and trading sessions. Description of the indicator settings: Count_Bars - limit on the number of bars for indicator calculation lineColor - line color lineStyle - line style lineWidth - line width candle_up - color of bullish candle mark candle_dn - color of bearish candle mark candleWidth - candle width AsiaBegin - opening time of the Asian session AsiaEnd - closing time of t

The indicator points at the areas of the potential price reversals using alerts.
It is based on the moving average and RSI indicators, and shows their difference. Description of the indicator settings: EMA_Period — The averaging period for the calculation of the Moving Average indicator. EMA_Method — Averaging method. Can be any of the enumeration values, SMA — simple averaging, EMA — exponential averaging, SMMA — smoothed averaging, LWMA — linearly weighted averaging. EMA_Price — applied price.

The indicator displays Gann lines for one day. It works only on the timeframes smaller than daily. Description of the indicator settings: Count_Bars - the number of daily bars to display the Gann lines. If set to 0, they are displayed for all the available history bars. scaleGann1 - scale for line #1 (number of points per bar) clrGann1 - color of line #1 styleGann1 - style of line #1 widthGann1 - width of line #1 scaleGann2 - scale for line #2 clrGann1 - color of line #2 styleGann2 - style of li

ForexMarshalsSmart The EA's strategy is based on low-risk trading based on medium-term market trends. In the absence of aggressive scalping, the average profit per trade is 15-50 pips. ForexMarshalsSmart works with any MetaTrader 4 broker and meets the requirements of all the world's leading brokers. Description of the advisor settings: LotPosition - volume of market positions LotOrders - the volume of pending orders Distance - distance between orders, profit distance MagicNumber - advisor or

This is an oscillator with dynamic levels. Description of the indicator settings: mode - choose the line type: main line or signal line. Kperiod - the period (number of bars) for calculating the %K line. Dperiod - the averaging period for calculating the %D line. slowing - the slowing value. method - the averaging method. It can be any of the following values: Simple averaging. Exponential averaging. Smoothed averaging. Linearly weighted averaging. price - choose the price for calculations. It c

Twins Oscillator based on the Stochastic indicator. The upper readings of the indicator can be used as buy signals, the lower readings of the indicator can be used as readings for sell signals. Settings: Kperiod - period (number of bars) for calculating the% K line. Dperiod - averaging period for calculating the% D line. slowing - slowing down. method - averaging method (simple, exponential, smoothed, linearly weighted). price - price for calculation (0 - Low / High, 1 - Open / Close). Coeffic
This is the oscillator with dynamic levels based on CCI indicator. Settings: CciPeriod - averaging period for the indicator calculation. Price - applied price. AvgPeriod - averaging period for calculating the indicator smoothing. AvgMethod - averaging method for calculating the indicator smoothing. MinMaxPeriod - dynamic levels calculation period. _levelUp - upper level. _levelDown - lower level.

This is the RSI-based oscillator. Settings: Price - applied price. Possible values: PRICE_CLOSE - Close price; PRICE_OPEN - Open price; PRICE_HIGH - High price; PRICE_LOW - Low price; PRICE_MEDIAN - Median price, (high+low)/2; PRICE_TYPICAL - typical price, (high+low+close)/3; PRICE_WEIGHTED - weighted Close price, (high+low+close+close)/4. RSI_PERIOD - averaging period for calculating the index. K - dynamics ratio. Mode - averaging method. Possible values: SMA - simple; SMMA - smoothed.

This indicator displays the price changes in the form of rectangles ("bricks") in the background of the usual price chart. An upward movement of the price by the number of points specified in the settings is marked by adding a rectangle above the previous one, while a downward movement leads to adding it below the previous rectangle. The indicator is designed for visual identification of the main trend. It is used to determine the key support and resistance levels, as it averages the main trend.

The Expert Advisor trades using trendlines. You should draw a trendline on a chart. The name of the line should be in the following format: "Trendline" space digits. This is the default name used when a line is drawn on the chart, please do not change it. The EA supports two types of trading using the trendlines: a breakout strategy and a roll back strategy. A trade signal is generated on the last but one bar (the completed one), if its open price is below/above the trendline and its close price
This indicator is a mathematical expression of the rate of price movement over time. Overbought and oversold market states comprise the basic concepts of the oscillator. The market is considered to be overbought when the indicator line is near its upper limit. In the oversold state, the indicator line is near the lower limit. The indicator also takes into account the crossover of lines. It notifies the user by displaying a dialog box, sending an email or push notifications to mobile terminals.

This indicator represents a trading strategy. It is based on 3 standard indicators: two moving averages (MA) and the Relative strength index (RSI). Indicator signals are generated when the moving averages intersect, while the RSI indicator is located relative to level 50. If the fast moving average is above the slow moving average while the RSI indicator is above 50, open a buy order. If the fast moving average is below the slow moving average while the RSI indicator is below 50, open a sell ord
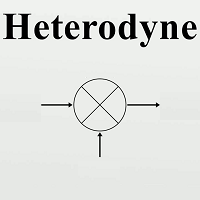
Heterodyne is an RSI-based oscillator. The current indicator value is compared with the indicator's maximum and minimum values for the specified period and an average value is calculated. Also, the indicator values are smoothed using the moving average (MA) method. Buy when the indicator crosses a specified level upwards. Sell when the indicator crosses a specified level downwards.
Options RSIPeriod - indicator period Coefficient - ratio for searching maximum and minimum values Midline - signal

The Expert Advisor performs trading operations using the signals of the Heterodyne indicator. The indicator is built into the EA, so there is no need to additionally launch it in a price chart. Buy signals are generated when the indicator crosses a given level upwards, sell signals are generated when the indicator crosses the level downwards. If orders have not reached the specified profit, the Expert Adviser opens repeated orders with an increased lot, following the signals of the indicator. Th

Grid Primordial The Expert Advisor uses the readings of two indicators RSI and Moving Average as signals to enter the market. The market is entered with a market position and a grid of Buy Stop or Sell Stop pending orders. Orders and positions have physical profit and loss levels. The EA implements the method of locking positions that have not reached the level of loss limitation, while using the second profit level specified in the deposit currency.
Description of settings RSIPeriod - averag

Grade Day The indicator of trend lines of support and resistance, calculated for one day. The indicator does not display its readings on a chart period higher than 4 hours. Description of settings color_1 - color of the third support line width_1 - thickness of the third support line style_1 - style of the third support line color_4 - color of the second support line width_4 - thickness of the second support line style_4 - style of the second support line color_6 - color of the first support l
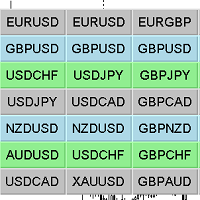
Chart Changer Indicator for fast navigation through financial instruments. When you click on the button, you go to the chart of the financial instrument, the name of which was written on the button.
In other words, the indicator opens or unfolds an existing chart window, if there is no such chart, the indicator will open it if it exists in the market watch of this terminal.
For each chart, you can customize the name of the financial instrument, text color and background color; in total, you ca

"Trend Navigator": The Indicator That Unlocks the Secrets of Market Dynamics Forget wandering through the labyrinths of price fluctuations! The "Trend Navigator" indicator is your personal compass in the world of financial markets. It clearly visualizes the three fundamental directions of price movement: a rapid surge upwards, an unstoppable fall downwards, and a calm sideways drift. This tool is your faithful assistant in determining the dominant trend direction . In simple terms, it makes invi

A Captivating Glimpse into the Market: The Instant State Indicator Unlock a powerful tool for graphical analysis that instantly reveals the current state of the market! This indicator, elegantly positioned in a separate lower window, acts like a seasoned analyst, clearly signaling the phase the price is in. Its primary value lies in its ability to proactively warn of potential trend reversals, providing traders with a valuable opportunity for timely entry into profitable positions. Flexible Sett

Eureka v72 Evolution Without an indicator trading robot, the chart period does not affect its operation. It mainly uses pending orders BUY_STOP and SELL_STOP for work. For pending orders, the Expert Advisor uses fixed stationary levels, the levels are regulated by the Expert Advisor settings. The Expert Advisor can also work in the order grid mode, placing a specified number of orders on both sides of the current price.
Description of the advisor settings
____1___ "Order Settings"; Displaceme

Trend Actual Indicator of the direction of the current trend. The direction is determined by the position of the indicator line relative to the zero level, if the line is above the zero level - the trend direction is upward and purchases are assumed, if the indicator line is below the zero level - the trend direction is downward and sales are assumed. When the indicator line crosses the zero level, the trend changes to the opposite one. Description of indicator settings: period - indicator per
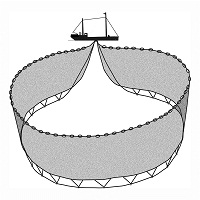
Dragnet Grid The Expert Advisor works with a grid of pending orders. Flexible configuration of the EA allows simultaneous placing of limit and stop orders, as well as separate ones. Moreover, there can be only one type of orders in the market that are above or below the current price. Description of the advisor settings: ____1____ Stop Orders - informational setting; Grid_Stop_BUY - enable or disable the grid for BUY STOP orders above the current price; Grid_Stop_SELL - enable or disable the g

Bond14 Without an indicator trading robot, it uses the analysis of already open orders to make trading decisions. A grid of orders with flexible settings and restrictions is used. The Expert Advisor is always in the market. Description of settings Lot - the volume of orders, if the value = 0, the order volume is automatically determined, Choice_method - calculating the volume of orders from the account balance or free funds, Risk - percentage level for automatic determination of order volume,

Lucky Traders A universal Expert Advisor with flexible settings, it works with pending orders. The robot can be used to accelerate small deposits starting from 100 balance units using the settings of the scalping trading strategy. The user can choose the work of the advisor based on signals from 10 indicators, two of which are custom. The Expert Advisor can also be configured for non-indicator work. Only one indicator can be selected for the Expert Advisor at a time. There is a single Period_
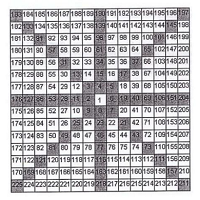
Gunn Crosses: Unveiling Market Geometry with Gann Crosses and W.D. Gann's Trading Methods! Eager to deepen your technical analysis by harnessing the powerful geometry of Gann squares? The Gunn Crosses indicator offers you a unique way to visualize support and resistance levels calculated based on the diagonal and cardinal crosses of the legendary Gann square, a key element in the comprehensive arsenal of trading techniques employed by William Delbert Gann. This indicator is a valuable tool for t
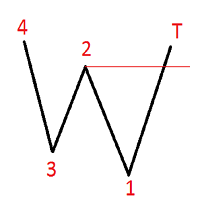
ZigZag Alert The indicator is based on the standard ZigZag.
Displays on the chart and signals the emergence of a certain formed pattern.
At the user's choice, the indicator signals are displayed in the terminal, or an e-mail to the address,
or sends a notification to the mobile terminal. Pattern conditions for the upward movement signal:
the price at point 4 must be higher than the price at point 2, the price at point T must be higher than the price at point 2.
When moving down, on the contrar

Resistance Support Day: Your Daily Navigator of Market Boundaries! Tired of constantly redrawing support and resistance levels that seem relevant for only a fleeting moment? Do you desire a clear, dynamic picture of key price thresholds, specifically calculated for each individual trading day, allowing you to make informed decisions with greater confidence and accuracy? Introducing the Resistance Support Day indicator – your reliable tool for identifying dynamic support and resistance levels, ca
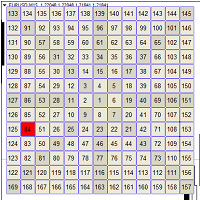
Gunn Chart: Unlock the Geometry of the Market for Precise Predictions! Are you looking to move beyond linear analysis tools and see the market in a new, geometric perspective? Do you want to harness the power of the Gann Square to identify key support and resistance levels, as well as potential reversal points? Introducing the Gunn Chart – an innovative indicator that visualizes price movement within the context of the legendary Gann Square. This tool unlocks a unique way to analyze market struc
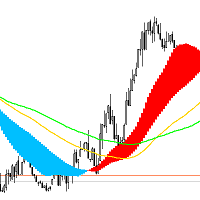
DveMashki Indicator: A Tool for Identifying Trends and Sideways Markets The DveMashki indicator is a powerful tool for analyzing market trends and detecting flat or consolidation phases in price movement. Based on moving averages, this indicator allows traders to visually assess the current trend and its strength, as well as recognize quieter, consolidating phases. This can be especially helpful for selecting the most suitable trading strategy based on market conditions. Features and Uses of the

This Expert Advisor does not use indicators, it trades using BuyStop and SellStop orders. All operation and calculations of the EA are based on currently placed pending orders and open positions. The EA automatically increases the lot size for position averaging. The stop loss level is set as a negative number specified in percent of the balance. When the EA starts, two pending orders are placed. If an order is triggered, it is either closed by take profit, or (if the order is unprofitable) an a

Tarzan The indicator is based on the reading of the relative strength index.
The fast line is the index readings from the senior period, it is redrawn for the number of bars that fit into one bar of the senior period, for example: if the indicator readings from the H4 period are set and the indicator is set to M15, the redrawing will be 16 bars on the M15 period.
The slow line is a smoothed moving average index.
The indicator uses different types of signals to make trading decisions, depending

WavesTrends This oscillator is one of the market indicators used when the price fluctuates within a certain range. The oscillator has its own boundaries (upper and lower), when approached, the market participant receives information about the oversold or overbought market. The indicator registers price fluctuations within the limits of a certain volatility. If the oscillator signal is confirmed by the price chart, then the probability of a trade will increase. This direction is reflected in th

Slick The indicator is a double-ironed Relative Strength Index (RSI) with alert signals for making trading decisions. The indicator follows the price, its values range from 0 to 100. The scope of the indicator is the same as that of the regular RSI indicator. Description of indicator settings: Period_1 - period for calculating the index Period_2 - primary period of indicator smoothing Period_3 - secondary period of indicator smoothing MAMethod - anti-aliasing method AppliedPrice - price consta

Renko graph The Renko indicator in the main chart window at the location with the current price. The indicator displays price changes in the form of rectangles ("bricks") against the background of a regular quote chart. The upward movement of the price, by the number of points specified in the settings, is marked by adding above the previous next rectangle, and downward movement - below the previous rectangle. The indicator is designed to visually identify the main trend. Used to identify key su

Day Channel The indicator draws a channel built on the extremum levels of bars from the older period set in the settings, and also displays the level of closing prices. For the indicator to work correctly, the current period for which the indicator will be set must be less than the specified period in the indicator settings. Description of indicator settings: TimeFrame - selection of a period for plotting indicator levels. By default, the daily chart period is set. LevelClose - enable or disab

Scalper Private The Expert Advisor can work in any trading modes, starting from scalping, as well as for medium and long-term operating modes, it all depends on the settings of the Expert Advisor. Description of the advisor settings: Time_next_order - time in seconds after which the next order will open Lot - lot of orders TakeProfit - profit level StopLoss - loss level Time_close_order - time in seconds after which a profitable order will be closed MagicNumber - advisor orders identifier Trai

No indicator trading system. The work uses pending orders BUY STOP and SELL STOP. Description of the advisor settings: Lot - starting volume of orders StartDist - distance to start pending orders OrdersDist - distance between orders Countlimitorders - the number of simultaneously open orders ProfPercent - profit level as a percentage MagicNumber - advisor orders identifier lot_ratio - multiplier for order lots

Crazy Scalper mt5 Crazy scalper Crazy Scalper is a non-indicator trading robot that uses a scalping system that trades in two directions simultaneously (buys and sells). At the same time, multidirectional positions cannot be profitable, and one of the open positions will necessarily go to a loss. If there is a losing position, a lock (lock) is used. In turn, if the locking position has not fulfilled its role and the quote reversed, the withdrawal is used without loss, according to the averag

Smart YTG mt5 Expert Advisor for the MT4 terminal Smart YTG was written to work on the GBPUSD and EURUSD currency pairs, chart period H1. In essence, the system is trending and works perfectly on trend sections of price movement with STOP orders, the trend is determined by analyzing the Price Channel indicator built into the inside of the Expert Advisor; there is no need to additionally install the indicator. In the flat areas, when the market is indecisive and the further movement of the ma
Dragnet mt5 Fully automated trading robot. Doesn't use indicators, constantly market. Analyzes the current open positions to make trading decisions. There is no martingale, no increase in trading lots. Description of settings Count_All - number of positions for total profit Lot - position volume, if = 0, the Risk parameter works Risk - automatic lot calculation from the trading account balance TakeProfit - profit level of a single position Steps - step between positions ProfitTarget - total pr

Coulter_Precision — Enhance Your Market Potential with Precision and Control Coulter_Precision is a professional trading advisor designed for traders who seek to control every aspect of their strategy on the market. By working exclusively with pending orders, this EA allows you to focus on planning entry points and managing risks, leaving the mechanical part of the work to an automated assistant. The unique feature of Coulter_Precision is that it does not make decisions on its own about the trad