Shadow Height mt5
- Indicators
-
Iurii Tokman
 Veda http://ytg.com.ua resource - the author works for automation of trade on the forex market - advisers, experts will, trading robots, indicators, trading strategies, scripts, functions and libraries.
 - Version: 1.0
Unlock the Hidden Power of Every Candle with the Shadows Indicator!
Tired of superficial price action analysis? Want a deeper understanding of the buying and selling pressure at each time frame?
Introducing the Shadows Indicator – your indispensable tool for visualizing and analyzing the hidden dynamics of the market! This powerful indicator transforms the invisible battle between bulls and bears, reflected in the size of candle shadows, into a clear and informative histogram directly on your chart.
What are candle shadows and why are they so important?
Candle shadows, or "wicks" and "tails," represent the highest and lowest prices reached during a specific time period before the price closed at a particular level. Long upper shadows indicate strong selling pressure, pushing the price down from its reached high. Conversely, long lower shadows point to active buyers who bought up the price dips.
The Shadows Indicator empowers you to:
- Visualize the strength of market participants: Instantly assess the dominance of buyers or sellers on each candle by observing the height of the corresponding histogram bars.
- Identify potential reversal points: Disproportionately long shadows can signal exhaustion of a trend and a possible future price reversal.
- Confirm signals from other indicators: Use information about shadow size as an additional filter to confirm signals from your favorite indicators.
- Improve understanding of volatility: Observe changes in shadow size over time to gauge the level of market volatility.
- Make more informed trading decisions: With a more complete understanding of the internal price dynamics, you can make more confident and accurate trading decisions.
The Shadows Indicator offers two unique operating modes, tailored to your needs:
-
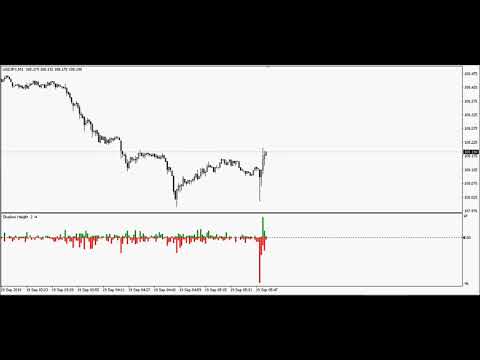
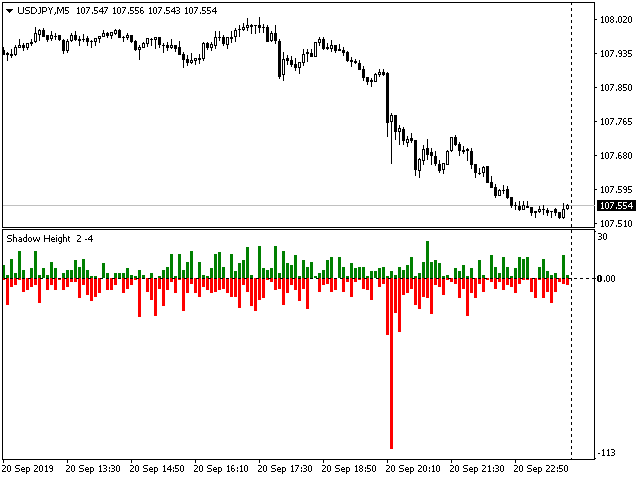
"Height" Mode:
- Displays the separate height of the upper and lower shadows of each candle in points.
- Provides a clear visual representation of the absolute strength of buyers and sellers at each time interval.
- Ideal for quickly assessing the dominant force in the market.
-
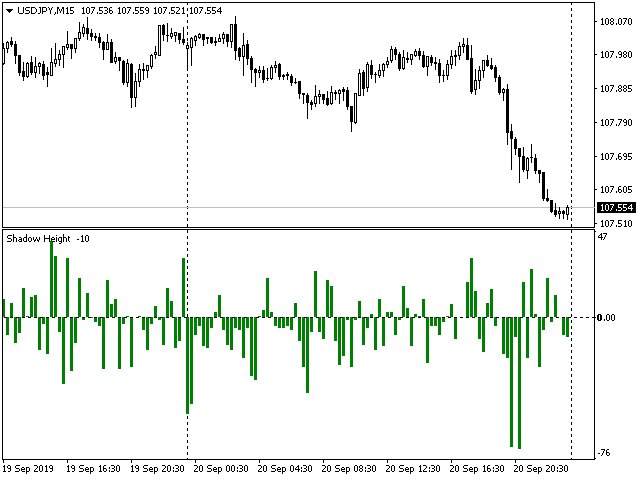
"Difference" Mode:
- Displays the difference between the height of the upper and lower shadows of each candle in points.
- Highlights the imbalance between buying and selling pressure.
- Helps identify candles with a significant advantage for one side, which can be an important signal for further price movement.
Settings that make the indicator even more convenient:
The Shadows Indicator features intuitive settings that allow you to customize it to your trading style and preferences:
- Mode: Choose between "height" and "difference" modes depending on your analytical goals.
- (Additional potential settings for expanded description):
- Option to change the color of the histogram bars for upper and lower shadows.
- Adjustment of the period for smoothing the histogram (if applicable).
- Selection of displaying values in pips or other units.
Advantages of using the Shadows Indicator:
- Deep analysis of the internal price structure.
- Clear visualization of the battle between buyers and sellers.
- Potential identification of early trend reversal signals.
- Increased accuracy of trading decisions by confirming signals.
- Simple and intuitive to use.
- Flexible settings for personalization.
Don't miss crucial information hidden in the candle shadows! Add the Shadows Indicator to your arsenal today and gain an edge in understanding market dynamics!
Download the Shadows Indicator right now and start seeing the market in a new light!