RatingMeter
- Indicators
-
Evgeniy Zhdan
 ➖➖➖➖➖➖➖➖➖➖➖➖➖➖➖➖➖➖➖➖➖➖
Products: https://www.mql5.com/en/users/trendhunter/seller
➖➖➖➖➖➖➖➖➖➖➖➖➖➖➖➖➖➖➖➖➖➖ - Version: 1.10
Rating Meter: one consolidated rating from 26 indicators
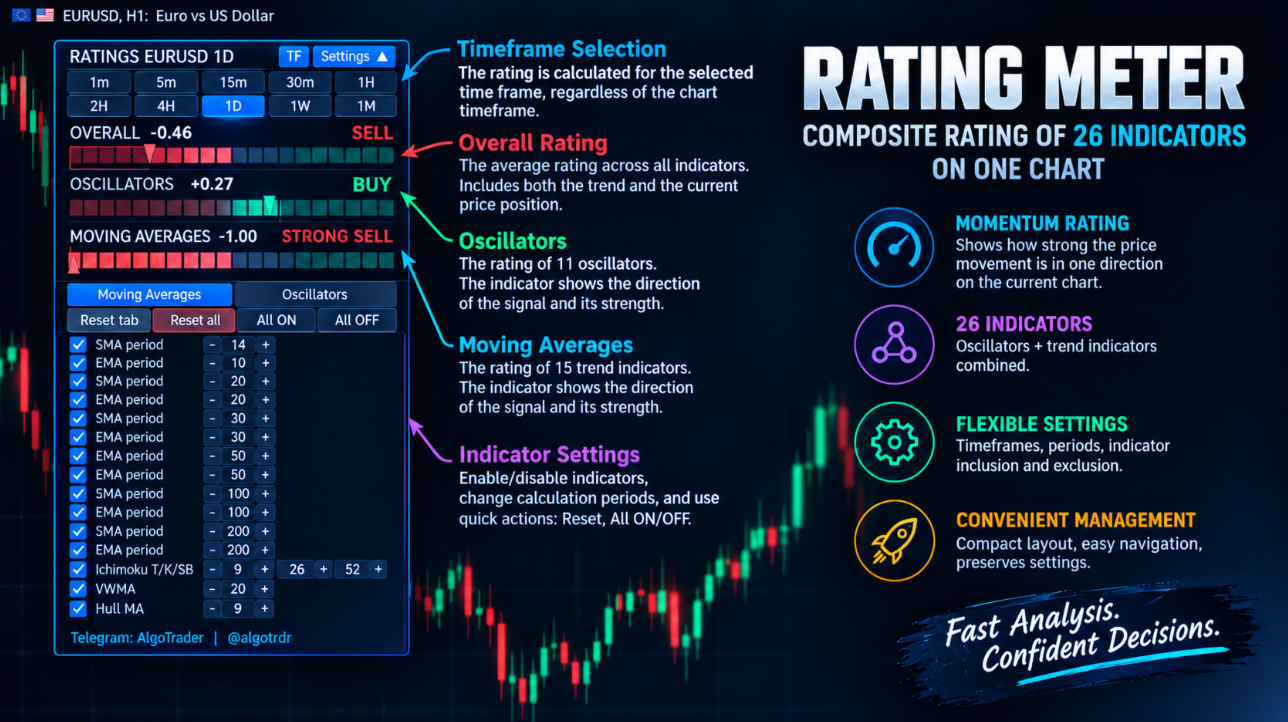
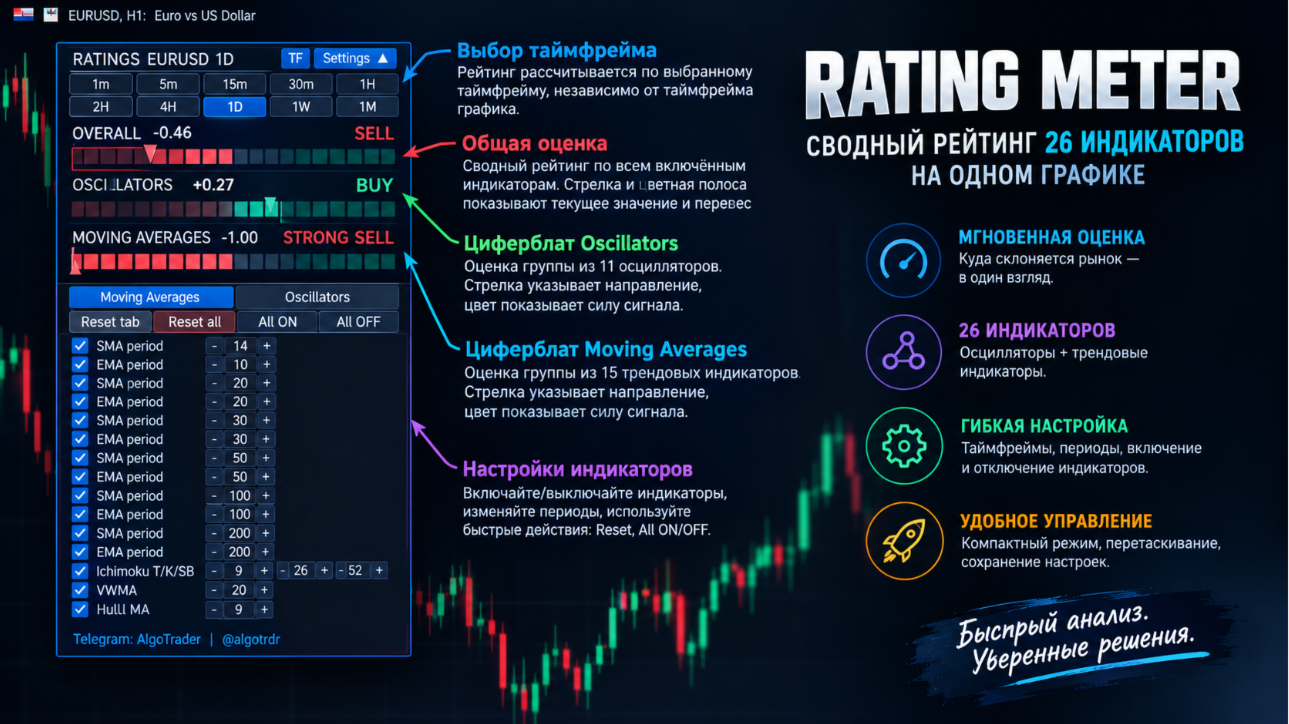
Rating Meter calculates the signals of 26 popular indicators for you and merges them into a simple sell / neutral / buy rating. You don't have to open indicator windows and compare readings by hand. One glance at the panel shows which way the market is leaning on the selected timeframe.
Our products: https://www.mql5.com/en/users/trendhunter/seller
What the panel shows
- Oscillators gauge: the rating of a group of 11 oscillators: RSI, Stochastic, CCI, ADX, Awesome Oscillator, Momentum, MACD, Stochastic RSI, Williams %R, Bulls/Bears Power and Ultimate Oscillator.
- Moving Averages gauge: the rating of a group of 15 trend indicators: SMA and EMA with periods 10, 20, 30, 50, 100 and 200, Ichimoku, VWMA and Hull MA.
- Overall bar: the combined rating of all enabled indicators.
The needle and the triangular pointer on the rim show the current value: left means sell, right means buy. The part of the scale between the center and the needle is lit brightly, so the dominant side is clear at a glance.
Under each scale you'll see:
- the recommendation: STRONG SELL, SELL, NEUTRAL, BUY, STRONG BUY;
- the numeric rating from −1 to +1;
- counters showing how many indicators vote sell, neutral and buy.
How the rating is calculated
Each indicator casts one vote by its own rules: +1 (buy), 0 (neutral) or −1 (sell). For example:
- a moving average votes buy when it is below the price and sell when it is above;
- RSI votes buy when it is below 30 and rising, and sell when it is above 70 and falling;
- MACD votes buy when the main line is above the signal line.
The group rating and the overall rating are the arithmetic mean of the votes:
| Rating value | Recommendation |
|---|---|
| +0.5 and above | STRONG BUY |
| +0.1 to +0.5 | BUY |
| −0.1 to +0.1 | NEUTRAL |
| −0.5 to −0.1 | SELL |
| −0.5 and below | STRONG SELL |
You can change the zone boundaries with the "Neutral zone half-width" and "Strong signal level" settings.
Controls right on the chart
- Timeframes: two rows of buttons from 1m to 1M. The rating is calculated on the selected timeframe regardless of the chart's own timeframe, so you can, for example, watch the daily rating on an M5 chart.
- Indicator settings: the "Settings" button expands the list. Every indicator has a checkbox that includes or excludes it from the calculation, and "+" and "−" buttons for its periods. The rating recalculates instantly.
- Tabs: Moving Averages and Oscillators switch the settings list.
- Reset: "Reset tab" (current tab), "Reset all" (everything, including the timeframe and panel position), "All ON" and "All OFF".
- Compact mode: the "TF" and "Settings" buttons hide the extras, leaving only the scales.
- Dragging: move the panel anywhere on the chart by its title bar.
- Memory: the panel position, checkboxes and period values are saved between terminal restarts. This is controlled by the "Remember settings between restarts" setting.
Settings
- "Start timeframe": the timeframe on startup.
- "Panel X offset, px" and "Panel Y offset, px": the initial panel position.
- "Show settings section on start": whether the settings list is open on startup.
- "Remember settings between restarts": whether settings are saved.
- "Refresh interval, sec": how often the rating updates.
- "Neutral zone half-width" and "Strong signal level": the rating zone boundaries.
- "Buy color", "Sell color", "Neutral color", "Panel background" and "Text color": colors.
Good to know
- The rating is calculated on the latest candle, including the one still forming, so values may change while the candle develops.
- The indicator draws nothing on the price chart and does not open trades. It is a helper panel for assessing the situation, not a ready-made trading system.
- The rating shows how the indicators voted. It does not guarantee the direction of price. Use it together with your own strategy and risk management.
- Up to 1200 bars of history are used for the calculation. If a timeframe has too little history, some indicators (for example, SMA 200) cannot be calculated, and a note appears in the panel title.