Trade Behavior Mirror
- Indicators
- Version: 1.10
- Updated: 16 September 2026

Trade Behavior Mirror reads your own account's closed trade history and counts one specific pattern: opening a new position shortly after a loss, at a lot size larger than your own recent normal. It does not predict, and it does not advise. Every number on the panel is something that already happened on this account.
How the numbers are built: it reads up to 31 days of closed deals across every symbol and every magic number - this is an account-wide picture, not a chart-specific one. From the 30 days before today it takes the median number of entries per day and the median lot size of those entries; both use the median, not the average, so one unusually large trade does not shift the whole baseline. With fewer than 5 entries in that 30-day window there is not enough history to set a fair baseline, and the panel prints "Collecting history" instead of a number built on too little.
The core count, shown as Entries within 10min of a loss, at above-median lot:: for every new entry, it checks whether a loss closed in the 10 minutes before it, and whether that entry's lot size was above the 30d median lot. Matches are counted separately as Today and as Last 7 days. The 10-minute window and the 5-entry minimum are both fixed in the tool - there is nothing to configure here, and nothing the panel is trying to talk you into.
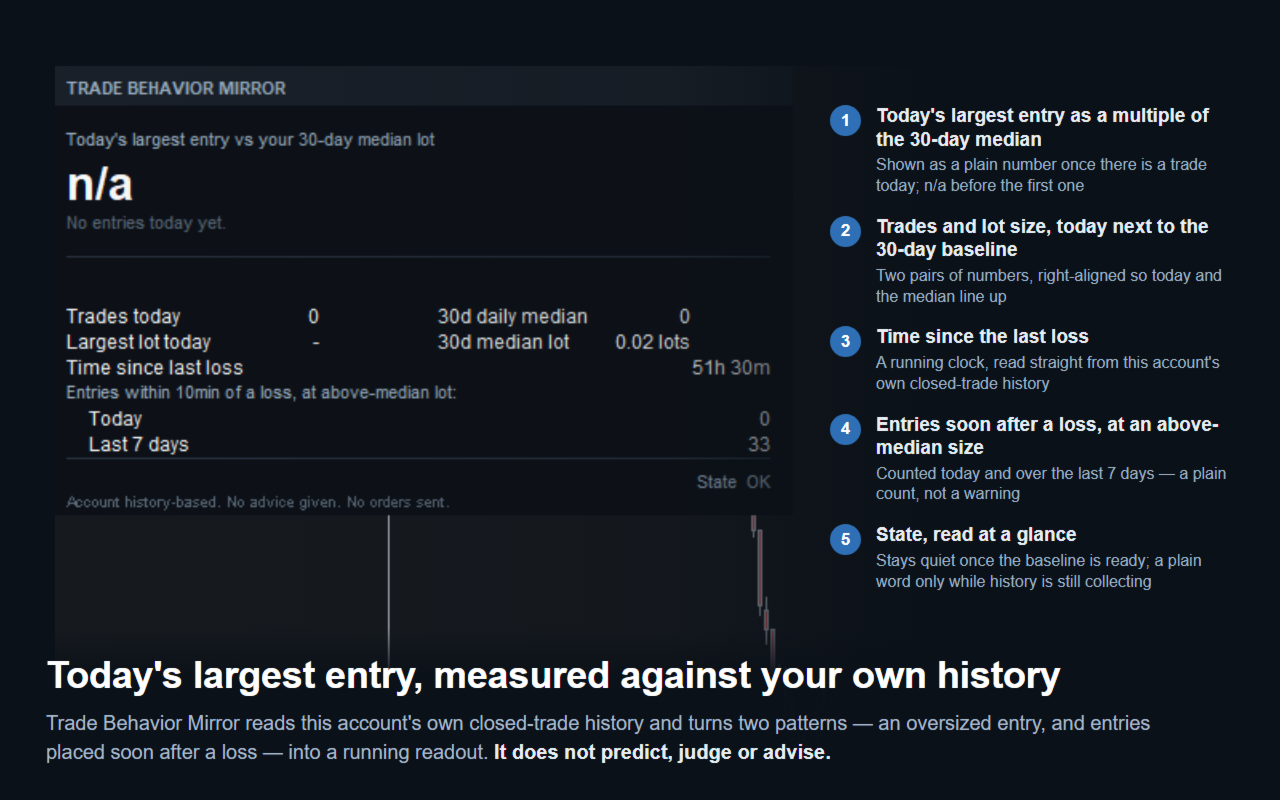
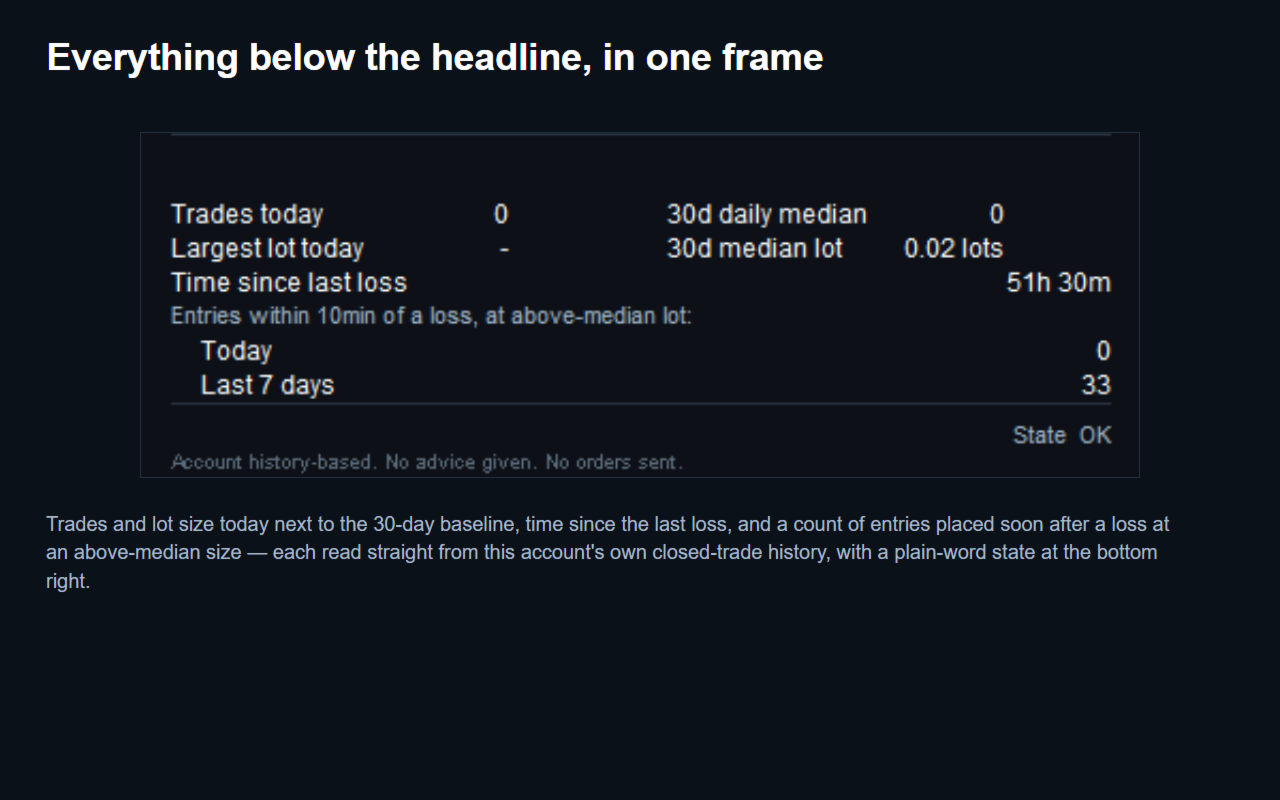
Screenshot 1, EURUSD M15, a demo account that already had real trading history: the headline shows today's largest entry measured against the 30-day median lot, and because nothing has opened yet today it reads n/a over the line No entries today yet. Below that, Trades today reads 0, the 30d daily median reads 0, Largest lot today shows a dash, the 30d median lot is 0.02 lots, Time since last loss is 51h 30m, and under Entries within 10min of a loss, at above-median lot: the Today count reads 0 while the Last 7 days count reads 33. State reads OK. Every figure there is what this account's own closed history held at the moment of capture - not a placeholder, not an estimate.
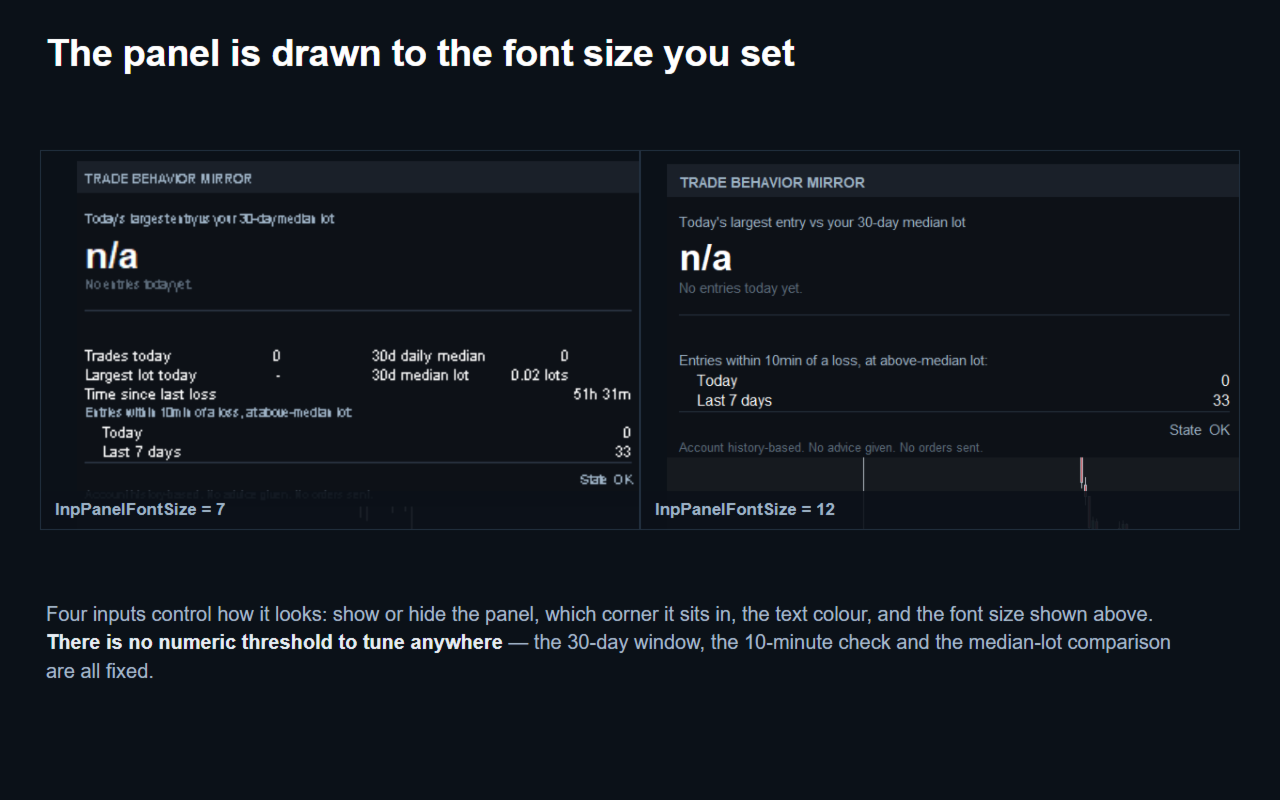
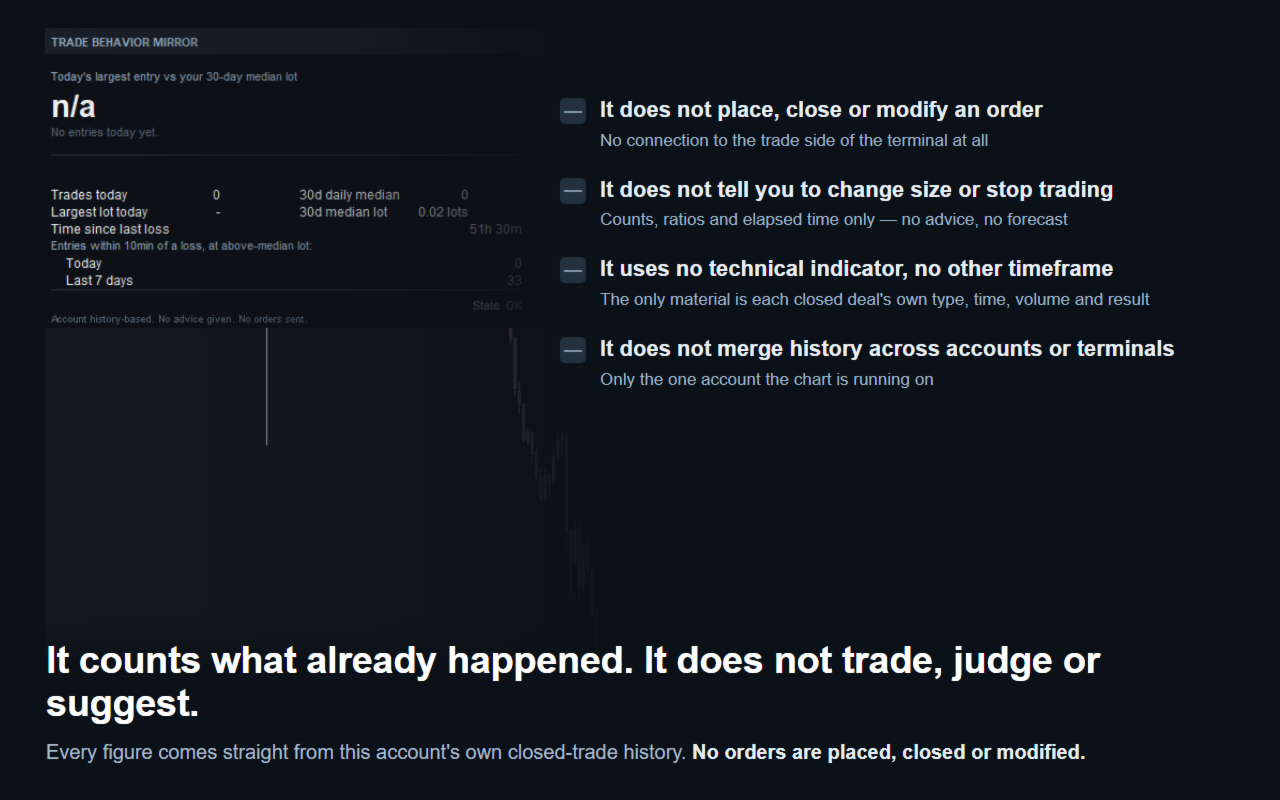
Screenshots 2 to 4 are the same panel, on the same account, at the same moment, read three ways. Screenshot 2 enlarges the block below the headline, so the two pairs of numbers, the elapsed time and the two counts can be read at full size. Screenshot 3 puts font size 7 and font size 12 side by side, which is one of the four display inputs. Screenshot 4 sets out what the tool does not do. Those inputs move only where the panel sits, how large its text is and what colour it has - the figures themselves come from the whole account's history rather than from the symbol on the chart in front of it, so switching symbols or timeframes never changes what the panel reports.
What it does not do: it never places, closes or modifies an order - there is no connection to the trade side of the terminal at all. It uses no technical indicator and no other timeframe; the only material is each closed deal's own type, time, volume and net result. It never tells you to change your position size or to stop opening trades - the panel states counts, ratios and elapsed time, and nothing else. It does not show a hit rate, a net result, or any forecast of future results. It does not merge history across multiple accounts or terminals - only the one the chart is running on. Deposits, withdrawals and other non-trade balance operations are excluded from every count.
Four inputs, all of them about how the panel looks: show or hide it, which corner it sits in, its font size, and its text color. There is no numeric threshold anywhere in the settings, because the tool is not asking you to tune anything - load it on any chart and it reads that account's own trade history.
One condition worth knowing before testing it: the Strategy Tester's account history only contains deals made during that specific test run, so on a fresh test the panel will normally show "Collecting history" throughout. This is a property of how the Tester works, not a fault in the tool - loaded on a live account or a demo account with real trading history, the panel fills in with that account's own measured numbers from the first tick.
This is one of a small set of free, no-advice account-history tools from the same author, alongside Win Streak Size Creep Mirror, which tracks lot size growth during a run of wins, and Multi Symbol Chase Mirror, which counts how many different symbols new positions were opened on. The author's MQL5 profile lists these free tools together with several paid MT5 indicators and utilities for gold-specific signals, trade risk limits and backtest-versus-live auditing, for traders who want more building blocks beyond this free measurement tool.
Free, with no reduced or trial version behind it - what is described above is the whole tool.