Donchian Breakout And Rsi

General Description

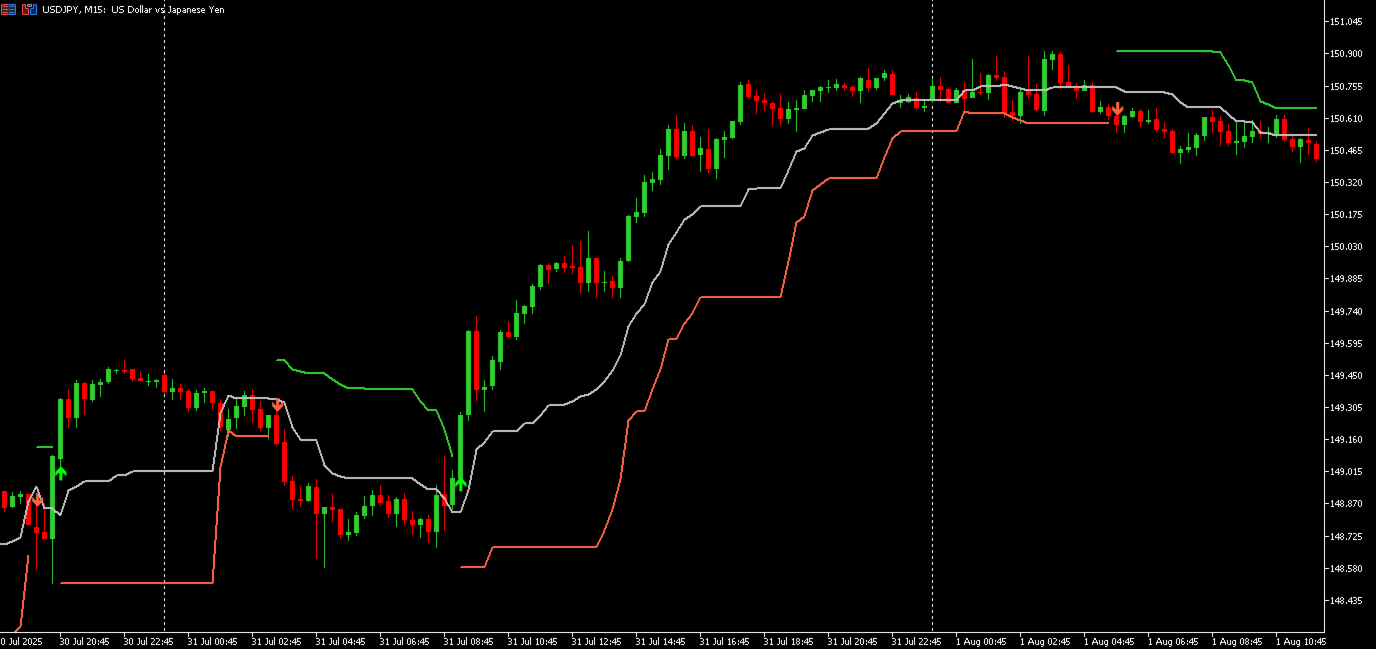
This indicator is an enhanced version of the classic Donchian Channel, upgraded with practical trading functions.
In addition to the standard three lines (high, low, and middle), the system detects breakouts and displays them visually with arrows on the chart, showing only the line opposite to the current trend direction for a cleaner view.

The indicator includes:

  • Visual signals: colored arrows on breakout

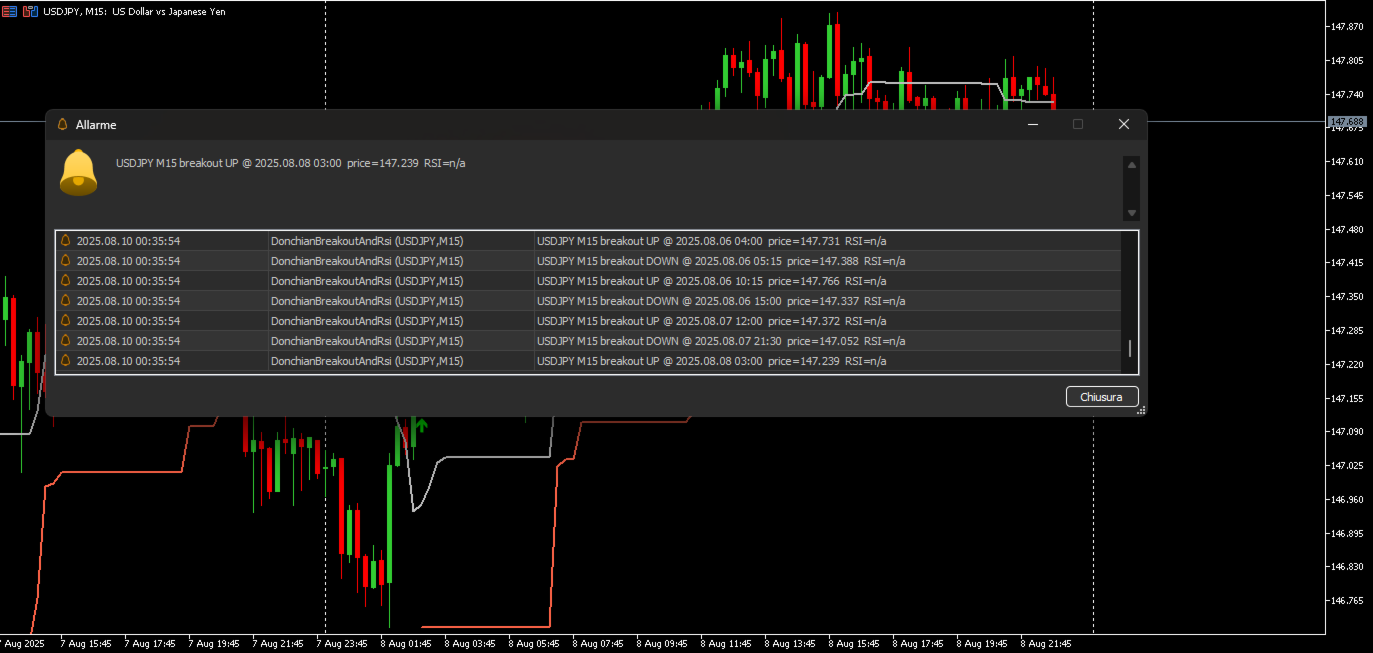
  • Automatic notifications: popup, push, and email

  • RSI filter: to validate signals based on market relative strength

  • Customization options: colors, line thickness, arrow codes, RSI thresholds

How it Works

The Donchian Channel calculates:

  • Upper line: highest high of the last N closed bars

  • Lower line: lowest low of the last N closed bars

  • Middle line: average between the high and low

A bullish breakout occurs when the closing price rises above the upper line, while a bearish breakout occurs when the closing price falls below the lower line.

The indicator:

  1. Draws the three Donchian lines

  2. Displays arrows only on the first breakout after a change of direction

  3. Hides the line following the trend (bullish trend: shows only the red lower line; bearish trend: shows only the green upper line)

  4. Can filter breakouts with RSI to reduce false signals

  5. Can send real-time notifications
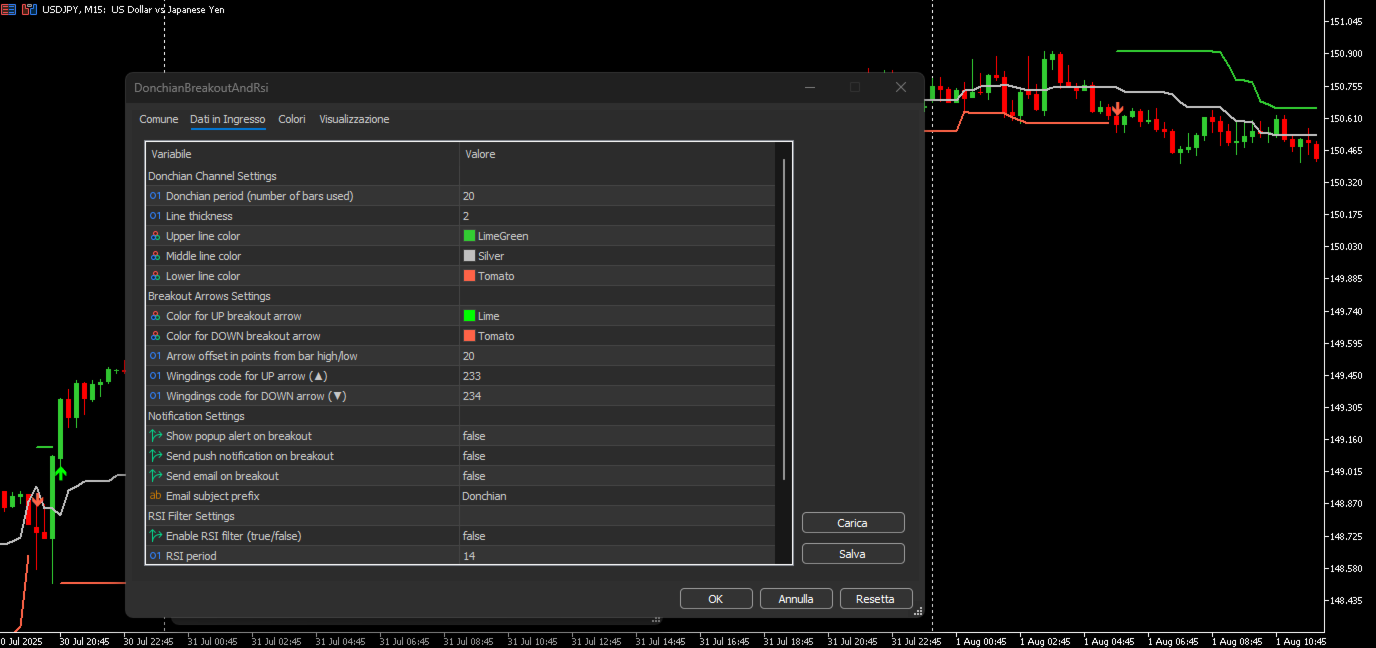
Input Parameters

Donchian Channel Settings

  • indPeriod: number of closed bars used to calculate channel highs and lows

  • LineWidth: line thickness

  • UpLineColor: color of the upper line

  • MidLineColor: color of the middle line

  • DnLineColor: color of the lower line

Breakout Arrows Settings

  • ArrowUpColor: color of the bullish breakout arrow

  • ArrowDownColor: color of the bearish breakout arrow

  • ArrowOffsetPts: distance in points from the bar high/low

  • ArrowUpCode: Wingdings code for bullish arrow

  • ArrowDnCode: Wingdings code for bearish arrow

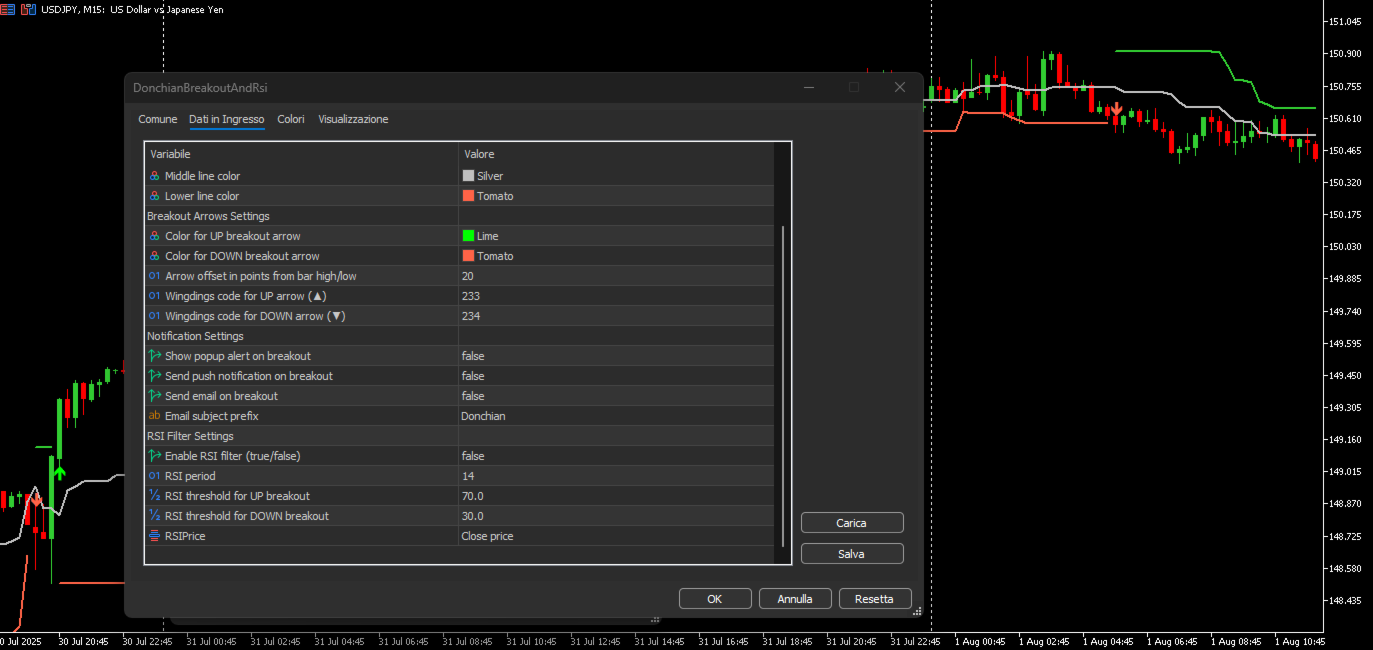
Notification Settings

  • EnableAlertPopup: enable/disable breakout popup alert

  • EnablePush: enable/disable push notification to mobile terminal

  • EnableEmail: enable/disable email sending

  • EmailSubjectTag: prefix for the sent email subject

RSI Filter Settings

  • EnableRSIFilter: enable the RSI filter to confirm breakouts

  • RSIPeriod: RSI calculation period

  • RSI_UpperThr: minimum RSI value required for bullish breakout validation

  • RSI_LowerThr: maximum RSI value required for bearish breakout validation

Recommended Usage

  • Breakout trading: to enter positions at key level breakouts

  • Trend following: to ride strong directional movements

  • Multi-strategy confirmation: use RSI or other indicators to validate signals

  • Multi-timeframe monitoring: apply the indicator on several timeframes for confirmation

donchian channel, donchian breakout, mt5 indicator, mql5 indicator, forex indicator, breakout strategy, rsi filter, trend indicator, price channel, trading breakout, mt5 notifications, mt5 alerts, mt5 push notification, mt5 email alerts, breakout trading, donchian channel mt5, forex trend, scalping mt5, swing trading, price action, support resistance, trend following, rsi trading, price channel indicator, trading signals, breakout indicator, high low channel, period high low, automated trading, mt5 indicator download, mql5 indicator free, price channel strategy, breakout alert


Recommended products
Follow The Line MT5
Oliver Gideon Amofa Appiah
4.52 (29)
This indicator obeys the popular maxim that: "THE TREND IS YOUR FRIEND" It paints a GREEN line for BUY and also paints a RED line for SELL. (you can change the colors). It gives alarms and alerts of all kinds. IT DOES NOT REPAINT and can be used for all currency pairs and timeframes. Yes, as easy and simple as that. Even a newbie can use it to make great and reliable trades. NB: For best results, get my other premium indicators for more powerful and reliable signals. Get them here: https://www.m
FREE
LT Donchian Channel
Thiago Duarte
4.83 (6)
Donchian Channel is an indicator created by Richard Donchian. It is formed by taking the highest high and the lowest low of the last specified period in candles. The area between high and low is the channel for the chosen period. Its configuration is simple. It is possible to have the average between the upper and lower lines, plus you have alerts when price hits one side. If you have any questions or find any bugs, please contact me. Enjoy!
FREE
Are you tired of drawing trendlines every time you're analyzing charts? Or perhaps you would like more consistency in your technical analysis. Then this is for you. This indicator will draw trend lines automatically when dropped on a chart. How it works Works similar to standard deviation channel found on mt4 and mt5. It has 2 parameters: 1. Starting Bar 2. Number of bars for calculation The   starting bar   is the bar which drawing of the trend lines will begin, while the   number of bars for c
FREE
Important Lines
Terence Gronowski
4.87 (23)
This indicator displays Pivot-Lines, preday high and low, preday close and the minimum and maximum of the previous hour. You just have to put this single indicator to the chart to have all these important lines, no need to setup many single indicators. Why certain lines are important Preday high and low : These are watched by traders who trade in a daily chart. Very often, if price climbs over or falls under a preday low/high there is an acceleration in buying/selling. It is a breakout out of a
FREE
MACD Enhanced
Nikita Berdnikov
Introducing the MACD  Enhanced – an advanced MACD (Moving Average Convergence Divergence) indicator that provides traders with extended capabilities for trend and momentum analysis in financial markets. The indicator uses the difference between the fast and slow exponential moving averages to determine momentum, direction, and strength of the trend, creating clear visual signals for potential entry and exit points. Attention! To achieve the best results, it is recommended to adapt the indicator
FREE
Free automatic Fibonacci is an indicator that automatically plots a Fibonacci retracement based on the number of bars you select on the BarsToScan setting in the indicator. The Fibonacci is automatically updated in real time as new highest and lowest values appears amongst the selected bars. You can select which level values to be displayed in the indicator settings. You can also select the color of the levels thus enabling the trader to be able to attach the indicator several times with differe
FREE
FlatBreakout MT5
Aleksei Vorontsov
FlatBreakout MT5 (Free Version) Flat Range Detector and Breakout Panel for MT5 — GBPUSD Only FlatBreakout MT5   is the free version of the professional FlatBreakoutPro MT5 indicator, specially designed for flat (range) detection and breakout signals on the   GBPUSD   pair only. Perfect for traders who want to experience the unique fractal logic of FlatBreakout MT5 and test breakout signals on a live market without limitations. Who Is This Product For? For traders who prefer to trade breakout of
FREE
High Low Open Close
Alexandre Borela
4.98 (41)
If you like this project, leave a 5 star review. This indicator draws the open, high, low and closing prices for the specified period and it can be adjusted for a specific timezone. These are important levels looked by many institutional and professional traders and can be useful for you to know the places where they might be more active. The available periods are: Previous Day. Previous Week. Previous Month. Previous Quarter. Previous year. Or: Current Day. Current Week. Current Month. Current
FREE
ZP Day Trading Indicator in MT5 The ZP Day Trading Indicator is one of the tools developed based on Price Action trading style concepts in MetaTrader 5. This indicator uses color-coded boxes to identify Trading Ranges on the chart. A trading range forms when the price moves within a specific range between a resistance level (ceiling) and a support level (floor) over a period of time. In such scenarios, buyers and sellers reach equilibrium within the defined range. «Indicator Installation & User
FREE
Friend of the Trend: Your Trend Tracker Master the market with Friend of the Trend , the indicator that simplifies trend analysis and helps you identify the best moments to buy, sell, or wait. With an intuitive and visually striking design, Friend of the Trend analyzes price movements and delivers signals through a colorful histogram: Green Bars : Signal an uptrend, indicating buying opportunities. Red Bars : Alert to a downtrend, suggesting potential selling points. Orange Bars : Represent cons
FREE
The Trend Catcher: The Trend Catcher Strategy with Alert Indicator is a versatile technical analysis tool that aids traders in identifying market trends and potential entry and exit points. It features a dynamic Trend Catcher Strategy , adapting to market conditions for a clear visual representation of trend direction. Traders can customize parameters to align with their preferences and risk tolerance. The indicator assists in trend identification, signals potential reversals, serves as a trail
FREE
Coral Indi
Dinh Duong Luong
Coral trend is   a trend-following indicator that is widely popular among FOREX traders . It is usually used as a confluence with other indicators. It uses combinations of moving averages with complex smoothing formulas! It has two configurable parameters: Coefficient   - smoothing ratio (*) Applied price Calculation: Coral = (-0.064) * B6 + 0.672 * B5 - 2.352 * B4 + 2.744 * B3
FREE
Cumulative Delta Indicator for MetaTrader 5 The Cumulative Delta Indicator is a dedicated volume analysis tool on MetaTrader 5 that monitors market buying and selling pressure. By comparing order flow data, it displays cumulative volume changes to help traders identify divergence signals. This MT5 indicator supports the detection of strong market trends, enhances liquidity analysis, and confirms price action behavior. «Indicator Installation & User Guide» MT5 Indicator Installation  |  Cumulativ
FREE
The indicator highlights the points that a professional trader sees in ordinary indicators. VisualVol visually displays different volatility indicators on a single scale and a common align. Highlights the excess of volume indicators in color. At the same time, Tick and Real Volume, Actual range, ATR, candle size and return (open-close difference) can be displayed. Thanks to VisualVol, you will see the market periods and the right time for different trading operations. This version is intended f
FREE
Easy Correlations Indicator The Easy Correlations Indicator is designed to help traders analyze the relationship between two correlated instruments. By monitoring the distance between their Relative Strength Index (RSI) values, the indicator highlights situations where one instrument has moved significantly further than the other. This creates potential trading opportunities: Sell the stronger instrument (overstretched RSI) Buy the weaker instrument (lagging RSI) Because the positions are opened
FREE
Statistical Arbitrage Spread Generator for Cointegration [MT5] What is Pair Trading? Pair trading is a market-neutral strategy that looks to exploit the relative price movement between two correlated assets — instead of betting on the direction of the market. The idea? When two assets that usually move together diverge beyond a statistically significant threshold, one is likely mispriced. You sell the expensive one, buy the cheap one , and profit when they converge again. It’s a statistica
FREE
PZ Penta O MT5
PZ TRADING SLU
3.5 (4)
The Penta-O is a 6-point retracement harmonacci pattern which usually precedes big market movements. Penta-O patterns can expand and repaint quite a bit. To make things easier this indicator implements a twist: it waits for a donchian breakout in the right direction before signaling the trade. The end result is an otherwise repainting indicator with a very reliable trading signal. The donchian breakout period is entered as an input. [ Installation Guide | Update Guide | Troubleshooting | FAQ | A
FREE
RSI abcd
Francisco Gomes Da Silva
3 (1)
RSI ABCD Pattern Finder: Technical Strategy 1. How the Indicator Works Combines the classic RSI with automatic detection of ABCD harmonic patterns . Key Components Standard RSI (adjustable period) Peak and Trough Markers (arrows) ABCD Patterns (green/red lines) Overbought (70) and Oversold (30) Filters 2. MT5 Setup period = 14 ; // RSI period size = 4 ; // Maximum pattern size OverBought = 70 ; // Overbought level OverSold = 30 ; // Oversold level Filter = USE_FILTER_ YES ; // Confirmation filte
FREE
Rainbow MT5
Jamal El Alama
4 (1)
Description : Rainbow MT5 is a technical indicator based on Moving Average with period 34 and very easy to use. When price crosses above MA and MA changes color to green, then this is a signal to buy. When price crosses below MA and MA changes color to red, then this is a signal to sell. The Expert advisor ( Rainbow EA MT5 ) based on Rainbow MT5 indicator is now available here . MT4 version is available here .
FREE
Mitimom
Danil Poletavkin
The indicator is based on Robert Miner's methodology described in his book "High probability trading strategies" and displays signals along with momentum of 2 timeframes. A Stochastic oscillator is used as a momentum indicator. The settings speak for themselves period_1 is the current timeframe, 'current' period_2 is indicated - the senior timeframe is 4 or 5 times larger than the current one. For example, if the current one is 5 minutes, then the older one will be 20 minutes The rest of the s
FREE
Haven FVG Indicator
Maksim Tarutin
5 (4)
The   Haven FVG   indicator is a market analysis tool that highlights inefficiency areas (Fair Value Gaps, FVG) on the chart, providing traders with key levels for price analysis and decision-making. Other products ->  HERE Main Features: Customizable color settings: Color for Bullish FVG   (Bullish FVG Color). Color for Bearish FVG   (Bearish FVG Color). Flexible FVG visualization: Maximum number of candles for FVG detection. Additional extension of FVG zones by a specified number of bars. Opt
FREE
Weis Waves
Flavio Javier Jarabeck
2.83 (18)
The original author is David Weis, an expert in the Wyckoff Method. The Weis Wave is a modern adaptation of the 1930's Wyckoff Method, another expert in Tape Reading techniques and Chart Analysis. Weis Waves takes market volume and stacks it into waves according to price conditions giving the trader valuable insights about the market conditions. If you want to learn more about this subject you can find tons of videos in YouTube. Just look for "The Wickoff Method", "Weis Wave" and "Volume Spread
FREE
Value Chart Candlesticks
Flavio Javier Jarabeck
4.69 (13)
The idea of a Value Chart indicator was presented in the very good book I read back in 2020 , " Dynamic Trading Indicators: Winning with Value Charts and Price Action Profile ", from the authors Mark Helweg and David Stendahl. The idea is simple and the result is pure genius: Present candlestick Price analysis in a detrended way! HOW TO READ THIS INDICATOR Look for Overbought and Oversold levels. Of course, you will need to test the settings a lot to find the "correct" one for your approach. It
FREE
Tabajara V5
Flavio Javier Jarabeck
4.83 (35)
Metatrader 5 version of the famous Andre Machado's Tabajara indicator. If you don't know Andre Machado's Technical Analysis work you don't need this indicator... For those who need it and for those several friend traders who asked this porting from other platforms, here it is... FEATURES 8-period Moving Average 20-period Moving Average 50-period Moving Average 200-period Moving Average Colored candles according to the inflexion of the 20-period MA SETTINGS You can change the Period of all MA's
FREE
Donchian Pro
Paulo Henrique Faquineli Garcia
5 (3)
The Donchian Channel Channels are among the most popular tools of technical analysis, as they visually convey to the analyst the limits within which most price movement tends to occur. Channel users know that valuable information can be obtained at any time, whether prices are in the central region of a band or close to one of the border lines. One of the best known techniques to explore these concepts is Bollinger Bands. However, John Bollinger was not the only one to research the application
FREE
Reversal Composite Candles
MetaQuotes Ltd.
3.69 (16)
The idea of the system is to indentify the reversal patterns using the calculation of the composite candle. The reversal patterns is similar to the "Hammer" and "Hanging Man" patterns in Japanese candlestick analysis. But it uses the composite candle instead the single candle and doesn't need the small body of the composite candle to confirm the reversal. Input parameters: Range - maximal number of bars, used in the calculation of the composite candle. Minimum - minimal size of the composite can
FREE
The   "Haven Key Levels PDH PDL"   indicator helps traders visualize key levels on the chart. It automatically marks the following levels: DO (Daily Open)   — the daily open level. NYM (New York Midnight)   — the New York midnight level. PDH (Previous Day High)   — the previous day's high. PDL (Previous Day Low)   — the previous day's low. WO (Weekly Open)   — the weekly open level. MO (Monthly Open)   — the monthly open level. PWH (Previous Week High)   — the previous week's high. PWL (Previou
FREE
Pivot Point Fibo RSJ is an indicator that traces the support and resistance lines of the day using Fibonacci rates. This spectacular indicator creates up to 7 levels of support and resistance through Pivot Point using Fibonacci rates. It is fantastic how the prices respect each level of this support and resistance, where it is possible to perceive possible entry/exit points of an operation. Features Up to 7 levels of support and 7 levels of resistance Set the colors of the levels individually
FREE
Enhance your trading analysis with the Haiken Ashi MT5 indicator. This powerful tool transforms standard price data into smoother, trend-following candlesticks, making it easier to identify market trends and potential reversal points.    Key Features: Clear Trend Identification: Visually distinguish between uptrends and downtrends with distinct candle colors. Reduced Noise: Filter out price fluctuations, providing a clearer view of underlying market movements. Early Trend Detection: Anticipate
FREE
Ratio Indicator
Rafael Gazzinelli
5 (1)
Ratio Indicator - User Guide Special Deal! Leave a review and get the indicator  Long & Short Cointegration Analyzer for free — just send me a message! This Ratio indicator between assets allows you to monitor and trade the price relationship between two assets selected by the user. It calculates the ratio between the prices of two assets, referred to as Asset1 and Asset2 (e.g., "GBPUSD" and "EURUSD"), and plots a moving average of the ratio along with Bollinger Bands . These bands are used to
FREE
Buyers of this product also purchase
Divergence Bomber
Ihor Otkydach
4.98 (60)
Each buyer of this indicator also receives the following for free: The custom utility "Bomber Utility", which automatically manages every trade, sets Stop Loss and Take Profit levels, and closes trades according to the rules of this strategy Set files for configuring the indicator for various assets Set files for configuring Bomber Utility in the following modes: "Minimum Risk", "Balanced Risk", and "Wait-and-See Strategy" A step-by-step video manual to help you quickly install, configure, and s
ARIPoint
Temirlan Kdyrkhan
ARIBot is a powerful trading companion designed to generate high-probability entry signals with dynamic TP/SL/DP levels based on volatility. Built-in performance tracking shows win/loss stats, PP1/PP2 hits, and success rates — all updated live. Key Features: Buy/Sell signals with adaptive volatility bands Real-time TP/SL/DP levels based on ATR Built-in MA Filter with optional ATR/StdDev volatility Performance stats panel (Success, Profit/Loss, PP1/PP2) Alerts via popup, sound, push, or email Cus
AriX
Temirlan Kdyrkhan
1 (1)
AriX Indicator for MT5 A powerful trend-following and signal-evaluation tool AriX is a custom MT5 indicator that combines Moving Averages and ATR-based risk/reward logic to generate clear buy/sell signals. It visualizes dynamic SL/TP levels, evaluates past trade outcomes, and displays win/loss statistics in a clean on-chart panel. Key features include: Buy/Sell signals based on MA crossovers ATR-based SL/TP1/TP2/TP3 levels with visual lines and labels Signal outcome tracking with real-time stat
Trend Screener Pro MT5
STE S.S.COMPANY
4.87 (90)
Unlock the Power of Trends Trading with the Trend Screener Indicator: Your Ultimate Trend Trading Solution powered by Fuzzy Logic and Multi-Currencies System! Elevate your trading game with the Trend Screener, the revolutionary trend indicator designed to transform your Metatrader into a powerful Trend Analyzer. This comprehensive tool leverages fuzzy logic and integrates over 13 premium features and three trading strategies, offering unmatched precision and versatility. LIMITED TIME OFFER : Tre
Gold Stuff mt5
Vasiliy Strukov
4.92 (189)
Gold Stuff mt5 is a trend indicator designed specifically for gold and can also be used on any financial instrument. The indicator does not redraw and does not lag. Recommended time frame H1. Contact me immediately after the purchase to get   personal bonus!  You can get a free copy of our Strong Support and Trend Scanner indicator, please pm. me! Settings  and manual   here  Please note that I do not sell my EA's or special sets on telegram, it is only available on Mql5 and my set files are on
Grabber System MT5
Ihor Otkydach
5 (15)
Let me introduce you to an excellent technical indicator – Grabber, which works as a ready-to-use "All-Inclusive" trading strategy. Within a single code, it integrates powerful tools for technical market analysis, trading signals (arrows), alert functions, and push notifications. Every buyer of this indicator also receives the following for free: Grabber Utility for automatic management of open orders Step-by-step video guide: how to install, configure, and trade with the indicator Custom set fi
Trend indicator AI mt5
Ramil Minniakhmetov
5 (7)
Trend Ai indicator  mt5 is great tool that will enhance a trader’s market analysis by combining trend identification with actionable entry points and reversal alerts.  This indicator empowers users to navigate the complexities of the forex market with confidence and precision Beyond the primary signals, Trend Ai indicator identifies secondary entry points that arise during pullbacks or retracements, enabling traders to capitalize on price corrections within the established trend. Important Advan
Quantum TrendPulse
Bogdan Ion Puscasu
5 (13)
Introducing Quantum TrendPulse , the ultimate trading tool that combines the power of SuperTrend , RSI , and Stochastic into one comprehensive indicator to maximize your trading potential. Designed for traders who seek precision and efficiency, this indicator helps you identify market trends, momentum shifts, and optimal entry and exit points with confidence. Key Features: SuperTrend Integration: Easily follow the prevailing market trend and ride the wave of profitability. RSI Precision: Detect
***  Entry In The Zone and SMC Multi Timeframe is a real-time market analysis tool developed based on the Smart Money Concepts (SMC) framework. It automatically analyzes reversal points and key zones across multiple timeframes, with a focus on providing no repaint signals and highlighting Points of Interest (POI). Additionally It also features an Auto Fibonacci Level System that automatically draws Fibonacci lines to help detect pullback and reversal points instantly. Most importantly, the sign
Algo Pumping
Ihor Otkydach
4.74 (19)
PUMPING STATION – Your Personal All-inclusive strategy Introducing PUMPING STATION — a revolutionary Forex indicator that will transform your trading into an exciting and effective activity! This indicator is not just an assistant but a full-fledged trading system with powerful algorithms that will help you start trading more stable! When you purchase this product, you also get FOR FREE: Exclusive Set Files: For automatic setup and maximum performance. Step-by-step video manual: Learn how to tr
Support And Resistance Screener Breakthrough unique Solution With All Important levels analyzer and Markets Structures Feature Built Inside One Tool ! Our indicator has been developed by traders for traders and with one Indicator you will find all Imporant market levels with one click. LIMITED TIME OFFER : Support and Resistance Screener Indicator is available for only 50 $ and lifetime. ( Original price 125$ ) (offer extended) The available tools ( Features ) in our Indicator are :  1. HH-LL S
Introducing   Quantum Breakout PRO , the groundbreaking MQL5 Indicator that's transforming the way you trade Breakout Zones! Developed by a team of experienced traders with trading experience of over 13 years,   Quantum Breakout PRO   is designed to propel your trading journey to new heights with its innovative and dynamic breakout zone strategy. Quantum Breakout Indicator will give you signal arrows on breakout zones with 5 profit target zones and stop loss suggestion based on the breakout b
This indicator identifies and displays zones, as it were areas of strength, where the price will unfold. The indicator can work on any chart, any instrument, at any timeframe. The indicator has two modes. The indicator is equipped with a control panel with buttons for convenience and split into two modes. Manual mode: To work with manual mode, you need to press the NEW button, a segment will appear. This segment is stretched over the movement and the LVL button is pressed. The level is displayed
Matrix Arrow Indicator MT5
Juvenille Emperor Limited
5 (14)
Matrix Arrow Indicator MT5  is a unique 10 in 1 trend following   100% non-repainting  multi-timeframe indicator that can be used on all symbols/instruments:   forex,   commodities,   cryptocurrencies,   indices,   stocks .  Matrix Arrow Indicator MT5  will determine the current trend at its early stages, gathering information and data from up to 10 standard indicators, which are: Average Directional Movement Index (ADX) Commodity Channel Index (CCI) Classic Heiken Ashi candles Moving Average
FX Power MT5 NG
Daniel Stein
5 (17)
FX Power: Analyze Currency Strength for Smarter Trading Decisions Overview FX Power is your go-to tool for understanding the real strength of currencies and Gold in any market condition. By identifying strong currencies to buy and weak ones to sell, FX Power simplifies trading decisions and uncovers high-probability opportunities. Whether you’re looking to follow trends or anticipate reversals using extreme delta values, this tool adapts seamlessly to your trading style. Don’t just trade—trade
Advanced Supply Demand MT5
Bernhard Schweigert
4.5 (14)
Best Solution for any Newbie or Expert Trader! This indicator is a unique, high quality and affordable trading tool because we have incorporated a number of proprietary features and a new formula. With this update, you will be able to show double timeframe zones. You will not only be able to show a higher TF but to show both, the chart TF, PLUS the higher TF: SHOWING NESTED ZONES. All Supply Demand traders will love it. :) Important Information Revealed Maximize the potential of Advanced Supply
Owl Smart Levels MT5
Sergey Ermolov
4 (29)
MT4 version  |   FAQ The Owl Smart Levels Indicator is a complete trading system within the one indicator that includes such popular market analysis tools as Bill Williams' advanced fractals , Valable ZigZag which builds the correct wave structure of the market, and Fibonacci levels which mark the exact levels of entry into the market and places to take profits. Detailed description of the strategy Instructions for working with the indicator Advisor-assistant in trading Owl Helper Private User
PZ Swing Trading MT5
PZ TRADING SLU
5 (5)
Protect against whipsaws: revolutionize your swing trading approach Swing Trading is the first indicator designed to detect swings in the direction of the trend and possible reversal swings. It uses the baseline swing trading approach, widely described in trading literature. The indicator studies several price and time vectors to track the aggregate trend direction and detects situations in which the market is oversold or overbought and ready to correct. [ Installation Guide | Update Guide | Tro
Gold Entry Sniper – Professional Multi-Timeframe ATR Dashboard for Gold Scalping & Swing Trading Gold Entry Sniper is a cutting-edge MetaTrader 5 indicator designed to give traders precise buy/sell signals for XAUUSD and other symbols, powered by ATR Trailing Stop logic and a multi-timeframe analysis dashboard . Built for both scalpers and swing traders, it combines real-time market direction , dynamic stop levels , and professional visual dashboards to help you identify high-probability gold en
FX Levels MT5
Daniel Stein
5 (7)
FX Levels: Exceptionally Accurate Support & Resistance for All Markets Quick Overview Looking for a reliable way to pinpoint support and resistance levels across any market—currencies, indices, stocks, or commodities? FX Levels merges our traditional “Lighthouse” method with a forward-thinking dynamic approach, offering near-universal accuracy. By drawing from real-world broker experience and automated daily plus real-time updates, FX Levels helps you identify reversal points, set profit targe
FX Volume MT5
Daniel Stein
4.84 (19)
FX Volume: Experience Genuine Market Sentiment from a Broker’s Perspective Quick Overview Looking to elevate your trading approach? FX Volume provides real-time insights into how retail traders and brokers are positioned—long before delayed reports like the COT. Whether you’re aiming for consistent gains or simply want a deeper edge in the markets, FX Volume helps you spot major imbalances, confirm breakouts, and refine your risk management. Get started now and see how genuine volume data can
Atbot
Zaha Feiz
4.71 (45)
ATbot : How It Works and How to Use It How It Works The "AtBot" indicator for the MT5 platform generates buy and sell signals using a combination of technical analysis tools. It integrates Simple Moving Average (SMA), Exponential Moving Average (EMA), and the Average True Range (ATR) index to identify trading opportunities. Additionally, it can utilize Heikin Ashi candles to enhance signal accuracy. MQL Channel    Leave a massage after purchase and receive a special bonus gift. Key Features: ⦁
Dark Absolute Trend MT5
Marco Solito
4.64 (11)
Dark Absolute Trend   is an Indicator for intraday trading. This Indicator is based on   Trend Following  strategy but use also candlestick patterns and Volatility. We can enter in good price with this Indicator, in order to follow the main trend on the current instrument. It is advised to use low spread ECN brokers. This Indicator does   Not repaint   and   N ot lag . Recommended timeframes are M5, M15 and H1. Recommended working pairs: All. I nstallation and  Update Guide   -  Troubleshooting
How many times have you bought a trading indicator with great back-tests, live account performance proof with fantastic numbers and stats all over the place but after using it, you end up blowing your account? You shouldn't trust a signal by itself, you need to know why it appeared in the first place, and that's what RelicusRoad Pro does best! User Manual + Strategies + Training Videos + Private Group with VIP Access + Mobile Version Available A New Way To Look At The Market RelicusRoad is the
Gartley Hunter Multi
Siarhei Vashchylka
5 (11)
Gartley Hunter Multi - An indicator for searching for harmonic patterns simultaneously on dozens of trading instruments and on all possible timeframes. Manual (Be sure to read before purchasing) | Version for MT4 Advantages 1. Patterns: Gartley, Butterfly, Shark, Crab. Bat, Alternate Bat, Deep Crab, Cypher 2. Simultaneous search for patterns on dozens of trading instruments and on all possible timeframes 3. Search for patterns of all possible sizes. From the smallest to the largest 4. All fou
Trend Forecaster
Alexey Minkov
5 (7)
The Trend Forecaster indicator utilizes a unique proprietary algorithm to determine entry points for a breakout trading strategy. The indicator identifies price clusters, analyzes price movement near levels, and provides a signal when the price breaks through a level. The Trend Forecaster indicator is suitable for all financial assets, including currencies (Forex), metals, stocks, indices, and cryptocurrencies. You can also adjust the indicator to work on any time frames, although it is recommen
TPSproTREND PrO MT5
Roman Podpora
4.64 (14)
Entry points at the bar close,  without redrawing .  Trend scanner  across all assets,  MTF - mode  and much more in one tool. We recommend using it together with   RFI LEVELS. ИНСТРУКЦИЯ RUS   /   INSTRUCTIONS  ENG         /         VERSION MT4   Main functions: Accurate entry signals WITHOUT REPAINTING! Once a signal appears, it remains valid! This is a significant distinction from repainting indicators that might provide a signal and then alter it, potentially leading to deposit losses. Now,
IQ Gold Gann Levels a non-repainting, precision tool designed exclusively for XAUUSD/Gold intraday trading. It uses W.D. Gann’s square root method to plot real-time support and resistance levels, helping traders spot high-probability entries with confidence and clarity. William Delbert Gann (W.D. Gann) was an exceptional market analyst, whose trading technique was based on a complex blend of mathematics, geometry, astrology, and ancient mathematics which proved to be extremely accurate. Download
Trend Sensor MT5
Yuriy Lyachshenko
The indicator shows the most appropriate entry and exit points. It also displays statistical data on all signals for better analysis of trading. With the help of this indicator you will be able to better understand the market. As soon as the power of the trend begins to weaken (this will be shown on the panel), the trend line will gravitate to the horizontal position - this is the signal to exit the trade. Or you can exit when the average/median profit level is reached. The indicator was the r
Order Block Hunter MT5
Noha Mohamed Fathy Younes Badr
5 (2)
Order block hunter indicator is the best indicator for  hunt the order blocks that area where there has been a large concentration of limit orders waiting to be executed Order blocks are identified on a chart by observing previous price action and looking for areas where the price experienced significant movement or sudden changes in direction .This indicator does that for you by using very complicated codes and helps you to take the best areas To buy and sell because it make marks at the best a
More from author
Smart Volume Profile is a professional volume profile indicator that calculates and displays in real time the distribution of volumes between two vertical lines, with buy/sell split and POC, VAH, VAL levels. Designed for both discretionary and systematic trading, it allows you to see where the market traded the most and how buying and selling pressure was distributed within the selected period. Why this indicator Full control of the analysis period thanks to two draggable VLINEs that define the
FREE
SMA ReEntry
Mattia Impicciatore
What is SMA Reentry SMA Reentry is a professional indicator that signals reentry points in the direction of the trend using two simple moving averages (SMA): one fast and one slow. The indicator clearly shows when the price re-enters above or below the fast moving average, in the presence of a trend defined by the slow SMA. It is the ideal tool for those seeking clear pullback, breakout, and trend reentry signals. How It Works Identifies the main trend through the crossover of the fast and slow
FREE
This indicator computes price reentry moments after a candle has pierced outside the Bollinger Bands , combining that signal with an RSI confirmation to reduce false positives. A Buy ReEntry signal is detected when price had moved below the lower band and then returns inside, with the optional confirmation that the RSI has just exited an oversold condition. A Sell ReEntry signal is generated when price had moved above the upper band and then reenters, with the optional confirmation that the RSI
FREE
General Description Clear indicators and simple rules to read the three key phases of the market. This indicator identifies in real time an accumulation phase based on the Asian session, detects any liquidity sweeps during the manipulation phase, and confirms the directional phase during distribution. It displays green arrows for the bullish phase and red arrows for the bearish phase, draws the Asia box with customizable color and border, and optionally shows the daily open line for quick intra
FREE
Overview This indicator monitors three types of support and resistance levels derived from previous periods: Daily (yesterday’s high and low), Weekly (last week), and Monthly (last month). It visually maps key price levels where reactions are more likely, making it valuable for identifying potential reversals as well as significant breakouts . Features Automatically draws: High/Low of yesterday (Daily) High/Low of the previous week (Weekly) High/Low of the previous month (Monthly) Each level has
FREE
False Breakout Detector is an indicator designed to identify situations where the price temporarily breaks a recent support or resistance level but quickly returns to the previous range. These false breakouts can be useful for discretionary analysis or contrarian trading strategies. Main Features: Automatic detection of false breakouts on recent highs and lows Clear visual representation using arrows, lines, and background highlights Customizable notifications via popup and push alerts User-def
FREE
Description (MT4) This indicator detects price reentry moments after a candle has pierced outside the Bollinger Bands, combining that signal with an optional RSI confirmation to reduce false positives. A Buy ReEntry signal is generated when price has moved below the lower band and then returns inside, optionally confirmed by the RSI just exiting an oversold condition. A Sell ReEntry signal is generated when price has moved above the upper band and then reenters, optionally confirmed by the RSI
FREE
Opening range
Mattia Impicciatore
Opening‑Range Sessions (GMT‑Aware) is a lightweight indicator that automatically draws the opening range — high, low, and a color‑filled box — for the main FX liquidity windows: Sydney, Tokyo, London and New York . The indicator detects your broker‑server time‑zone on the fly, so every session starts at the correct local moment, no matter where the server (or the trader) is located. Key features Automatic Time‑Zone Detection – Uses the server’s GMT offset; no manual time adjustment required when
FREE
False Breakout MT4
Mattia Impicciatore
False Breakout MT4 is an indicator designed to spot cases where price briefly breaks a recent support or resistance level and then quickly returns to the prior range. These false breakouts are valuable for discretionary analysis or contrarian trading approaches, providing visual cues without making predictive or automatic decisions. Main Features: Automatic detection of false breakouts around recent highs and lows (e.g., extended daily levels over two days). Clear visual representation with arro
FREE
Description Market Phase Analyzer is an advanced indicator designed to identify the three main market phases: Accumulation , Manipulation , and Distribution . Through automatic session analysis, the indicator draws the Asia Box , detects sweep moves above or below key levels, and confirms reversals with the ATR filter to reduce false signals. Main Features Highlights the Asian session range with a customizable box. Automatic detection of bullish or bearish sweeps. Optional ATR filter for signal
FREE
Advanced Economic Calendar Indicator This indicator displays all upcoming economic events directly on the chart, highlighting relevant news for the selected pair or instrument. It allows traders to anticipate high-volatility moments and plan their strategies with accuracy. Main Features Display of future events up to 5 days ahead (customizable). Filtering by news impact level (high, medium, low). Option to show vertical event lines and numbered markers for quick identification. Fully customizabl
FREE
Description: NR4 & NR7 Inside Bar Highlighter is an indicator that automatically detects price compression patterns based on a combination of NR4 or NR7 with an Inside Bar. The NR4 (Narrow Range 4) pattern identifies the candle with the smallest range among the last 4 bars, while NR7 considers the last 7. When this narrow-range condition occurs alongside an Inside Bar (a candle completely contained within the previous one), it often signals a low-volatility phase that may precede a strong breako
FREE
SR PrevPeriods MT4 Overview SR PrevPeriods automatically plots the previous day’s, previous week’s, and previous month’s high and low directly on your MetaTrader 4 chart in real time. It’s a lightweight indicator designed to highlight historical support and resistance zones, which often align with price reaction areas, breakouts, and rebalancing points. What it does It draws horizontal lines at key previous levels and, if desired, text labels showing the exact value. The lines update automatic
FREE
SMA ReEntry MT4
Mattia Impicciatore
Description SMA Reentry is an indicator for MetaTrader 4 designed to identify reentry points within the main trend. It uses two Simple Moving Averages: a fast one to capture short-term movements and a slow one to filter the overall market direction. A buy signal occurs when the fast SMA is above the slow SMA and the price moves back above the fast SMA after being below it on the previous candle. A sell signal occurs when the fast SMA is below the slow SMA and the price moves back below it after
FREE
Fair Value Gap Zone
Mattia Impicciatore
General Description The Fair Gap Value Indicator identifies and highlights “fair value gaps” on the MetaTrader 5 chart. A fair gap occurs when a price void forms between the low of one bar and the high of another, separated by an intermediate bar. The indicator draws colored rectangles (bullish and bearish) to emphasize these areas, providing clear visual support for price-action strategies. Key Features Bullish Gap Detection : highlights gaps between a bar’s low and the high of two bars prior w
FREE
Candlestick Pattern Analyzer for MT4 Description Candlestick Pattern Analyzer is an advanced tool for both discretionary and systematic traders, built to automatically detect major Japanese candlestick patterns and deliver a detailed statistical breakdown of their historical performance. This indicator is perfect for those who want to objectively verify the real-world effectiveness of patterns and combine them with confirmation filters (e.g., trend, key levels, volume) and a well-defined risk m
General Description This indicator calculates in real time the Pearson correlation coefficient between multiple financial instruments. It displays a dynamic correlation matrix that shows the strength and direction of relationships among currencies, indices, stocks, and commodities. Main Parameters SymbolsList : list of instruments to compare (comma separated) BarsToAnalyze : number of historical bars used for calculation TimeFrame : timeframe for correlation analysis Correlation Interpretation
FREE
ATR Volatility Histogram for MT5 – Technical Volatility Analysis This indicator calculates and displays the difference between a fast ATR and a slow ATR as a histogram, allowing you to visualize changes in market volatility in real time. Calculation Volatility Difference = Fast ATR - Slow ATR Interpretation Positive values (green bars) indicate rising volatility and can confirm breakout momentum. Negative values (red bars) indicate falling volatility, potential consolidation, or loss of moment
FREE
Body Ratio Indicator for MT5 – Candle Strength and Compression Analyzer The Body Ratio Indicator is a technical tool for analyzing candlestick structure and identifying market conditions based on the ratio between the candle’s body (open-close) and its total range (high-low). This simple yet powerful calculation helps traders detect strong momentum candles, indecision candles, and range compression phases, which often precede major breakouts. Each candlestick is categorized in real time: Weak c
FREE
Simple Range Filter
Mattia Impicciatore
Simple Range Filter is an indicator designed to highlight candles with high or low volatility . It calculates the average range (High - Low) over a defined number of candles and dynamically adjusts the thresholds based on market conditions. Main Features: Dynamic calculation of average range Visual highlighting of bars with above or below-average range Configurable parameters for colors and calculation period Real-time updates (tick-by-tick) Use Cases: Helps identify periods of low volatility (
FREE
Description Spread History is a simple yet essential indicator that displays the historical spread, candle by candle, in a separate window alongside its moving average. With a real‑time line and overlaid text on the main chart, you can easily monitor the spread applied by your broker at every market phase. Purpose Show the actual spread provided by the broker for each candle Calculate and display the spread’s moving average over a configurable period Overlay the current spread value and its av
FREE
Description: NR4 & NR7 Inside Bar Highlighter for MetaTrader 4 is an indicator that automatically detects price compression patterns based on the combination of NR4 or NR7 with an Inside Bar . How it works: The NR4 (Narrow Range 4) pattern identifies the candle with the smallest range among the last 4 bars, while NR7 considers the last 7. When this narrow-range condition occurs alongside an Inside Bar (a candle completely contained within the previous one), it often signals a low-volatility ph
FREE
Short Description: A powerful tool to measure trend efficiency and filter market noise. Toggle between a sleek line chart or a color-coded histogram with threshold alerts. Key Features: Dual Plot Styles: Line (RSI-like) or colored histogram (Trend/Neutral/Range). Configurable Thresholds: Set your own upper (trend) and lower (range) levels. Multi-Mode Visualization: Clear visual cues—green for strong trends, gray for consolidation, red for ranging markets. Flexible Period: Adjustable calculation
FREE
Description Volatility ATR Crossover Histogram is an indicator for MetaTrader 4 that measures the expansion and contraction of volatility by comparing a fast ATR with a slow ATR. The result is displayed in a colored histogram in a separate window. Green bars indicate an increasing volatility phase, while red bars indicate decreasing volatility. It is designed as a universal filter for entry timing, trade management, and market regime detection. How it works The indicator calculates two ATRs w
FREE
Overview Performance Indicator shows a heatmap of percentage returns for a list of symbols over configurable time intervals. It is used to visually compare relative strength and weakness , without giving any guarantee of results. Configuration SymbolsList: comma-separated symbols; must match exactly the names in the terminal. BaseTF: base timeframe for calculations. UpdateSeconds: interval in seconds for automatic refresh. CapPercent: normalization value for color intensity. PeriodsList: stri
FREE
What is Bias Finder The Bias Finder (with Export) is an advanced indicator designed to detect and analyze market statistical biases, providing a clear visualization of recurring tendencies. This tool is especially useful for both discretionary and systematic traders who want to integrate quantitative analysis into their trading strategies. Analysis Modes The indicator calculates and displays price bias according to different time logics: Hourly Bias : statistical analysis hour by hour. Weekday B
Bias Seasonal Pattern Analyzer for MT5 – Real-Time Seasonal Bias Analysis Bias Finder is an advanced tool for seasonal market analysis, designed to clearly display average profits generated during different time-based segments: Hourly Bias – shows the most profitable hours of the day Weekday Bias – reveals the best-performing day of the week for each symbol Day‑of‑Month Bias – analyzes behavior at the start and end of each month Monthly Bias – ideal for long-term seasonal or monthly trend analy
Description Candlestick Pattern Analyzer is an advanced tool for both discretionary and systematic traders, designed to automatically identify major Japanese candlestick patterns and deliver a detailed statistical analysis of their historical performance. This indicator is perfect for those who want to verify the real-world effectiveness of patterns and use them alongside confirmation filters (e.g., trend, key levels, volume) and a well‑defined risk‑management strategy. Key Features Automatic
Filter:
No reviews
Reply to review