Easy Correlations Indicator
- Indicators
-
Ioannis Xenos
 Hi! My name is Ioannis Xenos. As a Professional MQL Developer with over 12 years of experience in the IT industry, I have a strong track record of success in developing and implementing software solutions for financial services companies, including whenfx.com, ditto.trade, FXTRADING.com and two
 - Version: 1.0
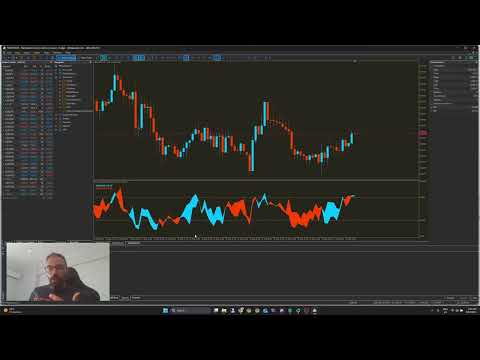
Easy Correlations Indicator
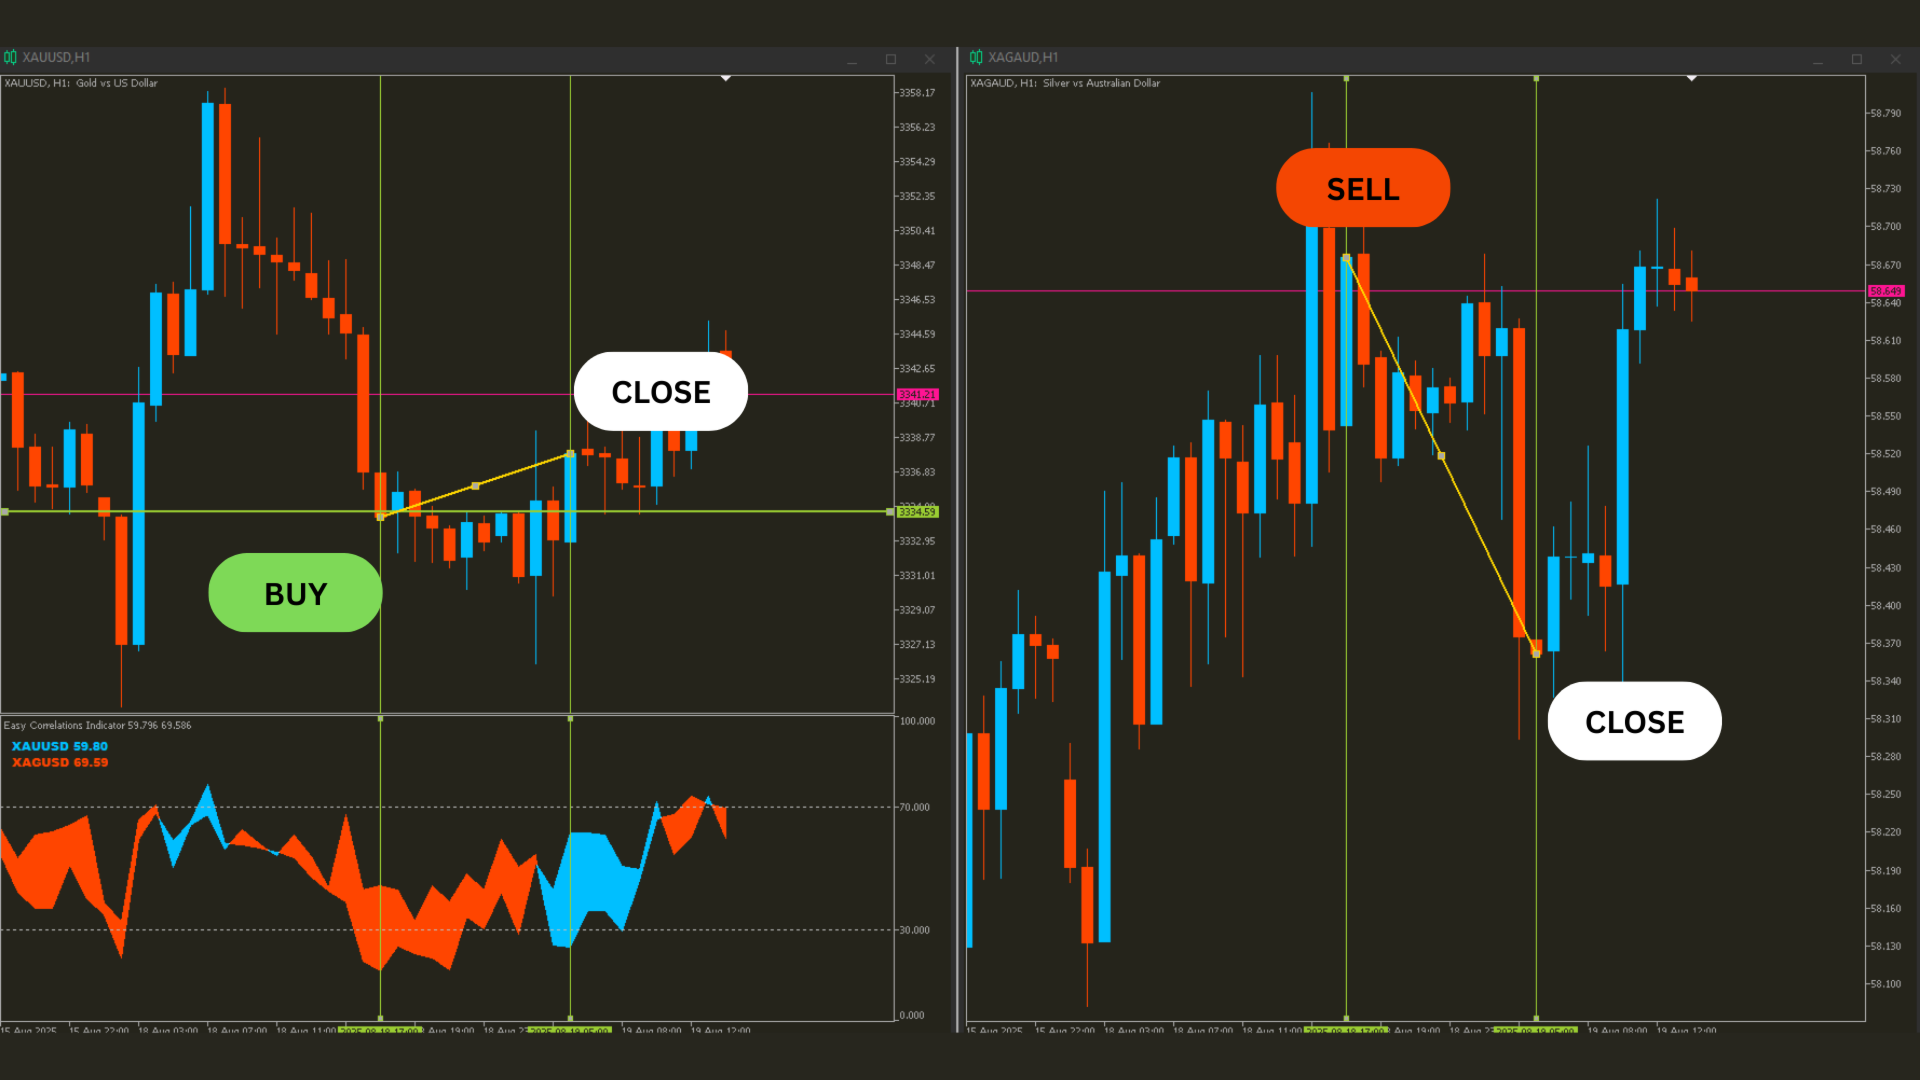
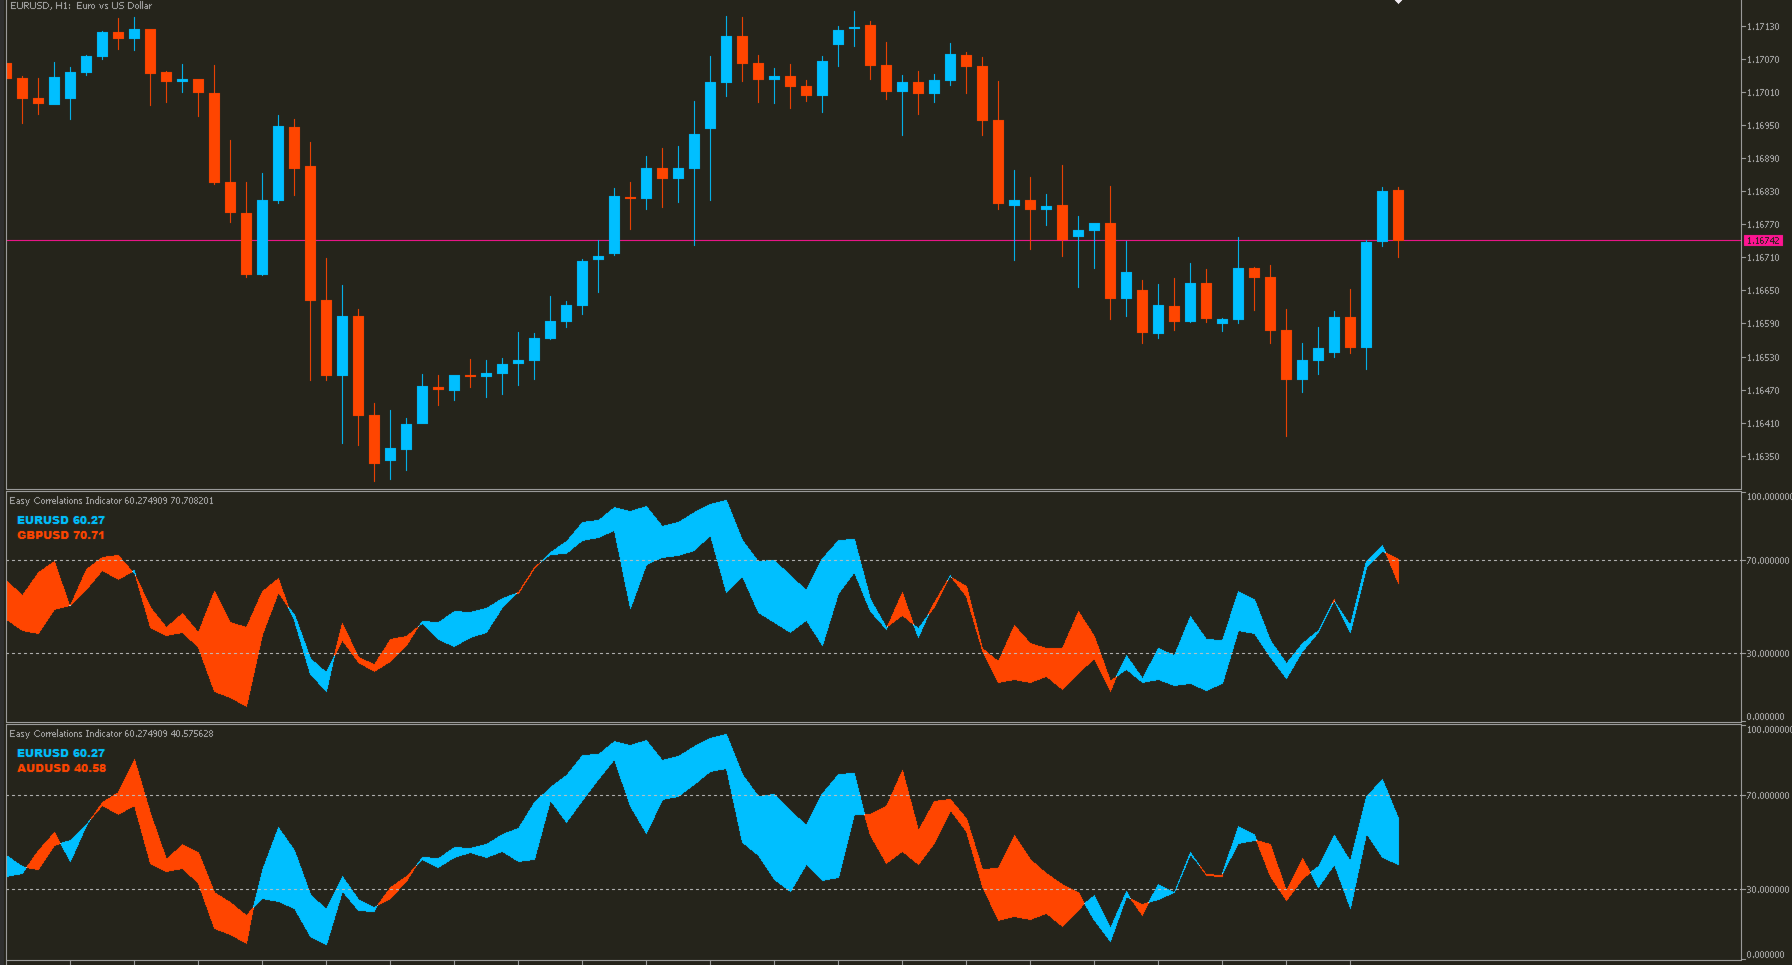
The Easy Correlations Indicator is designed to help traders analyze the relationship between two correlated instruments. By monitoring the distance between their Relative Strength Index (RSI) values, the indicator highlights situations where one instrument has moved significantly further than the other.
This creates potential trading opportunities:
-
Sell the stronger instrument (overstretched RSI)
-
Buy the weaker instrument (lagging RSI)
Because the positions are opened on two correlated instruments, the strategy naturally reduces directional risk by maintaining a hedged position. At the same time, it provides an edge by capturing profits when the instruments tend to return to their typical correlation range.
The Easy Correlations Indicator is particularly effective in markets where pairs of instruments (currencies, commodities, indices, or stocks) usually move together, but occasionally diverge enough to create profitable setups.
👉 You can automate this logic by using our Easy Correlations EA [https://www.mql5.com/en/market/product/108631].
Ioannis Xenos
xignalcoding.com
Trading financial markets involves risk and may not be suitable for all investors. The Easy Correlations Indicator and Easy Correlations EA are trading tools designed to assist with market analysis and strategy execution. They do not guarantee profits or eliminate risk. Past performance is not indicative of future results. Always test on a demo account before trading with real money, and use proper risk management.

Good indicator.