
BKT Pro Tooco SR
- Indicators
-
Khac Thanh Bui
 Turning trading logic into algorithmic precision. I develop professional-grade tools for FX and Gold, bridging the gap between practical trading needs and high-end software development.
WHAT I BUILD: - Version: 1.11
- Updated: 11 May 2026
BKT Pro Tooco
A multi-method support and resistance toolkit for MetaTrader 5 that detects swing levels in real time using four selectable detection algorithms, without repainting confirmed signals.
BKT Pro Tooco is a support and resistance indicator for MetaTrader 5, built to serve traders who require reliable zone detection across multiple market structures. The indicator offers four independent detection methods, allowing traders to match the algorithm to their preferred trading style, whether that is pivot-based structural analysis, Donchian channel reversals, consecutive candle sequences, or ZigZag swing identification. All confirmed zones are drawn from closed bars and do not repaint.
Overview
The indicator scans historical price action and the current bar to locate significant swing highs and swing lows. When a swing point is identified, a corresponding support or resistance zone is constructed using an ATR-based depth calculation. The zone width is determined by two parameters: one for the zone body and one for a configurable breakout buffer, giving traders control over how sensitive the zones are to brief price excursions beyond the level.
Each zone is tracked continuously for price interaction. The indicator records the number of times price enters the zone, the number of confirmed sweeps (where price briefly pierces the boundary but closes back inside), and the cumulative tick volume traded within the zone. When price closes beyond the zone boundary, it is marked as mitigated and can be shown or hidden depending on user preference. Active zones can be extended forward on the chart with a statistics label showing entries, strength, sweeps, volume, and duration in bars.
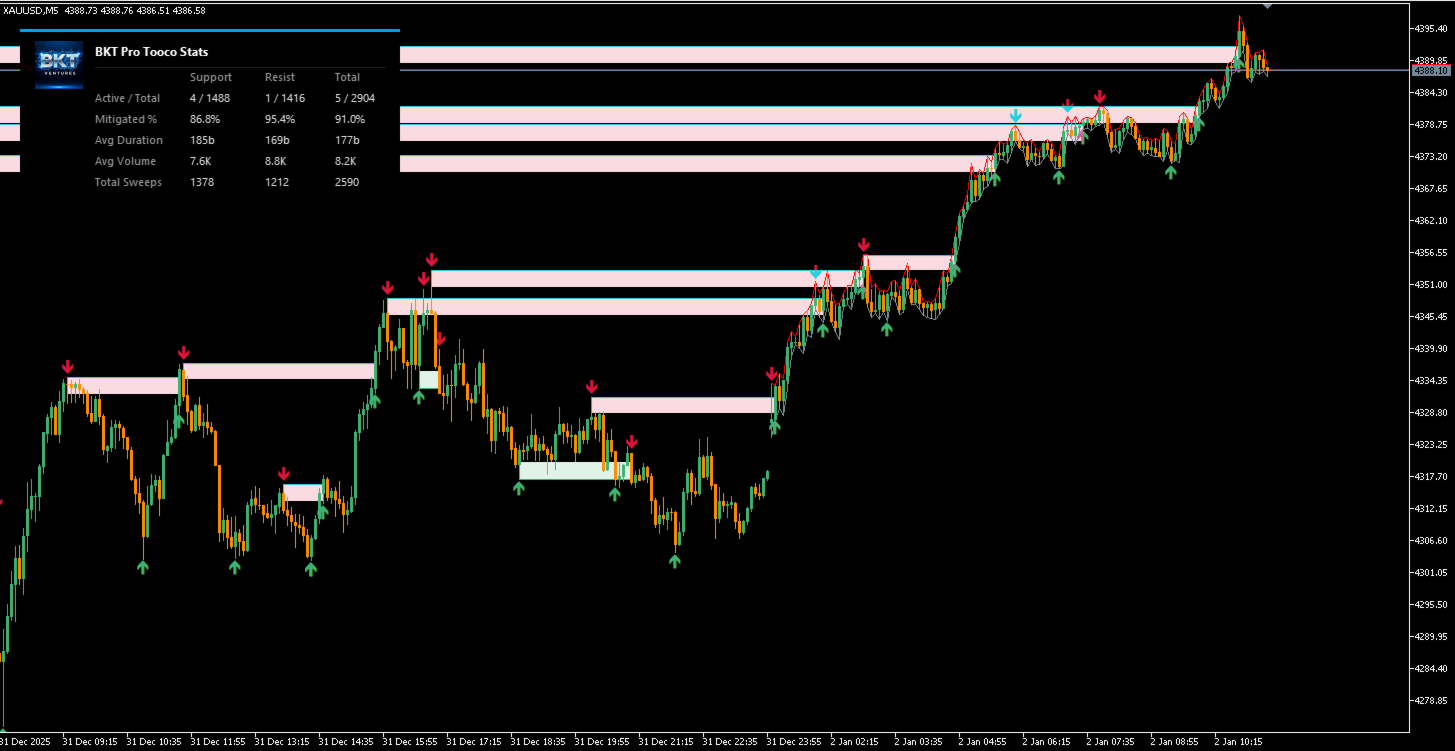
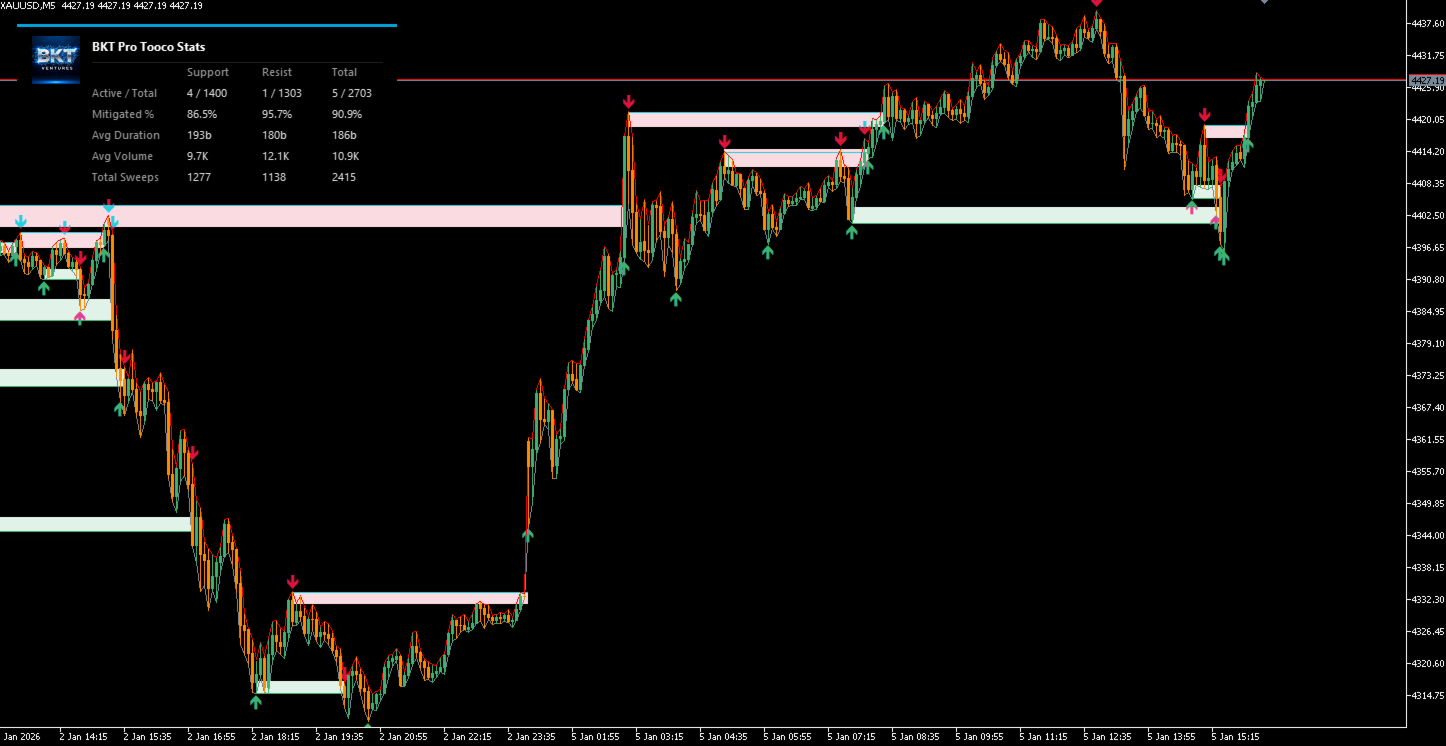
A compact statistics dashboard is rendered directly on the chart using a canvas layer. The dashboard displays a live summary of support and resistance zones broken into active counts, mitigation percentages, average duration, average volume, and total sweeps, separated by side and combined. The dashboard scales to five size presets to accommodate different screen resolutions and chart layouts.
Detection Methods
- Pivots: Identifies swing highs and lows using a configurable left and right bar lookback. A pivot is confirmed only when the candidate bar is the highest or lowest point within the full lookback window on both sides.
- Donchian: Tracks the running highest high and lowest low over the sensitivity period. A new zone is created when the dominant direction shifts, anchored at the extreme value reached during the previous trend segment.
- CSID (Consecutive Candle): Counts consecutive bullish or bearish candles. When the count reaches the sensitivity threshold, the indicator locates the extreme price within that sequence and creates a zone at that point.
- ZigZag: Uses a percentage deviation from the running extreme to confirm a swing reversal. A new zone is created at each confirmed ZigZag turning point.
How to Read the Indicator
Support zones are drawn in the configured support color and resistance zones in the resistance color. Zones can be displayed as horizontal lines at the base price or as filled rectangular areas spanning the ATR-derived zone depth. When a zone is active and the extension option is enabled, the zone continues beyond the last bar with a text label summarising its statistics.
Small arrows mark swing high and swing low detection points on the chart. A separate set of arrows highlights sweep events, where price temporarily moves through a zone boundary before closing back within range. When a zone is broken, an arrow indicates the bar of mitigation. Sweep highlighting and breakout highlighting can each be turned off independently if the chart becomes too dense.
Overlap and Filtering Controls
When multiple zones of the same type overlap in price, the indicator can handle them in four ways: display all overlapping zones without modification, merge them into a single wider zone, hide the older zone in favour of the newer one, or hide the newer zone in favour of the older one. A maximum active zone count limits how many unmitigated zones are visible at any time. Zones that do not meet minimum threshold requirements for entries, strength, sweeps, volume, or duration are automatically suppressed until those thresholds are reached.
Recommended Use
The indicator works on any instrument and timeframe available in MetaTrader 5. Donchian and ZigZag methods tend to produce fewer, more widely spaced zones and suit swing and position traders on H1 and above. The Pivots and CSID methods respond more quickly and are better suited to scalping setups on M15 and M5. Combining the indicator with a trend filter or volume confirmation tool can help prioritise which zones to trade.
Parameters
Detection Settings:
- Detection Method — Algorithm used to identify swing points: Pivots, Donchian, CSID, or ZigZag — Default: Donchian
- Swing Sensitivity — Controls the lookback period for pivot detection and the deviation threshold for ZigZag — Default: 10
Zone Construction:
- Display Style — Render zones as horizontal lines or filled rectangular areas — Default: Zones
- ATR Period — Period for the ATR calculation used to determine zone depth — Default: 200
- Zone Depth (ATR multiplier) — Controls the body height of each zone — Default: 0.5
- Breakout Buffer (ATR multiplier) — Adds a buffer above resistance or below support before a breakout is confirmed — Default: 0.0
Filtering:
- Overlap Handling — Behaviour when two zones of the same type overlap: None, Merge, Hide Oldest, or Hide Newest — Default: Hide Oldest
- Max Active Zones — Maximum number of unmitigated zones displayed at one time — Default: 5
- Show Broken Zones — Whether mitigated zones remain visible on the chart — Default: true
- Extend Active Zones — Whether active zones extend forward beyond the current bar — Default: true
Minimum Thresholds:
- Min Price Entries — Minimum number of times price must have entered the zone — Default: 0
- Min Overall Strength — Minimum strength score before a zone is displayed — Default: 0
- Min Sweeps — Minimum number of sweep events required — Default: 0
- Min Traded Volume — Minimum cumulative tick volume within the zone — Default: 0
- Min Duration (bars) — Minimum number of bars a zone must exist before it is shown — Default: 0
Visuals:
- Support Color — Color used for support zones and related markers — Default: MediumSeaGreen
- Resistance Color — Color used for resistance zones and related markers — Default: Crimson
- Highlight Sweeps — Draw arrows at sweep events — Default: true
- Highlight Breakouts — Draw arrows at zone mitigation bars — Default: true
Dashboard:
- Dashboard — Show or hide the statistics panel — Default: true
- Size — Dashboard scaling preset: Tiny, Small, Normal, Large, or Huge — Default: Small
Past zone behaviour and historical statistics shown on the dashboard are derived from the data period loaded in the chart. Longer history provides more complete statistics. All forward projections of active zones are visual aids only and do not constitute trading signals.









































User didn't leave any comment to the rating