Watch the Market tutorial videos on YouTube
How to buy а trading robot or an indicator
Run your EA on
virtual hosting
virtual hosting
Test аn indicator/trading robot before buying
Want to earn in the Market?
How to present a product for a sell-through
Expert Advisors and Indicators for MetaTrader 4 - 116

Telegram Signals Hunter Bot is a Telegram bot which you can run on you PC, it's connected to your MT4 through the Expert Adviser. The main goal of this automated process is to track trading signals coming from Telegram channels/groups then execute orders on MT4. The Bot is powered by AI to analyze extract data from each signal, then execute orders automatically and safely on your MT4. We have developed the MT5 version too, you can check it out from here: https://www.mql5.com/en/market/product/13

Midas GoldRise is a trading bot designed to operate on the XAUUSD pair in the M30 time frame. It is based on a price action strategy, accurately identifying the best buying opportunities during bullish trends in gold. For its development, high-quality data from 2007 to the end of 2024 has been used, ensuring a complete and representative history. Midas GoldRise has passed rigorous robustness tests, including tests in multiple markets and timeframes, high slippage conditions, and Monte Carlo simu

The Gold Titan is an automated trading advisor for the MetaTrader platform, developed specifically for the XAU/USD (gold) instrument. It analyzes market data and executes trades based on predefined parameters, supporting traders in their decision-making process.
Key Features: • Optimized for XAU/USD Designed with the volatility of gold in mind, making it suitable for trading the gold/US dollar pair. • Combined Market Analysis Uses a mix of technical indicators, price action patterns, and volume

Universal EA Builder is unique EA designer and has a large set of tools. which allows you to create your own Expert Advisors based on your own desires using the following types of indicators: 1 - draws arrows, opening by arrows 2 - has a main and signal line, opening at the intersection of lines 3 - one line and its intersection with levels are used 4 - extremum 5 - color change This EA-Builder has a convenient author's panel integrated, displaying important information for the trader a

Raven AI Vector is an intelligent trading advisor created by an experienced team of professionals. It is based on modern artificial intelligence technologies: two independent neural networks work in tandem - one is responsible for finding entry points into the market, and the other evaluates the potential profitability of the transaction and determines the best moment to close it. The advisor uses a classic trading approach, where only one transaction can be open on each currency pair at any g

This Multicurrency Expert Advisor is a unique author's implementation of full automation of the classic trading strategy of trading in the direction of candles using the RSI and SCI indicators as filters. The Forex Multi Universal Direction Trading Expert Advisor carries out full automatic trading simultaneously with 28 currency pairs on Forex around the clock. At the same time, in a convenient multifunctional multicurrency panel, the trader is also given the opportunity to independently open a

Market Maestro: Your Ideal Partner for Automated Forex Trading If you're looking for a reliable assistant for trading in the currency market, Market Maestro is exactly what you need. This modern Forex bot is built using the latest technologies and algorithms, allowing it to effectively analyze market data and make informed trading decisions in real-time. Key Features of Market Maestro 1. Multicurrency Capability for Broad Opportunities Market Maestro can work with a wide range of currency pairs,

MT4 Version : https://www.mql5.com/en/market/product/134601 MT5 Version : https://www.mql5.com/en/market/product/134602
Expert Advisor "Goal" is an automated trading solution based on the One Shot TP/SL strategy, which optimizes profit opportunities with precise entry and strict risk management. Using a combination of Alligator, Awesome Oscillator, and Bollinger Bands indicators, this EA analyzes market trends and momentum to execute orders with high probability.
Key Features One Shot Tr

The ATR Trailing Stop Pro is a powerful trend-following indicator designed to help traders manage risk and maximize profits. Based on the Average True Range (ATR), this indicator dynamically adjusts stop-loss levels to lock in gains and minimize losses. Key Features : Dual ATR Trailing Stops : Combines fast and slow ATR trails for optimal performance. Dynamic Stop Loss : Automatically adjusts to market volatility. Buy/Sell Signals : Clear visual alerts for entry and exit points. Cust

CFNSignals - Long Day EA for MT4 – Automated Daily Buy Strategy Version: 1.1
Developer: CFNSignals - Crusader Network SRL Overview Go Long EA is a fully automated trading system designed to open a buy trade every day at a specific time and manage it with customizable stop loss (SL) and take profit (TP) levels, trailing stops, and break-even protection . The EA ensures smooth execution with strict risk management , making it a powerful tool for traders looking for consistent and disciplined trad

Time-Based MT4 Expert Advisor Overview: This Expert Advisor (EA) is a time-based trading system that automatically opens and closes trades based on pre-set days and times. It is designed for traders who prefer scheduled trading, allowing full control over entry and exit times while incorporating risk management features. Key Features: Automated Trading: The EA automatically opens a buy trade at a specific time and day of the week and closes it at a defined exit time. Single Trade Limitation:

Introducing the " NorthSea EA " an advanced financial trading tool designed to strategically trade the popular currency pairs " AUDNZD, AUDCAD, and NZDCAD ". Powered by cutting-edge Smart Fully Automated Trading Technology, " NorthSea EA " incorporates a fully independent Decision Engine coupled with sophisticated filters to maximize profitability and enhance performance. Developed over a decade by a team of seasoned traders and expert coders, this expert advisor employs a unique strategy t

TopTrader EA Overview:
The TopTrader EA is a powerful and user-friendly trading panel designed for precision trade execution and risk management. It calculates the optimal position size based on entry and stop-loss (SL) levels and provides one-click trading functionality . Key Features: 1. Position Sizing & Risk Management: Automatic Position Sizing – Calculates position size based on the risk percentage and stop-loss distance.
Drawdown-Based Position Adjustment – If drawdown protection is
GO Multi Oscillator Divergence Entry is a unique divergence indicator that is different from all other divergence indicators on the market.
After purchase, leave a review, a comment or make a screenshot of your purchase and contact me to receive for free the Trade Entry Manager utility !
The uniqueness of the indicator consists of two key elements :
unlike other divergence indicators, this indicator does not use an oscillator subwindow, thus you can search for divergence of multiple oscilla

FOREX FLIP ALERT - Show where the price will reverse with more than 95% probability. This information will help every trader to effectively open trades. The indicator on the chart draws arrows in which place and in which direction the price will reverse. The indicator does not redraw its arrows and shows price reversals for medium and long distances. This means that after the arrow appears, the price will go in the indicated direction for many points.
Benefits of the indicator: Gives sign

XPulse has been created to grow people's capital in a simple and accessible way. If you are tired of algorithms that seem to work great in backtesting but then don't work the same in live accounts, then XPulse is the solution you are looking for. It is an algorithm specifically designed to exploit an inefficiency of the Aussie-Cad pair. With a robust backtest and two live signals to back up the performance of the algorithm. // For additional in-depth details, kindly refer to the Manual Guide .
INTRODUCTION : · This EA trades according to the color of the candle. If a candle with a green body appears, a buy position is opened, if a candle with a red body appears, a sell position is opened. It works very sensitively and automatically, following the color of the candle. · You do not need to analyze the market. If a candle with a long body appears, additional positions are opened and the profit is increased. If a candle with a long tail appears, the profit protection and sto

Price Grid Navigator EA Unlock the Power of Murrey Math for Precision Trading The Price Grid Navigator EA is a cutting-edge Expert Advisor designed to automate trading strategies based on the renowned Murrey Math Trading System . This EA is perfect for traders who want to leverage the precision of Murrey Math levels to identify key support and resistance zones, execute trades, and manage risk effectively. Key Features Automated Murrey Math Trading : The EA calculates and plots 13 Murrey
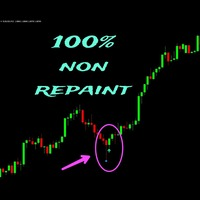
Forexo is an easy-to-use Forex indicator that gives traders clear and accurate signals based on clear trend retests . Forget about lagging indicators or staring at charts for hours because this Forexo indicator provides real-time entries with no lag and no repaint, so you can trade with confidence without analyzing the market. Working of indicator:
This indicator is based on price action with help of stochastic, RSI & SMA.
Setup Recommendation:
Recommended timeframes: Any timeframe works

"Smart Panel" is a powerful tool for traders and analysts that combines convenience, speed, and functionality. The program allows you to instantly add popular indicators such as Moving Average and Bollinger Bands to your chart, as well as provides access to open order data and market information with just one click. Key Features: Instant Indicator Addition :
Click a single button to add Moving Average or Bollinger Bands to your chart. No more manual parameter setup—the program does it

️ EA Close Order Time (Code by ThangTruong)
- Automatically close orders by time (day + hour) - Close orders by currency pair installed EA or all currency pairs - Close all BUY orders by time - Close all SELL orders by time - Close all PROFIT orders by time - Close all LOSS orders by time
Details at: https://discord.gg/J87vyRUJCj
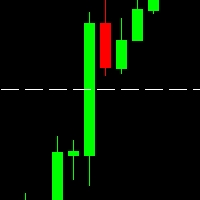
Данный скрипт работает перетягиванием на график, на нужную свечу и рисует белую прерывистую линию ровно по середине 50%, что помогает быстро и точно нарисовать на открытом графике разделяющую пополам линию - для тех кто ищет середину японской свечи на графике Тайм фрэйм может использоваться абсолютно любой, проверен и протестирован на платформе Metatrader 4

Special Offer: For the first 10 buyers, a special low price applies, after which the cost will increase. This is a unique opportunity to purchase the advisor at a discounted price. The Roobi advisor boasts a high percentage of profitable trades, reaching 73% over the past five years of testing. It is specifically designed for the EUR/GBP M30 currency pair but can be adapted for other pairs through parameter optimization. Its operation is based on several powerful indicators, including the Steady

YenZen is a trading bot designed to operate on the GBPJPY pair on the H1 timeframe. It is based on the RSI indicator, identifying overbought and oversold zones to execute both buy and sell orders at optimal times. For its development, high-quality data from 2007 to the end of 2024 was used, ensuring an extensive and representative history. YenZen has passed rigorous robustness tests, including testing on other markets and timeframes, high slippage conditions, and various Monte Carlo simulations

MT5 version Welcome to CyberAurora IA X. We are a group of traders who, after years of manual trading in the gold market, have implemented our strategy with the SQX AI. The AI has confirmed the success of this strategy and has improved it with new options that have made it more efficient and accurate. CyberAurora IA X exploits support and resistance levels to look for breakout points and take advantage of the best trading opportunities. It has transformed a solid strategy into a sophisticated to

This Expert Advisor is designed for the XAUUSDT pair and utilizes a combination of Grid and Martingale techniques to manage buy-only trades. It operates on the H1 timeframe, making it suitable for medium-term trading in trending or ranging gold markets. Strategy Overview: Grid Trading (Buy-Only): The EA places multiple buy orders at defined intervals as price moves, seeking to benefit from market retracements during an uptrend. Martingale Position Management: When the price pulls back, the EA in

Candlestick Trend Scalper — Trend-Based Scalping Expert Advisor
Safety first! This EA does NOT use dangerous strategies such as Martingale, grids, averaging, or other high-risk methods. How does it work? The EA opens short-term trades and closes them based on the following conditions:
Take Profit — locking in profit
Stop Loss — limiting losses
Trailing Stop — securing profits ️ Expert Advisor Parameters ️
Trend Filter
EnableTrendFilter : Enable/Disable trend filter

Sterling Wizard MT4 Expert Advisor The Sterling Wizard MT4 is a highly advanced Expert Advisor (EA) designed specifically for trading GBPUSD (British Pound/US Dollar) pair. Developed with years of rigorous backtesting and live testing across various market conditions, this EA offers a blend of intelligent trading strategies, risk management features, and user-customizable settings, making it ideal for both novice and professional traders. Key Features: Customizable Risk Management : Choose b

Crypto_Forex Indicator " Morning Star pattern" for MT4. Indicator "Morning Star pattern" is a very powerful indicator for Price Action trading: No repaint, No delay. Indicator detects bullish Morning Star patterns on chart: Blue arrow signal on chart (see pictures). With P C, Mobile & Email alerts. Also its brother - bearish " Evening Star pattern" indicator is available (follow the link below). Indicator " Morning Star pattern" is excellent to combine with Support/Resistance Levels

S Bot
====================================== This Bot is unique ️Please test it and you will be surprised how good the robot is. ️The Robot is based on alot Indicators to make sure the entry is as accurate as possible. ================================================== This Robot is fully automated and has been created for everyone. The Robot works also on cent accounts. =============================================================================================== ️=> works on all

Trade Balance Protector The Automatic Guardian of Your Balance Are you worried about protecting your capital while trading in the financial markets? Trade Balance Protector is the ultimate solution for automatically managing your profits and losses, ensuring your balance is always under control. Designed for traders who value discipline and risk management, this EA allows you to trade with confidence, knowing your trades are protected by a smart and reliable system. Key Features Automatic Ta

In a world where markets breathe to the rhythms of thousands of indicators, our trading advisor becomes a subtle tuner, capable of capturing barely noticeable harmonies in chaos.
Excess Vidya Levels is a trading advisor based on the interaction of the volatility excess indicator and a long-term dynamic trend model, becoming your indispensable partner in financial analysis and decision-making. Unique features of the system: Signal Quality : The application of the indicator metric helps detect per
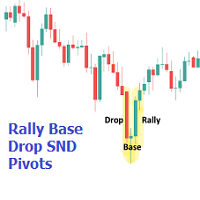
The Rally Base Drop SND Pivots indicator uses "Rally", "Base", and "Drop" Candles to determine pivot points at which supply and demand (SND) levels are drawn. (Figure 1) USAGE Figure 2 Rally, Base, and Drop (RBD) candles create a formula for seeing market structure through a fixed methodology. We are able to use this concept to point out pivot areas where Rallies and Drops directly meet.
The RBD SND Pivots are similar to traditionally identified "fractal" pivot points, with one key differ
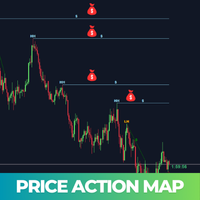
Price Action Map is an advanced trading indicator meticulously designed to provide clear visual insights into market structure by precisely labeling Higher Highs (HH) , Higher Lows (HL) , Lower Highs (LH) , and Lower Lows (LL) . Traders who find it challenging to accurately identify higher highs, lower lows, or understand different market phases will find this tool exceptionally valuable. Price Action Map significantly simplifies the analysis process, enabling traders at all skill levels to con

Follow the trend is a visual indicator which will color the candles according to the RSI algorithm and gives you recommended FVG entry points and recommended stoploss. NON REPAINTING! A confirmation arrow will appear on the first new Fair Value Gap formed! Best used : 5 minute timeframe or higher ! Trend Panel: FVG : Last fair value gap. Span : above , below or inside the Ichimoku cloud. Rsi: RSI algorithm section You can easily grab and move the panel on the chart! By looking at the pane

Ego Prime – Smart Trend & Reversal Scalping EA Ego Prime is a powerful and adaptive Expert Advisor designed to follow market trends while strategically capturing potential reversals using an advanced scalping technique. This EA leverages precise entry logic to ride strong trends and dynamically adjusts to market conditions, ensuring maximum profitability with minimal drawdown. Key Features: Trend-Following Core: Identifies and follows strong trends for high-probability trades.
Reversal Scalp

Tengai Armor EA: Precision-Tuned for USDJPY M5 Trading Designed to harness the volatility of USDJPY, Tengai Armor EA is an Expert Advisor for MetaTrader 4. Optimized for the 5-minute chart (M5), this system captures short-term trends with high precision while safeguarding capital through adaptive risk management. Key Features Volatility-Driven Entries: Detects high-probability entry points using proprietary ATR-based thresholds. Dynamic Trailing Stop: Automatically adjusts stop-loss levels
The Definitive Performance Testing Solution for MetaTrader Environments What This Tool Does This specialized benchmark utility measures the performance of your MetaTrader environment, providing insights that impact your trading execution. Unlike generic system benchmarks, this tool evaluates performance specifically within the MetaTrader runtime environment. For Professional Traders & Developers: Performance Metrics : Measurements of calculation throughput and memory efficiency Trading-Specific

The Time_Price_SQ9_Degree indicator is based on the 9 Gann square. Using this indicator, you can identify strong time and price zones. The indicator displays the levels as a degree value. The degrees can be set in the settings. After launching, the MENU button appears. If it is highlighted, it can be moved to any point on the graph, and after double-clicking on it, it stops being highlighted and menu buttons appear. To hide the menu, just double-click on the button, it will become highlighted a

Copiador – La Mejor Herramienta para Copiar Operaciones en MetaTrader 4 Este no es un simple copiador de operaciones que únicamente permite copiar transacciones de forma local entre diferentes cuentas de MetaTrader 4 en cualquier dirección y cantidad. ¡Por supuesto que lo hace! ¡Pero Copiador hace mucho más! Descubre sus características y beneficios a continuación FUNCIONALIDADES DESTACADAS: Copiado entre brokers diferentes : Puedes copiar operaciones desde una cuenta en un broker
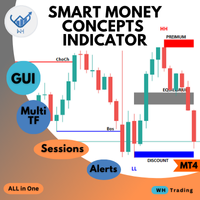
Welcome to the ultimate Smart Money Concepts indicator ,, this indicator is All-in-One package the only thing you need to empower
all the Smart Money Concepts in one place with interactive advanced gui panel with all the features and customization you need. MT5 Version : WH SMC Indicator MT5 *This Price For Limited Number of Copies.
Features: Main Section: User-Friendly Panel (GUI): Designed for traders of all experience levels, the indicator integrates seamlessly into your MT4 platfo

Candle Volume Strength is an advanced volume analysis indicator that provides insights into the ongoing battle between buyers and sellers. It calculates and visualizes real time volume shifts, helping traders confirm breakouts, trends, retracements, and reversals with greater accuracy.
Key Features: Volume Based Confirmation – The indicator monitors tick volume changes and alerts when market power shifts between buyers and sellers. Trend and Breakout Validation – By analyzing volume distributio

IMPORTANT! After the purchase please send me a private message to receive the installation manual and the setup instructions.
NebulaTrade Genesis MT4 is a powerful Expert Advisor (EA) engineered for precise US30 trading during New York market hours. Designed for both Prop Firm Challenges and Personal Accounts , it executes 1-4 high-quality trades per day , ensuring low drawdowns and strategic risk management . Unlike many EAs that rely on Martingale, Grid, or Hedging , NebulaTrade Gen

Scalp Master Pro. Scalp Master Pro is a cutting-edge Expert Advisor (EA) designed for traders who want to scalp the markets with precision and confidence. Built with advanced ATR-based strategies, this EA dynamically adjusts to market conditions, ensuring optimal managing risk effectively. Whether you're a beginner or an experienced trader, this EA simplifies managing trades and incorporating smart spread adjustments for better execution. Advantages of Scalp Master Pro: Risk Management : Inco

API BullBearPower mtf
Designed for traders who rely on BullBearPower, this tool provides a multi-timeframe (MTF) view of BullBearPower, helping you identify possible dominant trends.
Key Features: Multi-Timeframe Analysis – Analyze BullBearPower across different timeframes in real time. Dynamic Color Changes – Identify possible BullBearPower per individual timeframe with color changes. Volume Integration – Get a picture of possible trend strength with BullBearPower volume of each timefra

Smart Throwback Pro is a professional trading algorithm that specializes in identifying throwback (pullback) entries within trending markets. It detects price retracements to key levels such as support, resistance, order blocks, and Fibonacci zones, ensuring high-probability trade setups.
This expert advisor is ideal for traders who focus on trend continuation strategies while minimizing risk. Features & Functionalities: Throwback & Pullback Strategy – Captures retracements in trending markets.

3 Trading Strategies to Exploit Market Structure (Without Overcomplicating It)
Trading isn’t about predicting the future—it’s about spotting patterns, managing risk, and acting when odds favor you. Below are two timeless strategies (and one hybrid) that align with how markets actually move, not how we wish they would. Some of the strategies you can trade with the indicator [ Note] Higher timeframe should be 15x of the lower timeframe, for eg. htf 15min, ltf 1min. 1. The Breakout Trap: Trad
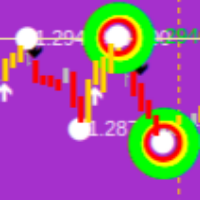
Revolutionize Your Trading with This Powerful Indicator-Based System Are you struggling to find accurate entry and exit points in trading? Do you want a proven, indicator-driven system that helps you maximize profits and minimize risks ? Introducing our Advanced Trading System —a powerful, easy-to-use technical analysis tool designed for forex, stocks, and crypto traders . Key Features & Benefits: Precision Buy & Sell Signals – Our system generates crystal-clear buy (green) and sell (red

The Gold Edge is an automated trading advisor for MetaTrader 4, specifically developed for the XAU/USD (gold vs US dollar) instrument. The algorithm is optimized for low-spread environments and focuses on precise execution and customizable risk control.
Key Features: • Small Stop Loss Use Implements a compact stop-loss to help control potential drawdowns per trade. • Optimized for Low Spread Accounts Ideal for ECN, Raw Spread, or similar account types with minimal commissions. • Flexible Risk M

The FTC Hedge Advisor works by placing a strictly limited grid of orders in a certain range with a built-in hedging algorithm, which makes it possible to fully control the risks of the trading account balance. Up and down from the average price line (daily time frame), the space is divided into separate ranges of equal value as a percentage of the average line. In each individual range, the Expert Advisor opens and closes positions independently of other ranges.
A grid of orders operating in r
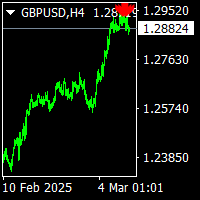
sinus arrows indicator is norepaint arrows indicator. it works all timeframes and all pairs. suitable for experienced traders and beginners. gives red arrows for sell.and gives blue arrows for buy. traders must check the all timeframes.i mean when trading 5m charts also need the check 15m charts and 1m charts. there is cnt number to see the how much bars back bars.
This indicator is designed primarily for manual trading. It analyzes recent price movements and processes them using its own algorithm. Based on this analysis, the indicator calculates the most important price levels. These levels divide price values into three zones: buy, sell, and neutral. New positions should only be opened if the price is in the corresponding zone. If the price is in the neutral zone, you should consider closing positions or moving them to breakeven. The indicator also pr

ICT Phantom Trader is a professional-grade trading algorithm that leverages Inner Circle Trader (ICT) Engulfing Patterns and institutional trading strategies. It is designed for traders who follow Smart Money Concepts (SMC), focusing on liquidity, order blocks, and price action confirmation. Previously priced at $100 per month , all my bots are now available for a limited-time promotion at just $ 36 per month.
Features & Functionalities: ICT Engulfing Pattern Detection – Identifies high-probab

Nice Try Super Diddy Trend – an innovative technical analysis tool designed for experienced traders seeking a deep understanding of market dynamics. This indicator utilizes complex algorithms to calculate liquidity flows and momentum, identifying potential reversal points and trend continuations.
Uniqueness and Value Nice Try Super Diddy Trend is more than just signal generation—it analyzes the hidden structure of the market, examining the amplitude of price fluctuations and directionality while

[Ai] Autonomic computing is an intelligent computing approach that autonomously carries out robotic and interactive applications based on goal- and inference-driven mechanisms. ' Ai Panel Genius X ' is a premium indicator designed as a serious professional expert's friend. It instantly provides expert knowledge on all pairs, including multi-pair analysis, all in one advanced 'wysiwyg' visual presentation. From beginners to experienced traders, anyone can easily master it using the 'sublimina

Winged Golden Dragon – Advanced XAUUSD Scalping MT4 EA for Prop Firms and Live Accounts Unlock the power of Asian precision trading with Winged Golden Dragon , a cutting-edge Expert Advisor designed exclusively for XAUUSD (Gold) on the 15-minute timeframe . Built for traders seeking consistent results, this EA combines innovative fake breakout detection with healhy risk management to deliver optimal performance in both prop firm challenges and live trading environments . Key Featur

Fibo Eagle EA for MT4 - Fibonacci-Based Grid Trading Expert Advisor Overview FiboEagleEA is a sophisticated Expert Advisor (EA) designed for traders who want an automated trading system powered by the Fibonacci sequence. This EA integrates grid trading principles with advanced money management tools, delivering a blend of precision, adaptability, and profitability potential. Whether you're new to trading or a seasoned professional, FiboEagleEA adjusts to various market conditions, making it a ve

PUMPING STATION – Your Personal All-inclusive strategy
Introducing PUMPING STATION — a revolutionary Forex indicator that will transform your trading into an exciting and effective activity! This indicator is not just an assistant but a full-fledged trading system with powerful algorithms that will help you start trading more stable! When you purchase this product, you also get FOR FREE: Exclusive Set Files: For automatic setup and maximum performance. Step-by-step video manual: Learn how to tra
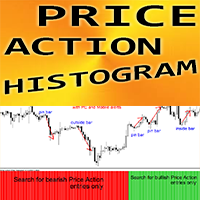
Crypto_Forex Indicator "Price Action Filter Histogram" - is an efficient auxiliary trading tool for Price Action trading! No repaint. This indicator suggests to trader the direction of entries. Then trader just need to search for Price Action signals in that direction. Price Action Filter Histogram should be combined with Price Action patterns and support/resistance levels. Green color histogram - Look for Buy entries. Red color histogram - Look for Sell entries. There are plenty o

******************************* ***************** ********************** ***************** ********************** *************************
GoldMine Train is a Trend trading strategy EA for Gold.
Operator determines the major trend direction and instruct the Train to go. The Train will continuously BUY/SELL in the direction. Lot volume will depends on the Account Balance and preset Leverage ratio. When Operator change the trend direction, the Train will stop and lock the profit. User can easil

Smart Market Structure Simple is a powerful indicator that helps traders identify market structure based on the Smart Money Concept (SMC) . This indicator automatically detects Break of Structure (BOS), Change of Character (CHoCH), Fair Value Gaps (FVG), Order Blocks (OB), Liquidity Zones (LQZ), and key swing points Higher High (HH), Higher Low (HL), Lower High (LH), Lower Low (LL) . Main Objective: Assist traders in tracking institutional flow ( Smart Money ) and finding high-p

The EA is designed based on the MACD indicator. This is a " RAW " EA, meaning: The EA has only completed basic tasks such as algorithm design and backtesting with tick data over 10 years. The EA has not been optimized and tested on a real account. The minimum price for the optimized version will be $99 .
If it succeeds on a real account for at least one year , the maximum price will be $5,000 . Thank you for your interest and for downloading. More high-quality " RAW " EAs will be available in th

Introducing X-ALPHA SCALPS - My Elite Quantum Trading Expert Advisor —the ultimate solution engineered for high-frequency, precision trading across forex, cryptocurrency, and commodities. Designed with cutting-edge technology and refined by advanced mathematical models, this EA transforms your trading strategy into a dynamic, high-performance engine. Why X-ALPHA SCALPS? Hybrid Algorithmic Mastery: Multi-Strategy Integration: Seamlessly blends high-frequency trading, statistical arbitrage, an
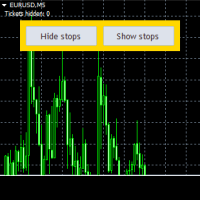
This is an Expert that gives you a control panel with two buttons - 'Hide Stops' and 'Show Stops'. With a click of a button you can hide your stoploss and takeprofit levels from your broker and restore them if necessary. When levels are hidden Expert tracks orders in the background and closes them as soon as the price exceeds hidden levels. It is not opening new orders just working with existing ones, only stoploss and takeprofit levels are not visible to the market. Choose zero as magic number

这是一个双均线指标,使用历史数据,通过较为严格且大众化的计算公式,计算得出主要均线的数值,然后再将其均线化,从而最大可能的避免了在走势不确定的情况下,均线发出错误的交易信号。最重要的是,可以结合您自己的交易专家,实现最大化的交易利润。 手工交易参与者也可以使用本指标,结合MACD 等其他指标也可获得比较高的准确率
建议使用默认参数。本指标适合各种周期,交易品种适合黄金、比特币等波动较大的交易品种。目前我并未设置可以改变交易指标的颜色、线的大小的选项,我认为此这些都是不重要的,重要的指标的准确率以及帮助交易者能够更改好的获取利润。如果有认为需要改变颜色或者线大小的选项?可以私信我,我单独为您定制你需要的设置。

Pips Hunter M1 – Скальперский Советник Валютная пара: EUR/USD, EURJPY, GBPUSD Таймфрейм: M1 Время работы: 24/7 Требования к брокеру: Минимальный спред – для максимальной эффективности Быстрое исполнение ордеров – без задержек и реквот Низкая комиссия – для снижения издержек Наличие VPS – стабильная работа без перебоев Разработан для активного скальпинга и максимального профита!

MT4 Version : https://www.mql5.com/en/market/product/133949 MT5 Version : https://www.mql5.com/en/market/product/133950
"Wall Street Nasdaq" – Professional Expert Advisor (EA) for US100 Index
Description: "Wall Street Nasdaq" is an Expert Advisor (EA) specially designed for trading US100 index (NASDAQ 100) with One Shot Trading strategy. This EA uses strict risk management approach, where each position is always equipped with Take Profit (TP) and Stop Loss (SL) to optimize profit and minimize

In the world of trading, where every tick can be the beginning of a new story, it is crucial to have a reliable ally. TrendVarianceSpectrum is not just a trading robot; it is your guide in the volatile markets. Built with years of experience and trained on over 25 years of data, it combines the elegance of mathematics with the power of modern technology. Key Advantages of TrendVarianceSpectrum : Minimal Drawdown: TrendVarianceSpectrum operates with significantly low drawdown, making it one of

Smart Trail Manager – The Ultimate Trade Management EA Take Full Control of Your Trades – Smart, Fast & Reliable! Smart Trail Manager is an advanced trade management Expert Advisor (EA) designed for traders who demand precision, automation, and speed . Whether you’re a prop firm trader, scalper, swing trader, or news trader , this EA ensures your trades are managed efficiently and securely with fully customizable features. Key Features & Functionalities: Profit & Loss Management: Set Take
The advisor is a scalper designed to operate on the M1 timeframe. Scalping is a strategy where trades are opened and closed within a short period, often aiming to profit from small price fluctuations. Usage Recommendations: Broker: Choose a broker with fast order execution. This is critical for scalping. Testing: Before using on a live account, test the advisor on a demo account or in the Strategy Tester in MetaTrader. Ensure the advisor works stably on your selected pairs and settings. Low-
The MetaTrader Market offers a convenient and secure venue to buy applications for the MetaTrader platform. Download free demo versions of Expert Advisors and indicators right from your terminal for testing in the Strategy Tester.
Test applications in different modes to monitor the performance and make a payment for the product you want using the MQL5.community Payment System.
You are missing trading opportunities:
- Free trading apps
- Over 8,000 signals for copying
- Economic news for exploring financial markets
Registration
Log in
If you do not have an account, please register
Allow the use of cookies to log in to the MQL5.com website.
Please enable the necessary setting in your browser, otherwise you will not be able to log in.