Watch the Market tutorial videos on YouTube
How to buy а trading robot or an indicator
Run your EA on
virtual hosting
virtual hosting
Test аn indicator/trading robot before buying
Want to earn in the Market?
How to present a product for a sell-through
Expert Advisors and Indicators for MetaTrader 4 - 111

Solenox Boost — arrow-based price direction indicator. Solenox Boost is a visual arrow indicator that displays potential market entry points directly on the chart. It generates buy and sell signals based on the analysis of local highs and lows smoothed by moving averages, while also factoring in market volatility through the ATR indicator. Signals appear as clearly visible “BUY” and “SELL” text labels at precise price levels and times. It is strongly recommended to enter trades only after the cu

TimeLS_LightSpeed is a time-based expert advisor (EA) for MetaTrader 4/5, designed to execute and manage trades with precision at specific moments in time. It offers highly configurable inputs to control trading windows, position types, and exclusive scheduled deals with individual parameters. Message me if any questions, I have some predefined .set`s for some markets. Main Functionalities and Settings Trade Permissions Enable or disable opening of LONG (Buy) or SHORT (Sell) positions individual

Supernova Trading Indicator – See the Market Like Never Before Supernova isn’t just an indicator — it’s your secret weapon. Powered by advanced algorithms and real-time analysis, Supernova cuts through the noise and reveals high-probability entry and exit points with stunning clarity. No more guesswork. No more hesitation. Whether you're trading forex, crypto, or stocks, Supernova adapts to any strategy and any timeframe — delivering clean, confident signals that help you trade faster, smarter,
Индикатор Стрелочник для Скальпинговой работы Философия и логика работы индикатора Этот индикатор создан для фильтрации рыночного шума и поиска мощных, подтвержденных трендовых движений. Его основная идея — входить в рынок только тогда, когда несколько независимых друг от друга математических моделей подтверждают наличие сильного тренда. Три алгоритма подтверждения: Чтобы определить направление и силу тренда, индикатор использует три совершенно разных подхода: Алгоритм 1: Моментум на основе С

AI Predictor is an artificial intelligence-based indicator trained to forecast future price movements several bars ahead. You can specify the number of forecasted bars in the indicator settings. The longer the indicator remains on the chart and gathers analytical data, the more accurate its price predictions become. The indicator draws future candles predicting with high probability the direction in which the price is likely to move. The AI Predictor indicator is designed to forecast price movem

This Expert Advisor takes a look at the market each day and try to study the market direction using the candle formation at a specific time of that day, and based on its conclusions it places trades in opposite directions and wait for the market to trigger either (Buy or Sell) of the directions. Once a direction is triggered, it focuses on that trade until it hits its targets. As such, trades are one per time and runs until a complete predefined circle of profit or loss is reached before another

Welcome to trading without emotions and having consistent profitable trades frequently. Profit targets are quick, so you don't incur more cost on holding trades long. All actions taken by the Phaco EA you just need to relax and watch it work for you. Best used with VPS . Strategy used is market break structure by placing pending orders on recent highs and lows. Price usually returns and pass's those levels when in a trend. At moment has capability with MetaTrader 4 . Soon to have MetaTrader 5

Smart Trendlines – No.1 Trendlines Indicator Smart Trendlines is a precision tool that automatically draws trendlines based on every valid pivot point, helping traders identify key support and resistance zones. It continuously adjusts as new market pivots form, providing a live and accurate reflection of price structure. Whether you’re tracking trends, preparing for reversals, or anticipating breakouts — this indicator keeps you one step ahead. It works seamlessly across all assets including For

AI Driven US30 Index Trading Bot for MT4 is an advanced automated trading system specifically designed for intraday trading on the US30 (Dow Jones) index. (Note_SET FILE IS ATTACHED IN COMMENT)
The EA intelligently identifies high-probability trade setups using dynamic price action and built-in adaptive logic. Key features: Optimized for US30 index (works best on M15 and M30 timeframes) Smart position management with customizable Stop Loss, Take Profit, and Trailing Stop Adaptive entry and exit

Oil XTrender Oil XTrender is a powerful Expert Advisor (EA) specifically developed for trading crude oil instruments , such as XTIUSD or WTICOUSD . It features strict signal confirmation using candlestick behavior , combined with an adaptive averaging and take profit system tailored for trending and volatile conditions. Although optimized for crude oil with 2-digit pricing , Oil XTrender can be used on other instruments after proper backtesting and parameter tuning . We have updated deafult set

Smart Gold EA for MT4 is an automated trading tool designed for Forex, with a special focus on XAUUSD, optimizing profits while minimizing risk. Key features include automated trading, objectivity, and fast market response. Market knowledge is required for optimal use. the full list for your convenience is available https://www.mql5.com/ru/users/pants-dmi/seller
Smart Gold EA Advantages
Smart Gold EA is an innovative trading solution that automatically analyzes and executes trades in the fore

Why Ethical EA is Different — and Why It Matters
Built for results. Designed with faith. Powered by integrity. Just downloaded the demo? For best results, run it on GBP/USD or EUR/USD (H1 or H4) with a $10,000 balance using default settings
I’ve also developed a second Ethical EA that avoids Friday trades and overnight volatility — built for extra caution in volatile sessions.
Due to platform restrictions, I can’t publish it here — but I’ll send the full source code free to users who

Gold FlashScalp Pro I didn’t build this bot for fame. I built it for survival. Like many of you, I started small. I lost money chasing indicators, copying influencers, and buying flashy EAs that promised the moon and gave me nothing but drawdown. After three years of struggle, testing, tweaking, and real screen time — this little bot is what finally turned things around for me. Gold FlashScalp Pro is the first working version of the tool that helped me grow my tiny account into something real. I

SAFEGRIDX – AI-Powered Grid Trading, Built for Gold. Built for Safety. Step up your trading game with SAFEGRIDX—where intelligent automation meets unbeatable risk control!
Powered by advanced AI logic, SAFEGRIDX takes grid trading to the next level, delivering powerful profits on XAUUSD and other top symbols—while keeping your capital protected at all times. EA will only work with my custom settings , u will have losses without my custom settings . MIN Balance - 500$ ( min 200$ profit monthly fo

The "Phoenix vest" Expert Advisor is a powerful solution based on advanced market analysis and data processing technologies. Utilizing cutting-edge algorithms for time series and multitimeframe analysis and complex mathematical models, it ensures high accuracy in forecasts and automates trading processes. The EA is designed to combine performance and reliability, making it an effective tool for trading.
Advantages of The "Phoenix vest" Expert Advisor: Realistic Testing: Trades executed duri

Gann Recovery Expert Advisor - Advanced Trading System for MT4 Revolutionary Trading Strategy with Built-in Recovery System This sophisticated Expert Advisor combines the power of Gann Hi-Lo technical analysis with an intelligent recovery-based position sizing system to create a robust automated trading solution. The EA is specifically designed to maximize profitability while managing risk through advanced money management techniques. Key Features & Trading Logic Gann Hi-Lo Signal Generati

MACD Gladiator EA – Structured Trading Using MACD and EMA Logic MACD Gladiator is an Expert Advisor (EA) designed to follow structured trend-based signals using the MACD indicator in combination with an EMA filter. It operates based on clean entries and avoids high-risk strategies such as martingale or grid systems. Key Features: MACD crossover logic with signal line validation EMA trend filter to improve signal quality Strictly one position at a time per symbol Risk control via user-defined

FlashTrader relies on a powerful combination of scalping and trend strategies, supported by smart indicators such as: and more than 5 professionally built-in strategies. for XAUUSD
Backtest Results: * Stable cumulative growth with a clear upward trend from the start to the end of the test. * Execution accuracy rate: 89.70% * The bot maintains a balance between profit and risk, with a high ability to recover from drawdowns. * Testing was conducted using Every Tick Mode (the most accurate back

The indicator identifies ordered trend structures. Each structure consists of at least three waves: the formation of the primary movement, a rollback, and a breakout of the primary movement.
One wave in the structure is considered to be the market movement between opposite price extremes, which corresponded to different positions of the points of the classic Parabolic Support And Reverse (PSAR) indicator relative to the closing prices of the candles: a point below the price - searching for a m

TradeManager 1.0 is an Expert Advisor for MetaTrader 4 y 5 that streamlines real-time trade management. Through a graphical control panel, you can send market and pending orders, move stop losses to breakeven, and automatically calculate position size based on your risk settings. Below is a comprehensive overview of its features and input parameters.
Key Features Market Orders & Pending Orders BUY/SELL Buttons : Instantly open long or short positions at market. BUY STOP / SELL STOP / BUY LIMIT

This is an indicator that has been updated from the previous VRC indicator, which has both buy and sell arrows now, and it is optimised from the previous one. You can try it out, the version is upgraded and might suit your trading style. You can also use this indicator as a confluence, or you can use it as a main signal provider; it can be used along with your strategy or top-down approach analysis. Past performance does not guarantee future performance; kindly do a top-down analysis and keep yo

Historical Pivot Zones Indicator This is a sophisticated support and resistance indicator that automatically identifies and displays multiple price levels based on historical data. Here's what makes it valuable: Core Functionality The Historical Pivot Zones indicator analyzes previous time periods (2 days, 2 weeks, 2 months, or 2 years ago) to establish support and resistance zones that are projected onto your current chart. It creates a comprehensive framework of potential price reaction zones

Forex Bacteria Expert Advisor for MetaTrader 4/5 Forex Bacteria is an automated Expert Advisor (EA) designed for MetaTrader 4/5. Just as beneficial bacteria symbiotically coexist with us in nature, we strive to coexist harmoniously and symbiotically with the markets. It's a plug-and-play EA where you only need to set your risk management preferences and choose the days of the week you want to trade. Primarily focused and optimized over the past 12 years, it works best with three major currenc
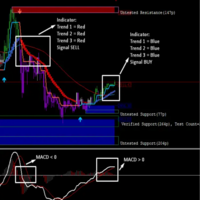
Scalping Road is a bundle of trading indicators and easy to use. There are 4 main indicator that give you a best signal to open position. You can do scalp or swing depend on timeframe you use.
After purchase you will be able to instantly download the Scalping Road indicator. Moreover I provide the extra indicator shown in the screenshots below to all users of the Scalping Road for free as a bundle! The combo of these indicators can help you make your trading with any timeframe easier and more

We all love safe trading, so that with a minimum drawdown you can earn enough money to live on and still have some left over. However, this requires a serious deposit, otherwise the money you earn will not be enough to even pay for your minimum needs. Where can I get money? Earning money through physical labor is good in theory, but in practice it is unlikely to work. Taking a loan or credit is very dangerous and is categorically not recommended, and most likely they will not give it. Selling s

Triangle Engine has been created to grow people's capital in a simple and accessible way. If you are tired of algorithms that seem to work great in backtesting but then don't work the same in live accounts, then Triangle Engine is the solution you are looking for. Triangle Engine is an advanced algorithm meticulously designed to identify and exploit the inherent vulnerabilities of AUDCAD. Using a sophisticated set of metrics and different strategies, this system performs an in-depth, real-time a
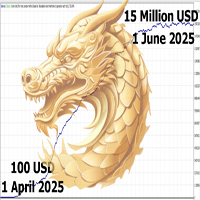
The Golden Dragon
>>>>>>>>>>>>>>>>>> WORKS WITH 1 MIN (Better) AND 5 MIN CHARTS <<<<<<<<<<<<<<<<<< A precision-engineered grid trading bot for MetaTrader 4 ️ Golden Hedge Maestro is designed for traders who value structure, control, and strategic risk management. Built on a dynamic hedging grid system, this expert advisor automatically places buy and sell orders at calculated intervals to capitalize on price movements—regardless of direction. What sets it apart is its ability to intellige
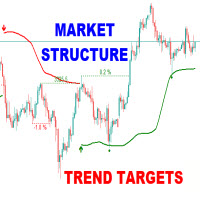
The Market Structure Trend Targets is a powerful trading indicator designed to give traders a clear, structured, and data-driven view of market momentum, breakouts, and key price reaction zones. Built on the principles of smart market structure analysis , it helps identify not only trend direction, but also precise breakout levels , trend exhaustion , and potential reversal zones — all with visual clarity and trader-friendly metrics. Key Features Breakout Points with Numbered Markers
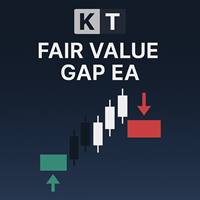
KT Fair Value Gap Robot automatically detects fair value gap formations using our Fair Value Gap indicator and trades them with the support of an advanced analysis module. Once set up, the EA runs independently, requiring no manual actions from the trader. If you trade fair value gaps, this EA is an essential tool. It eliminates the need for constant manual monitoring, helping you save valuable time while staying consistent with your trading approach.
Features
The EA only trades fresh fair valu
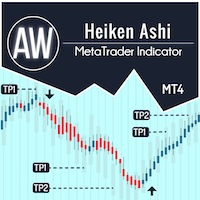
AW Heiken Ashi — Smart indicator of trend and TP levels. Advanced indicator based on classic Heiken Ashi, adapted for traders, with greater flexibility and clarity. Unlike the standard indicator, AW Heiken Ashi helps analyze the trend, determine profit targets and filter false signals, providing more confident trading decisions. Setup Guide and Instructions - Here / MT5 Version - Here Advantages of AW Heiken Ashi: Works on any assets and timeframes, Highly adaptable to the trader's style, Dynami
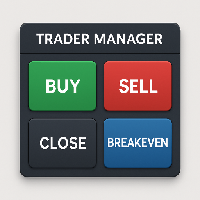
Trader Manager Panel for MT4 – Smart, Fast & Intuitive Trade Control Boost your trading efficiency with Trader Manager Panel , a compact and user-friendly trading assistant designed for MetaTrader 4. Whether you're a scalper, day trader, or swing trader, this tool gives you total control over your trades with one-click execution and risk-aligned automation. ️ Core Features: One-Click Trading Panel
Easily accessible UI in the top-right corner with buttons to Buy , Sell , Close All , and s
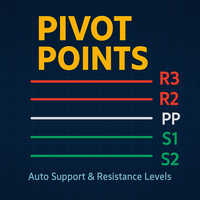
Pivot Points MT4 – Automatic Support and Resistance with Professional Accuracy Unlock structured technical analysis with Pivot Points MT4 , the ultimate indicator that automatically draws key resistance (R1, R2, R3) and support (S1, S2, S3) levels based on the previous day’s price data. Designed for traders who demand clarity, discipline, and a tactical edge in every session. What does this indicator do? Automatically calculates and plots daily Pivot Point levels. Clearly shows: Central pivot

XPairXpert EA is a versatile algorithmic trading solution designed to operate across all major forex and crypto pairs. While the default configuration is optimized for Gold (XAUUSD) , you can adapt it to other pairs simply by adjusting the settings. I will gradually release optimized .set files for additional symbols in the Comments section.
Recommended Timeframe:
Works best on M15 , but for lower drawdown preferences, consider using M30 or H1 . Minimum Capital Requirements:
Standard Setup (M1

Gold of the Incas is a highly effective trading advisor created specifically for the MT4 platform and focused on the gold market and major currency pairs. Using complex algorithms, it analyzes market trends and price fluctuations in real time, ensuring maximum profit with minimal risk. the full list for your convenience is available https://www.mql5.com/ru/users/pants-dmi/seller
The effectiveness of Gold of the Incas is confirmed by long testing periods, where it demonstrated outstanding res

AlgorithmXS is a revolutionary trading system that turns your chart lines into a powerful investment tool. Just draw – and the algorithms will do the rest. 18 years of expertise in one intuitive solution. After thousands of hours of testing, we have created something that will change your approach to trading. AlgorithmXS is not a robot, but your personal trading assistant that works on the "set and forget" principle. Why is this a revolution in automated trading? Earn money in 2 weeks
Nyou will

Magic Price Action – Advanced Candlestick Pattern Recognition by Mr Green76
Elevate your price action trading with Magic Price Action , an advanced MetaTrader 4 indicator that streamlines candlestick analysis through automated detection, deep customization, and an intuitive on-chart control panel. Stop manually scanning charts—let Magic Price Action do the heavy lifting with precise, real-time identification of key candlestick patterns based on your personal strategy. Key Features Intellig

MT4 Version : https://www.mql5.com/en/market/product/135726 MT5 Version : https://www.mql5.com/en/market/product/135727
Midas Touch – One Shot Precision for XAUUSD “Everything King Midas touched turned to gold.” Now it’s your turn to touch the market... and turn it into pure profit.
Mythology Meets Market Mastery Midas Touch EA is a one shot expert advisor designed specifically for XAUUSD on the M15 timeframe, combining the legendary precision of ancient wisdom with modern algorithmic power.

MRKD Vector — Smart Trade Management Utility MRKD Vector is a powerful and intuitive order execution tool designed for efficient manual trading in MetaTrader 5. Built with precision and speed in mind, MRKD Vector simplifies trade management by giving you full control over entries, stops, and targets — all from a sleek interface. Key Features: Quick Order Execution
Place trades with ease using a clean, fast interface built for active traders. Intuitive SL, TP, and Lot Size Control
Adjust sto

Black Swan Breakout EA – precise entries after low volatility periods Black Swan Breakout EA is a trading system for MetaTrader 4/5 that looks for breakout opportunities after the market has been quiet. It uses Bollinger Bands to detect price expansion and includes optional filters to confirm the strength and quality of the breakout. Added a couple of new features and Indicators like DeMarker, Fractals, CCI also days of the week to trade and a time filter too. Added the ability to use leverage a
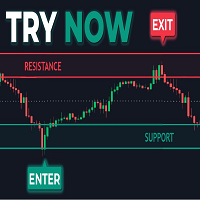
The Predictive Ranges indicator aims to efficiently predict future trading ranges in real-time, providing multiple effective support & resistance levels as well as indications of the current trend direction.
Predictive Ranges was a premium feature originally released by LuxAlgo in 2020.
The feature was discontinued & made legacy, however, due to its popularity and reproduction attempts, we deemed it necessary to release it open source to the community.
USAGE Figure 1 The primary purpo
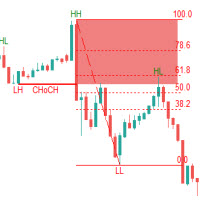
The Fibonacci Confluence Toolkit is a powerful indicator designed to highlights areas of interest where significant price action or reactions are anticipated, automatically applies Fibonacci retracement levels to outline potential pullback zones, and detects engulfing candle patterns.. This tool automates the detection and visualization of key market structures and potential reversal zones. Key Features: CHoCH Detection (Change of Character):
Automatically identifies structural shifts in marke

USDJPY Killer a powerful and unique expert advisor (EA) designed specifically for the USDJPY pair. Unlike most robots on the market that are hastily put together and sold to maximize profits from naive buyers, USDJPY Killer is built on a discretionary and psychologically sound approach to the market. This EA was not created to be a money-making product for mass distribution, but rather as a temporary release to raise capital for a larger goal: launching my own proprietary trading firm. Once
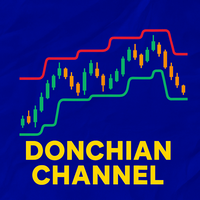
Donchian Channel – Customizable Indicator for MT4 This indicator draws the Donchian Channels cleanly and effectively, perfect for identifying breakouts, trends, and ranges.
Fully customizable – easily adjust colors, period, and line styles from the input settings.
Designed for both manual trading and as a base for automated strategies (EAs) .
Ideal for traders seeking a powerful, flexible visual tool to enhance their decision-making.

SmartBand is a powerful indicator designed to identify high-probability trade zones using a central reference line and dynamic upper and lower bands. When price reaches one of the bands,
and evaluates specific built-in conditions to trigger precise buy or sell signals — helping you spot potential reversals or breakouts with confidence. *Contact me after purchase for best guide* Key Features: Dynamic Band Structure : Central line with upper and lower bands adapting to price action. Smart

MFI Pulse Pro – Precision Money Flow Scanner Join the channel to stay updated: https://www.mql5.com/en/channels/forexnewadvisor
MFI Pulse Pro is a volume-powered momentum oscillator that leverages the Money Flow Index (MFI) to uncover real-time pressure shifts in the market. This tool is tailored for intraday traders, operating with precision across timeframes from M1 to M30 and compatible with all currency pairs, indices, metals, and synthetic instruments.
Core Features: MFI Period: Adjustabl
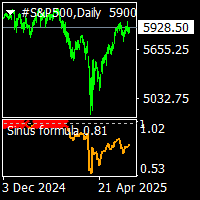
demo mode d value setled for gold. Sinus formula indicator non repaint trend indicator. it uses moving averages and sinus.. suitable for experienced trader and beginner. easy to use indicator. there is calibration constant d default d value setled for goldusd in demo backtest use only gold. d value can change acording to pairs. procedure is increase or lower d value acording to prices. when price top location increase or lover up to see red sign on level 1 when price bottom set d value blue sig

AlgorithmXR is a revolutionary trading robot that turns your $100 into a powerful investment tool using advanced algorithms. 18 years of expertise in one revolutionary product After 18 years of trial and error, thousands of hours of testing, and a million losing trades, we've created something that will change your trading forever. AlgorithmXR is not just an Expert Advisor, but your personal trading genius, working 24/5. Why is this a revolution in automated trading? Earn money in 2 weeks
Nyou
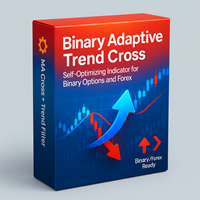
Binary Adaptive Trend Cross Self-optimizing indicator for binary options and Forex General Description The Binary Adaptive Trend Cross indicator is designed to accurately identify market entry points based on moving average crossovers with additional trend filtering. It displays signals as arrows ( blue for buy, red for sell) and supports alerts. Key Features:
Automatic parameter optimization for current market conditions
Trend filter to reduce false signals
Flexi

attenzione: in prevendita e' proposto a 97 USD mentre da sabato 7 giugno 2025 passera' a 197 usd o 287 usd senza altre notifiche. TRADEX AI Imagine being able to avoid the cost of slippage on every TRADE! It is an unavoidable cost that is applied to almost every trade executed at market prices. The term “slippage”, literally “slippage”, describes the difference between the order price and the execution price of a trade, on average it is 1 pip or 10 basis points but sometimes it is higher.
TRAD

GoodNess EA for MT4 – Smart Scalping. Strong Trends. GoodNess EA is a professional-grade Expert Advisor for MetaTrader 4, designed for traders who demand precision, stability, and consistent returns . It expertly combines fast-paced scalping with trend-following strategies , making it a versatile tool for both sideways and trending markets. Whether you're trading during quiet sessions or high-impact news releases, GoodNess adapts and performs with exceptional reliability. Core Strategy Trend

BBMA Oma Ally is a trading strategy that combines Bollinger Bands (BB) and Moving Average (MA) indicators developed by Oma Ally. This strategy is known for its high entry accuracy, low floating time, and the ability to make multiple entries.
Elaboration: BBMA Oma Ally: This strategy was developed by Oma Ally, a trader from Malaysia. The name "BBMA" comes from the Bollinger Bands and Moving Average indicators used.
BB and MA Indicators: Bollinger Bands are used to identify volatility and trend

Ultimate Fibonacci EA & Trade Assistant + Manager - With Advanced Pattern Recognition In trading, as in any craft, mastery requires the right tools. In Fibonacci based trading, The Ultimate Fibonacci EA is that tool. Discover the power of precision trading with the Ultimate Fibonacci EA, an innovative Expert Advisor (EA) for the Forex market. This advanced tool is designed to work in harmony with your Fibonacci retracement tool, providing dynamic responses to market movements and pattern recogn

Japan AI Exo Scalp EA MT4 v3.54 Next-generation scalping EA that combines the latest GPT-4.5 technology with Japanese financial engineering.
Realizes OpenAI integration via WebRequest communication in MT4 environment, providing safe and high-speed automated trading without DLL. The long-awaited MT4 version is finally here! The MT4 version, requested by many traders, is now released.
Following the "Three Arrows" logic implemented in the MT5 version, it has evolved further along three axes: accura

MultiSenseEA is an Expert Advisor that allows users to freely combine multiple indicators to create their own personalized strategy. MultiSenseEA enters trades based on the consensus of the selected indicators and additional filters such as breakout, RSI, ADX, news, and various other risk management functions. It features a visual information panel that keeps users informed of all necessary details, and it displays the win rate so users can easily compare different indicator strategies.

This expert advisor uses price action and time trading analysis. Use settings SL=1000, TP=3000 are suitable for the gold/xauusd market Timeframe H4 will only open 1 fixed lot position with a risk reward of 1:3 your account will grow safely. Does not use dangerous strategies such as martingale, grid, hedging or layering etc. The minimum capital to use it is $100 for lot 0.01 low spread/zero spread account type is better
Technical Specs: Pair: XAUUSD (Gold) Timeframe: H4 Platform: MT4 Minimum Dep

osasFXea Ultimate PRO Gold Titan Dominate Gold Trading with osasFXea Ultimate PRO Gold Titan! Unleash your trading potential with osasFXea Ultimate PRO Gold Titan – a limited-time offer for the first 30 buyers! This formidable MetaTrader 4 (MT4) Expert Advisor (EA), tailored for XAUUSD (Gold), comes bundled with the exclusive Ultimate Income Indicator , delivering unmatched precision and power for high-volume traders. Optimized for bold strategies, Gold Titan executes trades with lightning speed

Enhanced QPI Dashboard Indicator Professional Multi-Signal Trading System with Premium GUI Interface Overview The Enhanced QPI Dashboard is a sophisticated technical analysis indicator designed for MetaTrader 4 that combines multiple proven trading signals into one comprehensive system. This professional-grade indicator features a real-time dashboard interface that monitors market conditions and generates high-probability trading opportunities through advanced multi-timeframe analysis. Key

MRPHN Overdosed is a trend-following Expert Advisor built for XAUUSD , powered by a custom Supertrend indicator : iMRPHN (included for free). It combines simplicity and flexibility, offering optional Martingale logic, configurable risk settings, and time-based trading filters — ideal for traders who prefer a set-and-forget approach.
Tested on : XAUUSD
Strategy : Trend-following using iMRPHN indicator
Trade Timing Control : User-defined trade start & end time
Take Profit / Stop Loss : Fully con

Atomic Fair Value Gap (FVG) Indicator v1.10 TRADING AUTOMATION EXPERTS - MT4 tools designed to enhance trader performance. ______________________________________________________________________________________________________________________________________________________________________________________
Say goodbye to the hassle of manual FVG identification. Our FVG indicator does the heavy lifting, pinpointing potential trades setups so you can focus on precise entries, Stop Loss and Take Pro

EchoTrade Local Trade Copier – Fast, Reliable, and Built for Seamless Account Management
Download free demo here to test with EURUSD trades on demo accounts
Read installation guide here
Copy Trades Like a Pro — Instantly, Accurately, and Safely Tired of juggling multiple MetaTrader accounts manually or missing trades between platforms? EchoTrade Local Trade Copier solves that — giving you a seamless, ultra-fast, and customizable trade replication system between MT4 and MT5 terminals

Source code available text me immediately:Pythonfx18@gmail.com Price:$677
"MM 3.0 FLIP CODEPRO IS DESIGNED TO MULTIPLY YOUR CAPITAL UP TO 300 TIMES OR MORE A WEEK ON SMALL ACCOUNTS USING 1:UNLIMITED THIS POWERFUL TRADING ROBOT CAN TURN SMALL INVESTMENTS INTO MASSIVE RETURNS DEPENDING ON MARKET CONDITIONS"
"WITH JUST $100 FOR FORISTANCE YOU HAVE THE POTENTIAL TO GENERATE $30 000+ IN A SINGLE WEEK....BASED ON OUR EXPERIENCE CONSTANT CONSISTENT PROFITS WITHIN 7 TRADING DAYS DAYSARE ACHIEVAB
Signal Zero – Multi-Dimensional Momentum Oscillator Join the channel to stay updated: https://www.mql5.com/en/channels/forexnewadvisor
Signal Zero is a momentum-based oscillator designed to help traders identify shifts in market sentiment through multi-layered analysis of moving averages, signal crossovers, and zero-line momentum transitions. The indicator is highly responsive, making it suitable for all timeframes and instruments, from scalping in M1 to long-term trend trading on D1 and beyond
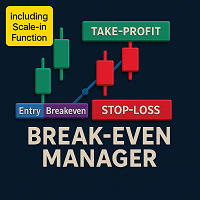
Whether short-term or long-term, you will eventually need to secure your position. The more positions you have open, the more difficult it becomes to calculate the breakeven point. That’s where the Break Even Manager comes in — it calculates your average price for you in milliseconds and sets your stop loss to breakeven. Depending on your strategy, you can choose the profit buffer distance. Try it out now !

Golden Panther is a trend indicator that shows the beginning and end of a trend. The indicator is designed specifically for trading gold and silver, but also works with other financial instruments. When a trend begins, the indicator draws an arrow in the direction of the trend and colors the candles until the trend ends. The indicator does not lag or redraw. I recommend using the M30, H1 timeframe.

TW Scalper Robot MT4 : A Professional Scalping Expert Advisor :
Are you looking for a professional solution for quick and smart profitability in the gold market?
TW Scalper Robot, a specialized scalping bot, combines 3 advanced indicators and precise trading algorithms to help you become a true trend hunter. With advanced risk management strategies, this robot executes your positions with complete protection.
Key Features of TW Scalper Robot:
1- Only One Position at a Time: Focuses on a si

Overview
Fractal EMA Smart Reversal EA is a powerful Expert Advisor that smartly combines the Fractal indicator and Exponential Moving Average (EMA) to detect high-probability reversal zones. The EA ensures trades are placed only when the price is at a configurable distance below or above the EMA , aligning with oversold (for buy) and overbought (for sell) conditions. Key Features Fractal Signal-Based Entries
Trades are triggered by valid Fractal patterns to detect local market tops and bot

Zone Hunter – Breakout and Re-Entry Range Signal Indicator Join the channel to stay updated: https://www.mql5.com/en/channels/forexnewadvisor
Zone Hunter is a smart price action indicator that identifies breakout signals and potential re-entry opportunities based on adaptive price range zones. It helps traders spot moments when price pushes beyond dynamically calculated support or resistance levels and then pulls back to offer additional entry chances.
Core Concept Includes: Calculation of dyn

SMC Trading Indicator - Smart Money Concepts Analysis Tool Market Structure Analysis Indicator Based on Smart Money Concepts This MT4 indicator implements Smart Money Concepts (SMC) methodology to analyze market structure and identify key price levels. The tool visualizes institutional trading concepts on your charts for educational and analytical purposes. Key Features Analyzes institutional money flow patterns based on SMC methodology Displays potential buy/sell zones according to market struc
BinaryProfitFilter analyzes the historical effectiveness of trading signals and displays only signals that meet the specified profitability level. Suitable for binary options, Forex, and stocks. Main Parameters Parameter Default Value Description IndicatorName "Your Indicator" Name of external indicator BuyBuffer 0 Buy buffer index SellBuffer 1 Sell buffer index SignalCount 3 Number of signals analyzed for profitability TargetProfit 60.0 Target profitability percentage ShowProfitability true D

Buy 1 get 1 free
how each of these input fields is used and what happens on your chart when you adjust their values: Custom text for comment : How to use : Type any text you want into the "Value" field. Result : The text you type will appear in the top-left corner of the chart window (known as the Chart Comment). You might use this for the indicator's name, version, or your own short notes. Lookback period for regression calculation : How to use : Enter an integer (e.g., 100, 200, 300). Result
The MetaTrader Market is the only store where you can download a free demo trading robot for testing and optimization using historical data.
Read the application overview and reviews from other customers, download it right to your terminal and test a trading robot before you buy. Only on the MetaTrader Market you can test an application absolutely free of charge.
You are missing trading opportunities:
- Free trading apps
- Over 8,000 signals for copying
- Economic news for exploring financial markets
Registration
Log in
If you do not have an account, please register
Allow the use of cookies to log in to the MQL5.com website.
Please enable the necessary setting in your browser, otherwise you will not be able to log in.