Watch the Market tutorial videos on YouTube
How to buy а trading robot or an indicator
Run your EA on
virtual hosting
virtual hosting
Test аn indicator/trading robot before buying
Want to earn in the Market?
How to present a product for a sell-through
Expert Advisors and Indicators for MetaTrader 4 - 114
TopTrade EA is a fully automated trading system that uses a martingale strategy based on account balance, designed for traders who prefer a straightforward and scalable approach. Easy to use – Just drag it onto a chart and press "OK" to start. Recommended minimum balance: 10,000 units (in your account currency) to support the strategy’s risk model. Trades are calculated based on current account balance , adapting to your capital level. Backtest it thoroughly to understand the behavior, and
TopTrade EA is a fully automated trading system that uses a martingale strategy based on account balance, designed for traders who prefer a straightforward and scalable approach. Easy to use – Just drag it onto a chart and press "OK" to start. Recommended minimum balance: 10,000 units (in your account currency) to support the strategy’s risk model. Trades are calculated based on current account balance , adapting to your capital level. Backtest it thoroughly to understand the behavior, and
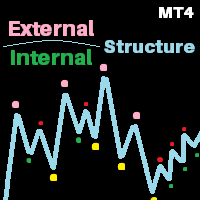
Here is the V3 of perfect market structure. Whats new? Coded based on ICT rules. No more trend confusions...-- Added labels to show current trend No more timeframe juggling and missing out important points, -- Now You can add indicator multiple times to mark multi timeframe market structure on the same chart window( 1D market structure on 4H or may be 4H market structure on 15 min timeframe and more.....) No more waiting in large range as sometimes market makes huge ranges and starts making im

System Introduction: The EA uses a peak-bottom detection system based on price action and trend-following to achieve a high win rate. It is also integrated with a capital management mechanism to handle strong counter-trend situations. Profit rate: 10% ~ 20% per month. Advanced Features: Autolot : Automatically manages order sizes based on account balance. TIME TRADE : Manages trading time. ACTION PROTECT SETTING : Protects the account when the drawdown exceeds the allowed limit. On-screen contro

This EA identifies market trend direction based on slope detection (e.g., angle or directional movement of price). Upon confirmation, it opens a series of positions in the trend direction. If the market moves against the initial order, the EA places additional trades based on spacing or price deviation, following a controlled multi-order logic. Key Features: Trend slope detection for entry signals Opens multiple orders based on price movement Designed for EURUSD, optimized on the H1 timeframe Us
Magic Number Monitor Expert Advisor Description The Magic Number Monitor is a sophisticated Expert Advisor designed to track and analyze the performance of multiple trading strategies by monitoring magic numbers and symbols. This powerful tool provides real-time performance metrics for each magic number-symbol combination, allowing traders to effectively manage and evaluate multiple strategies simultaneously. Key Features Performance Tracking Multi-Strategy Monitoring : Tracks multiple magic num

Ultimate Trend Rider
Ride the markets with confidence — your all‑in‑one trend‑capturing powerhouse.
Key Features & Benefits Adaptive Multi‑Filter Engine
Combines Supertrend, ADX, ATR volatility, and volume filters to ensure you enter only the strongest, most reliable trends. Multi‑Candle Confirmation
Eliminate “false start” signals: require multiple consecutive closes above/below your trend line before triggering an entry. Customizable Take‑Profit Alerts
Three levels of RSI‑based “TP” mar

Patrex Pro: Maximize Your Trading Potential Patrex Pro is an advanced trading bot designed to help traders optimize their trading strategies and maximize their potential returns. With its cutting-edge technology and user-friendly interface, Patrex Pro is the ultimate tool for traders seeking to elevate their trading game. Get MT5 version Key Features: 1. Position Hedging: Patrex Pro allows users to hedge their positions based on their individual risk tolerance and market analysis. 2. Advanced R

The Multi Timeframe Candles indicator is a powerful visualization tool designed to help traders align their lower timeframe analysis with higher timeframe structure. By plotting candles from a selected higher timeframe (H1, H4, D1, etc.) directly on your current chart, this indicator gives you a clearer perspective of the overall market narrative without switching charts.
Who Needs This Indicator? This tool is ideal for: Smart Money Concept (SMC) / ICT Traders who rely on higher timeframe

Reliable & Steady EA Now Available!
Grow your capital steadily by securing small daily profits — no stress, no hype. This EA uses a simple yet effective breakout strategy , entering trades when the high or low of a few candles ago is breached. It follows the market’s momentum with precision and discipline. Strong Risk Management Built In Every trade is protected with clearly defined Take Profit (TP) and Stop Loss (SL) If SL is hit, the EA retries with increased lot size — but only up to

EA product "Moon light"
- Intended for short-term operation of about 1 to 2 weeks - Set target amount by "Shutdown target profit" and close position and stop operation when it is reached - No TP is set and profit is confirmed only by trailing stop of SL - Entry point is determined locally as follows - Average 7 DOWN < Buy_differential - iOpen DOWN DOWN DOWN UP > Buy_differential2 = BUY - Average DOWN DOWN UP > Buy_differential2 = BUY - Mid price 2 step 6 UP < sell_differential && iHigh(1) > cu

Meta trader 4 Slalom Scalper welcome to my instrument for Long and short rapid pro scalping
imagine taking a trade and hitting your stop loss.. sad.. but with the slalom scalper that trade will revert itself to a reversed position and try to hit the TP
the slalom also can open both buy and sell position on the same signal hedging you on every top or new bottom
just try and see how every breakout becomes a signal
EUROGEDDON EA – Unmatched Performance with Controlled Risk EUROGEDDON EA is a 100% automatic Expert Advisor powered by ADAPTIVE INTELLIGENCE , designed to help small accounts grow steadily while keeping total control over your capital. With a lot size of 0.01 for every $200 in your account, it operates with very low risk and delivers minimal drawdown , showing an exceptional performance that you’ll want to see for yourself. Download the demo version and test it live. Don’t rely solely on

MTRade is a professional arrow indicator based on the classic Parabolic SAR algorithm. It automatically detects the moments of trend direction change and displays clear signal arrows on the chart: up (buy) and down (sell).
Basis: original Parabolic SAR algorithm with full adaptation for visual display by arrows;
Signals: up arrow — possible up reversal (buy); down arrow — possible down reversal (sell);
No redrawing: signals are recorded only after a confirmed reversal, excluding "jumps" and

iMRPHN: Supertrend & Swing Reversal Indicator A trading indicator that integrates Supertrend zone detection with swing-based entry logic. Designed for traders who apply both trend-following and counter-trend approaches. The indicator works across multiple timeframes and offers several helpful visual and alert-based features. Key Features: Automatic identification of swing high and swing low levels Automatic Fibonacci retracement Supertrend reversal zone visualization in real-time Highlights are

Introduction: This EA works in two ways: opening a position for each candle included in the candle according to the color of the configured candle or opening a position for each candle included in the opposite candle according to the color of the configured candle. You do not need to analyze the market. You select the desired timeframe, set it, and leave the EA running. The EA will do everything for you. The results are better if the market is trending. You do not need to make assumptions or an

MA TITAN EA – Automated Trading Robot for MetaTrader 4 NEW VERSION IS LIVE ! MA TITAN EA is an automated trading robot for MetaTrader 4 based on a strict SMA strategy and risk management parameters on the daily timeframe (D1) .
Designed by finance professional with over 10 years of experience in brokerage house , this robot combines institutional rigor with ease of use .
Key Benefits No martingale or grid strategies No complex optimization required Compatible with all MT4 brokers

The Time Zone indicator allows users to set specific time periods for major trading sessions (Asian, European, North American) and display them with distinct colors on the chart. Users can choose how many days of trading zones to show, set the start and end times for each session, and define the color to represent each trading period. The chart refreshes at user-defined intervals to ensure the time zone data is accurate and current. Key Features: Display Trading Zones: Users can choose to
UNIQUE FEATURES FROM POWERFUL Automatically detect new orders (Buy/Sell/Limit/Stop) and send detailed notifications:
Order price, volume, SL/TP
Risk/Reward (RR) ratio
Maximum % error on account
Notification when closing orders:
Profit (USD & %), number of pips achieved
Command time (hours/minutes/seconds)
Reason for closing (SL, TP or manual)
Check information errors:
Automatically warn when volume rules are wrong (min/max lots/steps)
Calculate margin and prevent trading if i
The Double Reaper bot is a trading robot with multiple strategies, and you can use any single one at a time. However you can also use any two of them together to better refine your entries and add confluence. Its entry conditions are RSI - If you select this strategy, it would only take a buy when your preferred RSI period crosses above the oversold level and closes above. And vice versa for sell. You can also set how many candles should pass after the close above the oversold level incase of a

"Fibo Pending EA is an Expert Advisor that places pending limit orders based on Fibonacci levels. You can configure it to enter orders according to specific Fibonacci levels. For any level that you don't want to use, simply set its value to zero (0). Once the EA has placed all pending orders, please remove the Fibonacci object from the chart. The various 'Close' buttons on the chart will trigger a pop-up confirmation before closing orders. If you don't want these confirmation alerts, you can dis

The trend indicator processes each bar of the chart and displays signal arrow on it. In the default display settings: red arrow - sell signal blue arrow - buy signal If the arrows are missing on some bars, this means that the algorithm has not identified a consensus on the signal on this bar. The indicator does not have any technical settings for the algorithm. The process of finding a consensus is fully automated.
For ease of visualization on charts, user settings allow you to set the size of

Friends, this tool does not work in backtesting and you must run it live. Chat Ai assistant
a versatile and intelligent AI assistant
Talk to the AI, get advice from it, give it orders
Can be used in all charts, time frames, symbols, markets and...
With a very simple interface
This tool is an artificial intelligence assistant that you can chat with.
You can give him different commands. for example:
Tell him to open a buy order for you.
Or tell him to close your sales deals
Or tell it to change

The Quasimodo Pattern Indicator is no more difficult than the Head and Shoulders. Still, only a few traders know about it, and some even confuse one with the other. However, this is not a reason to avoid this tool in your forex trading strategy. Features: Automatic Detection: The indicator automatically scans for valid QM patterns across any timeframe, reducing the need for manual chart analysis. Visual Highlights: Clear and customizable on-chart drawing of shoulders, heads, and breako

Get the EA for FREE Just sign up and use my broker.
Broker Link : https://fbs.partners?ibl=684451&ibp=26113188
Setfile Here : https://drive.google.com/file/d/1IetLj8ZC-AehDXQLJCTYfWGn3GB4JgqU/view?usp=sharing
MT5 Version Here : https://www.mql5.com/en/market/product/136467 XAU Marti
The Smart Choice for Gold & Forex Traders - Profit Potential! Why This EA Stands Out: RSI-POWERED ENTRIES - Combines the reliability of RSI indicators with advanced money management for high-probab
SLTPauto Expert Advisor SL$TPauto automatically manages Stop Loss (SL) and Take Profit (TP) levels for all trades on a specific symbol. This Expert Advisor scans whatever chart it's placed on and works based on that chart's symbol, functioning independently across multiple charts simultaneously. Key Features: Automatically places Stop Loss (SL) and Take Profit (TP) for all open trades on the current chart symbol Applies the same Stop Loss (SL) and Take Profit (TP) settings to any new trades as

The Alive Gold MT4 Expert Advisor is an automated trading tool designed for Forex, with a special focus on XAUUSD, optimizing profits while minimizing risk. Working 24/7, it analyzes data, executes trades based on programmed strategies, and manages multiple accounts. Key features include automated trading, objectivity, and fast market response. Market knowledge is required for optimal use. the full list for your convenience is available https://www.mql5.com/ru/users/pants-dmi/seller
Alive Gold
This Ea. is very unique in his function, and not designed to be traded automatic. as the first option. It is a tool designed to be used by a mild experienced Forex trader that can: Trade manual or automated and can try to find a good entry price levels Trader that can enter the market using market or pending orders at specify price levels. Please watch the video about using the excel calculator when using the breakeven technic . The same idea used for the breake

Gold Strength Index Pro (GSI Pro) is an indicator designed to analyze gold's strength across multiple currency pairs. It aggregates weighted price data from 7 XAU pairs (e.g., XAUUSD, XAUEUR) over a user-defined lookback period, calculating a composite strength value.
Key features include: Color-Coded Histogram : Displays bullish (green) and bearish (red) - momentum based on a threshold zone (±0.2 default). Smoothed Lines : A gold-colored EMA (SmoothPeriod) reduces noise, while a DodgerBlue s

The indicator is based on the calculation of liquidity on the market and thus shows where the market can most likely turn.. It shows the places of liquidity where the price will reach sooner or later... The indicator can be set to several types of liquidity and therefore can display several levels on the graph.. It is a unique tool that can help you very well in your trading The indicator is suitable for currency pairs with the most liquidity (Forex,EURUSD,GBPUSD...) The indicator is suitable fo

Introducing my new Expert Advisor BitcoinRobotTradingEA, This EA uses the concept of following trends in conducting market analysis , that way it milks the entire trade setup on the trend . Analyzing market trends with precision while entering transactions, this EA also considers the Orderblock zone along with the orderflow of the market which makes the analysis more accurate which is why this Expert advisor is considered one of the best product in the financial market . The algorithm used in de
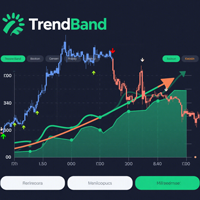
TrendBand Navigator Pro – Non-Repainting Multi-Timeframe Trading System
Powered by proprietary multi-dimensional trend band algorithm delivering clear arrow signals Big Arrows Define Direction Small Arrows Capture Entries Core Advantages
Intelligent Noise Filtering
Volatility-adaptive technology avoids false breakouts, triggers arrows only during strong trends Multi-Timeframe Compatibility
Automatically adapts from 1-minute to monthly charts for all trading strategies Vis

Bitcoin and trading robots are a powerful combination for making profits, but both require a deep understanding of the market, risk management, and preparedness for volatility. Trading robots are not an “instant rich guarantee”, but rather an effective tool when used with a tested and disciplined strategy. Always do your research and start small! BTC DEEP AI is a forex robot that is specifically used on BTC and has resistance to high movements and provides consistent profits. equipped with AI

Product Name A arca Main Features Automatic Identification of Critical Zones
A arca automatically detects and highlights support and resistance levels, making it easier to identify potential entry and exit points. Clear Entry and Exit Signals
Displays buy and sell markers, helping traders define optimal points to open or close positions and improve trade decision-making. Multi-Timeframe Analysis
Integrates data from different chart periods (M5, M15, H1, etc.), enabling the detection of confl

EA is specifically designed for trading gold (XAUUSD) on the 1-minute (M1) chart. Perfect for traders who demand speed, precision, and smart risk control in their scalping strategies.
Recommended Settings • Symbol: XAUUSD • Timeframe: M1
Important Notice Trading involves risk, and past performance does not guarantee future results. It is essential to test any EA on a demo account or with a small live position before committing larger capital. Market conditions may vary, and proper risk manage

Tento jedinečný indikátor vám ukazuje rozsah, v ktorom sa pohybujú maloobchodní klienti. Spravidla, ak sa cena udržiava na priemernej úrovni, neskôr dosiahne vrchol a potom sa vráti na opačnú stranu. Indikátor je vhodný pre všetky grafy s možnosťou nastavenia pákového efektu, teda ak zoberieme do úvahy, že retailoví klienti sa pohybujú na trhu s pákovým efektom 500 až 100 páka. Indikátor je vhodný pre väčšie časové rámce H1,H4... s väčšími pákami 100,50,25 ale aj pre malé grafy M5,M15 s pákami

ZoroFX EA MT4 - Smart Risk Management Trading Tool ZoroFX EA is a powerful pending order tool for MT4 designed to help traders manage risk effectively and execute precise entries. Key Features: Custom Risk Range: 1% to 90% Risk Reward Ratio setting Supports all pending order types: Buy Limit, Sell Limit, Buy Stop, Sell Stop Auto lot size calculation based on risk Auto Take Profit & Stop Loss levels Close All Orders button Simple and user-friendly interface Clean visual panel with real-time input
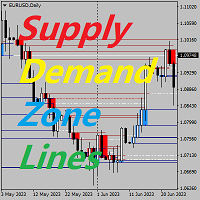
Supply Demand Zone Lines Indicator Background The system automatically searches for supply and demand zones in the Chart and draws real-time key price lines. Traders can trade according to the price trading lines. Main Features The system automatically searches for supply and demand zones. The system also draws real-time key price lines. Traders can trade according to the price trading lines. Therefore, traders who use the supply and demand zone strategy no longer need to spend time looking for

It is so similar as "waka waka" EA, but upgraded, with less risk and more profit. Pyramid and martingale. Using RSI BB. Minimum amount of deposit that you can start is 500$ and can choose 3 different risk management to risk 500$, 1000$ or 1500$ drawdown of your balance (not active on test version). Test version works on 1h candle, but its for copyright, main EA works on 15 mins, more accurate, better risk and profit than test version. Test version works just for AUDCAD (2016.1.1 - 2025.1.1) b

GoldenHawk EA is an Expert Advisor developed for trading gold (XAU/USD).
It combines multiple strategies, including Price Action and technical indicators such as Moving Average, Bollinger Bands, and Parabolic SAR, to support trend analysis and entry point identification.
EA Setup Details Working trading pairs: XAUUSD, GOLD Timeframe: H1 Min deposit: $200 Min leverage 1:100 Works with any broker, though an ECN broker is recommended

Bot EMA Starter – 5 Filtros
(Factor de beneficio: 1.50 | Drawdown: 5.07% | Backtest de 10 años)
Este Asesor Experto es ideal para aprender trading automatizado o como punto de partida para desarrollar estrategias personalizadas.
Los resultados muestran su potencial, pero este EA fue diseñado principalmente como una herramienta educativa para profundizar en tu comprensión, adaptarlo a tus necesidades o evolucionarlo hacia algo más avanzado .
️ AVISO LEGAL: Operar conlleva riesgos. Este EA

ProMartingale EA – Automated Martingale Strategy with Risk Control
Experience precision trading with ProMartingale EA , a meticulously designed MetaTrader 4 Expert Advisor that combines the power of Martingale strategies with disciplined risk management. Ideal for traders seeking automated recovery systems, this EA has been rigorously tested on M15 timeframe with default settings to balance aggression and stability. Key Features Martingale Automation : Doubles lot sizes sequentially to re

Belladonna is an advanced custom technical indicator for MetaTrader 4 based on Hull Moving Average (HMA). It visualizes the trend direction using colored lines and arrows on the chart. The indicator is optimized to minimize lag and eliminate market noise, making it especially useful for short-term and medium-term trading.
Functions and Features: Moving Average Type: Hull Moving Average (based on two EMA/SMA lines).
Calculation Methods: Support for different types of moving average (SMA, EMA,

Overview Live Signal MT5: Click here
Signal Start Date: 3. 27, 2025
balance: 300$ / Brocker: XM Ultra Micro Account/ Entry: 0.1 lot AutoLot , Balance per : 450 / Setting : Default Next Price 599$ (after 9 copy)
Conflux EA is an expert advisor (EA) designed to analyze the market’s complex movements and execute intelligent trades accordingly. This EA is specifically tailored to adapt to market conditions using EA, particularly in assets like gold (GOLD), Bitcoin (BITCOIN), and o
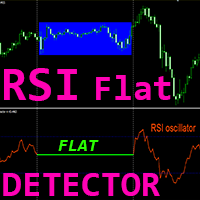
Crypto_Forex Indicator "RSI FLAT Detector" - is an efficient auxiliary tool in trading! No Repaint. I offer you to upgrade your trading methods with this great indicator for MT4.
Indicator shows price Flat areas on the chart. It has "Flat sensitivity" parameter - which is responsible for flat detection. "RSI FLAT Detector" can be used for Price Action entries confirmation or in combination with other indicators. You can use it for trend following systems to detect flat zo

A scalper trading advisor with an innovative method for calculating the opening of trading positions. The robot is designed for high-frequency trading with MT4 terminal instruments. The expert controls the volume of trading positions, spread expansion, and slippage. Can be used on any time frame, with any deposit size. Easily optimized and configured for the desired instrument. You can use preset settings. Recommendations for using the expert
Initial deposit from 100USD.
Brokers with normal exec

Elevate your professional gold trading experience with Envelopes XAU!กลยุทธ์ Envelopes Indicator ที่ปรับแต่งมาอย่างพิถีพิถันสำหรับ Day Trade และ On Trade โดยเฉพาะ พร้อมความแม่นยำที่พิสูจน์แล้วในตลาดทองคำในกรอบเวลา 1 ชั่วโมง High Precision: Utilizing a smart Envelopes Indicator technique to effectively filter signals for optimal market entry and exit. Continuous Trading: Designed to support both daytime trading and on-the-fly execution (On Trade) so you never miss an opportunity at the perfect

Symbol Information The Symbol Info indicator provides an intuitive panel on the chart that displays essential information about the current trading symbol. This includes basic trading data, instrument properties, and trading rules, all designed to give traders a clear view of the market conditions and product specifications. Key Features: Symbol Name and Description:
The indicator displays the name and a detailed description of the current trading symbol, helping users identify the instrume

Quant Terminal is an advanced multi-symbol auto-trading expert advisor as well as market sentiments dashboard with sophisticated algorithmic approach. Quant Terminal is working on strength and sentiments of individual currencies and that is what drives the Forex Market. Catch is to get the pairs where currencies are getting stronger or weaker using thorough Quantitative Analysis of the market on sentiments, speed, volatility and more to get deeper understanding of what is the actual Market Stru

RED SHARK EA – Smart, Ruthless, and Built to Hunt Shorts
Red Shark is a sell-only trading system designed specifically for EURUSD on the H1 timeframe. Based on a layered parabolic mesh logic with adaptive spacing and dynamic recovery, this EA thrives in bearish or ranging markets by capitalizing on micro-movements and pullbacks.
Originally launched as "WiT", the core logic has been refined and reborn under a more aggressive identity: Red Shark. It enters only SELL positions and adapts

PinBar Hunter – Smart Pin Bar Indicator with Built-in Control Panel and Signal Filters PinBar Hunter is a powerful tool for technical traders that automatically detects classic Pin Bar patterns (reversal candles) on the chart.
It’s designed for price action strategies, candlestick analysis, and trading around key support/resistance levels. Indicator Features: Detects classic Pin Bars (reversal candlestick patterns)
Works on any timeframe and instrument
Suitable for trend-following an

MT4 Version : https://www.mql5.com/en/market/product/133603 MT5 Version : https://www.mql5.com/en/market/product/133604
Lazy Trader EA – Smart Trading Like a Legendary Trader Lazy Trader is an automated Expert Advisor (EA) inspired by the philosophy of a legendary trader – “Let the market work for you, not the other way around.” With a relaxed yet intelligent approach, this EA combines Averaging and Hedging strategies in one integrated system, equipped with dynamic pipsteps to adapt to changin

Certo! Ecco una versione aggiornata e leggermente più sintetica della presentazione per IA SUPREME MT4Hedging 2.0GOLD , che include la nuova funzionalità e un tono promozionale efficace: IA SUPREME 2.0GOLD – L’evoluzione del tuo trading La nuova versione GOLD è qui: più intelligente, più reattiva, più sicura.
Partner’s Academy presenta IA SUPREME MT4Hedging 2.0GOLD , l’Expert Advisor che unisce precisione e gestione avanzata del rischio con un’analisi dinamica della volatilità di mercato

• Please test the product in the Strategy Tester before purchasing to understand how it works.
• If you face any issues, contact me via private message—I’m always available to help.
• After purchase, send me a screenshot of your order to receive a FREE EA as a gift.
Hedge & Position Commander The Hedge & Position Commander is an advanced trading utility designed to give traders complete control over their positions with powerful hedging capabilities and comprehensive position management to

• Please test the product in the Strategy Tester before purchasing to understand how it works.
• If you face any issues, contact me via private message—I’m always available to help.
• After purchase, send me a screenshot of your order to receive a FREE EA as a gift.
Introducing the ultimate Trade Management Panel designed to streamline your trading operations and boost your efficiency! Our advanced panel is packed with powerful features to simplify your trading tasks and provide real-t

YenMaster Seven EA
YenMaster Seven is a powerful automated trading expert advisor designed exclusively for the USD/JPY currency pair. It integrates 7 distinct trading strategies , each optimized to perform under various market conditions. Every trade is protected by a predefined stop loss and guided by a dynamic take profit mechanism that adapts to price action. With over 20 years of historical backtesting , YenMaster Seven offers a reliable and resilient approach to navigating the forex marke
Dragon shogun trader ea is super mt4 trading bot it help you to make good profits you can use foe forex pairs and gold and you can adjust only tp and sl in pips and it will automatically open orders as per risk and account balance also you van control how many number of orders to trade . it has many strategies like trend follow strategy , and scalping and grid and martingale it works on all time frames

Turbo Next is a high-performance trading bot for the Forex market, designed to automate trading strategies and adapt to the ever-changing market conditions. This tool utilizes advanced algorithms to process market data, allowing it to automatically identify optimal entry and exit points, minimizing human error and improving trading results. Key Features of Turbo Next : Support for Multiple Currency Pairs : Turbo Next works with a wide range of currency pairs such as EURUSD, GBPUSD, USDJPY, AUDU

Prop Firm Drawdown Guard EA – Documentation
Version: 1.00 Platform: MetaTrader 4 (MT4) Author: Branko Balog Website: https://www.mql5.com
️ Purpose This Expert Advisor (EA) is designed to enforce drawdown limits required by prop trading firms. It helps traders stay compliant with daily and total equity loss rules by automatically:
- Monitoring account equity in real time - Closing all open trades when limits are exceeded - Blocking all further trading activity for the rest of the day - Opt

Best quick Scalper all logic already calculated and takes profit automatically. Uses automatic lot size and opens to roughly available margin both market and pending orders. Use with min 500 account balance. Contact me or purchase one of my other apps for more features. Uses RSI, MACD, Stoch's, Bollinger, MFI, A/D, and ATR for trade logic. Already implemented all the settings no need for inputs.
Supply demand zone with added Alerting system. Why this supply demand indicator is different? Zones are not traditional zones. these are KIRI zones. these are high probability zones where market reacts no matter how much. Most people including me have been missed out of trade because we somehow got distracted. no worries, i have added an alert to our zones now. (Metatrader doesn't show alerts in strategy tester) Most people dont know when to enter the market when it comes to zone based trading.

This EA is a grid-based trading system. It incorporates several advanced features to manage trades dynamically and adapt to market conditions. Here's a summary of its functionality: I am happy to provide my settings file. Recomendation would be to run on a 20 000 cent account. Key Features:
1. Grid Trading Strategy: - The EA uses a grid-based approach to open buy and sell trades at predefined price intervals. - It dynamically adjusts the grid levels based on market conditions and risk se

Back and Forth is a SWING –based trading advisor. Trades on a single order. There is an INVISIBLE StopLoss and TakeProfit . When the profit set in the settings is reached, the order is closed and starts over from the initial order. If the order closed in a plus, but did not reach the BALANCE ( Balances + PROFIT ), then the next order is reduced by ( IF THE PROFIT IS, THEN REDUCE ) - in the settings, until it comes out of the drawdown into profit! If the price goes against the trend, then a Stop
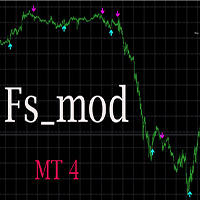
Fs_mod стрелочный индикатор, указатель направления тренда. Индикатор НЕ перерисовывает и не изменяет свои показания, стрелки появляются по закрытию бара и остаются на своих местах. При появлении стрелки дает несколько типов оповещений. Индикатор предназначен для использования на следующих финансовых инструментах: - Forex - индексы - акции. Рекомендуется использовать на таймфреймах не ниже 15 мин

After purchase, you are eligible to receive EA Forex Proton and try it for 14 days completely FREE! This robot automates the alerts from Wick Hunter!
Tired of getting trapped by false breakouts? Wick Hunter is a powerful custom indicator designed to detect fakeouts and identify true reversals before the crowd catches on. Built on the proven False Breakout Strategy , Wick Hunter helps you: Spot liquidity grabs and stop-hunts Enter with precision near wicks Avoid fake breakouts that ruin trades

Multi Stochastic Display – The Ultimate MTF Trade Scanner for Forex & Crypto Multi Stochastic Display is a powerful multi-timeframe trading tool that gives you a professional edge in analyzing market momentum. Designed for both Forex and Crypto traders, this clean and modern indicator visually presents BUY and SELL signals across 9 timeframes (from M1 to Monthly) for over 25 instruments. Its intuitive panel automatically ranks all instruments based on their strongest stochastic trend – whethe
DYJ NetPilot is an Expert Advisor (Utilities) developed for the MetaTrader platform, designed to optimize trade exits by dynamically calculating the weighted average price (Pmix) of all open positions and adjusting exit levels accordingly. Key Features: Pmix Calculation: Computes the weighted average price (Price Mix) of open positions, providing a clear reference point for trade management. Dynamic Exit Strategy: Identify the prevailing direction (long/short positions) within open orders and es
PipFlow — Intelligent Scalper for GBPUSD M5 Looking for an EA that doesn’t just follow the trend but adapts to market changes in real time? Meet PipFlow — a lightweight yet sophisticated trading solution designed for active trading on the GBPUSD pair using the M5 timeframe. This expert advisor detects momentum shifts and builds a trade management strategy based on current volatility conditions. Key Advantages of PipFlow: Adaptive Entry Logic : Uses a modified SuperTrend indicator to determine

Speed Scalp MT4 – Fast Signal Indicator for Precision Scalping This indicator is designed for all timeframes and all symbols. Perfect for scalping, intraday, or even swing trading. Non-repainting logic – signals stay fixed once drawn.
– No repainting – No lag – No DLLs – No third-party dependencies Built for clarity, precision, and fast decision-making.
Universal Compatibility Use it on M1, M5, M15, H1, H4, D1 – it adapts to your strategy. Works on all instruments: Forex, indices, metals, and

KP Grid is a robust Expert Advisor specifically designed for grid-based strategies in trending or ranging markets. It intelligently opens and manages buy/sell grids using customizable distance, volume scaling, and profit/loss management logic. With built-in trailing options and optional RSI-based signal filtering, KP Grid adapts to various market scenarios while offering strong control over drawdowns. This EA is suitable for experienced traders who understand the dynamics of grid systems and w
The MetaTrader Market is the only store where you can download a free demo trading robot for testing and optimization using historical data.
Read the application overview and reviews from other customers, download it right to your terminal and test a trading robot before you buy. Only on the MetaTrader Market you can test an application absolutely free of charge.
You are missing trading opportunities:
- Free trading apps
- Over 8,000 signals for copying
- Economic news for exploring financial markets
Registration
Log in
If you do not have an account, please register
Allow the use of cookies to log in to the MQL5.com website.
Please enable the necessary setting in your browser, otherwise you will not be able to log in.