UPD1 Impulse Shadow

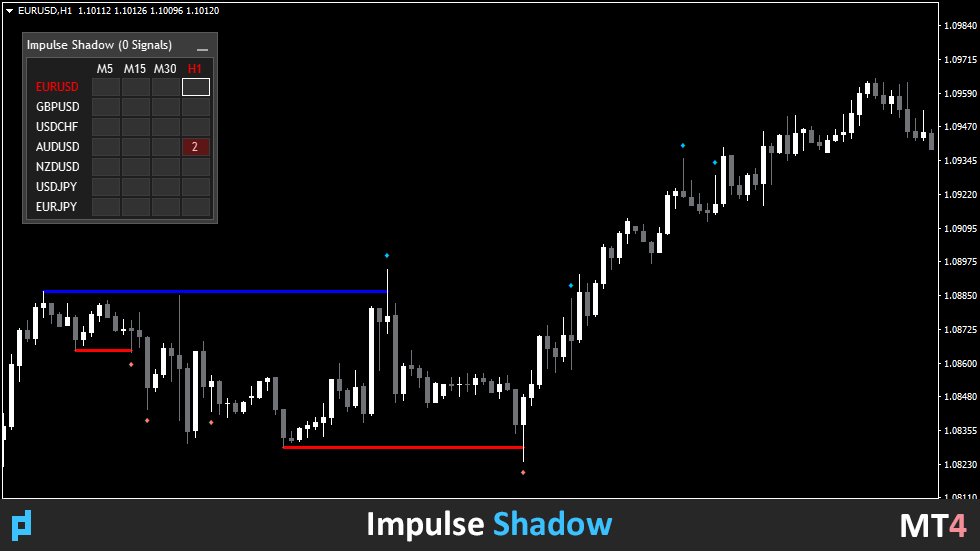
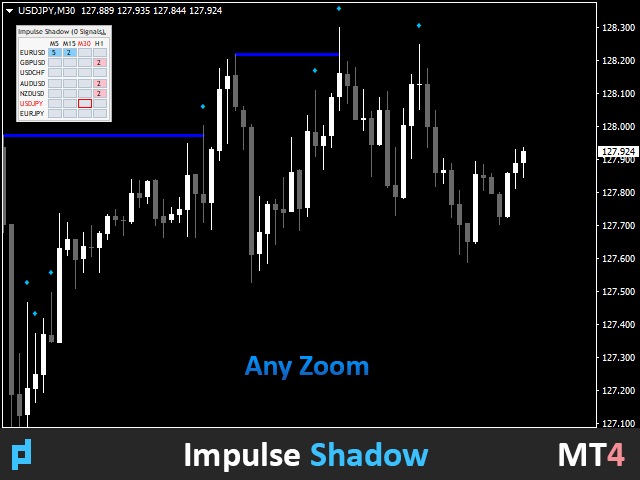
The indicator searches for and displays large shadows on the chart automatically based on volatility.

Shadows are additionally filtered by the wave size.

The algorithm analyzes the fractal breakdown by the shadow in the specified range and displays the level.

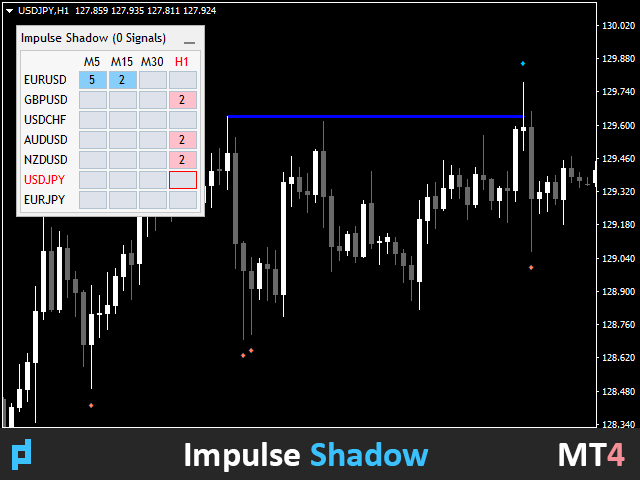
In the settings, you can enable a multi-currency dashboard. The alert is selected between the current schedule or the entire dashboard sheet.

Signals for large shadows and those that have broken through the fractal level can be turned on separately.

Blog-Link - Retest and Fake Breakout with UPD1.
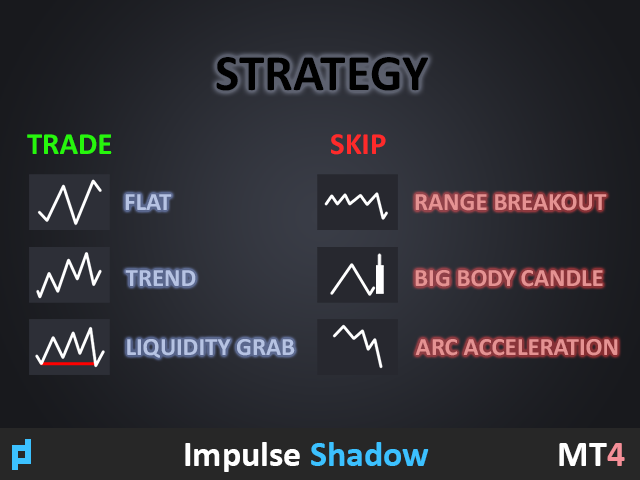

Trading Patterns:

+ Retest by trend.

+ False breakout.

+ Other.


EURUSD, GBPUSD, XAUUSD, ...

M15, M30, H1.


Input parameters.


Main.

Bars Count – the number of bars to display.

ATR Period - number of candlesticks to calculate volatility.

ATR Coeff Shadow (0 - Off) – shadow size coefficient (relative to the average volatility candle).

ATR Coeff Impulse (0 - Off) – wave size coefficient (filter for shadows that are searched only in waves exceeding the specified coefficient, where 1 is the average calculated wave).

Max Line Length - the maximum length of the level in bars.

Min Line Length - the minimum length of the level in bars.

Stop Line - search for a fractal breakout by the nearest shadow or ignoring all shadows except the signal one.


Visual Settings.

Shadow Arrow Visual - display all shadows or only those that crossed the fractal.

Shadow Arrow Code - shadow icon code.

Shadow Arrow Indent Coeff - icon indentation coefficient.

Shadow Arrow Size - icon size.

Shadow Arrow UP Color - the color of the top icon.

Shadow Arrow DN Color - the color of the lower icon.

False Breakout Color UP Line (None - Chameleon) - the color of the level above.

False Breakout Color DN Line (None - Chameleon) - the color of the level from below.

Chameleon Line Color, % - offset of the level brightness color if no color is selected.

False Breakout Line Width - level thickness.


Dashboard Settings.

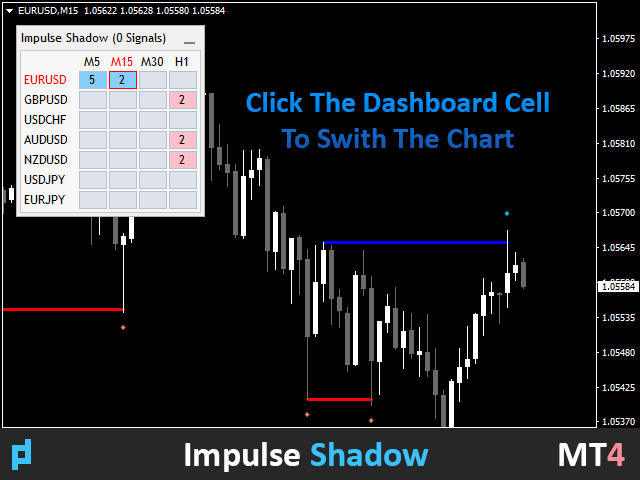
Dashboard – enable/disable multi-currency multi-time frame dashboard.

Scan Bars - how many bars in the history to monitor after the found shadow.

Dashboard Zoom % (0 - auto) - scaling the dashboard visual.

Color Theme - automatic or manual selection of the panel color theme (light and dark).

Symbol List – A list of symbols. You can enter any tools separated by commas.

View M1-D1 – enable/disable a specific timeframe.


Notification Settings.

Alert - enable/disable the alert block.

Current Chart – alert only on the current chart, ignoring dashboard signals.

Dashboard List – alert when new signals appear in the dashboard.

Alert Shadow - honk when a shadow is found.

Alert Shadow Cross Level - signal when the shadow of a fractal intersects (in priority).

Alert Work Time - the time frame in which the alert will work.

Alert Pop Up - enable/disable the alert pop-up window.

Alert Push - enable/disable notification on the phone.

Alert E-mail - enable/disable sending alerts to e-mail.

Alert Sound - enable/disable the alert sound.

Alert Sound Name - the name of the sound file.

Alert Sound - включить/отключить звук алерта.

Alert Sound Name - название звукового файла.

Recommended products
Special offer : ALL TOOLS , just $35 each! New tools   will be   $30   for the   first week   or the   first 3 purchases !  Trading Tools Channel on MQL5 : Join my MQL5 channel to update the latest news from me In a volatile trading environment, a powerful and intuitive analysis tool can help you seize opportunities quickly. Fibonacci Trend Scanner not only integrates traditional Fibonacci indicator features, SuperTrend but also expands functionality with currency pair scanning, multi-timeframe
Volumatic VIDyA MT4
Duc Hoan Nguyen
4.5 (4)
Special offer : ALL TOOLS , just $35 each! New tools   will be   $30   for the   first week   or the   first 3 purchases !  Trading Tools Channel on MQL5 : Join my MQL5 channel to update the latest news from me Volumatic VIDYA (Variable Index Dynamic Average) is an advanced indicator designed to track trends and analyze buy-sell pressure within each phase of a trend. By utilizing the Variable Index Dynamic Average as a core dynamic smoothing technique, this tool provides critical insights into
The price is moving between two curve tunnel lines in a trend. The two lines of a tunnel represent support and resistance. In an uptrend, for instance, a trade might be entered at the support of the trend line (shown by the red line in the chart) and exited at resistance of the upper tunnel line (shown by the blue line). Tunnel show trend direction for any timeframe (if you have enough bars on the chart for higher timeframes). Trend, or price tunnel, can be up, down or sideways. If the current p
Индикатор ищет подобную ценовую структуру, сравнивая с последней ценовой структурой. Размер паттерна (грубо говоря количество переломов зигзага) настраивается (всегда меньше на 1, чем введено - нулевой перелом не считается). Все найденные совпадения отмечаются прямоугольником. Так же к паттернам существует быстрая навигация с помощью кнопочек "Next patt" и "Prev patt". В индикатор вшиты два индикатора типа ЗигЗа г : стандартный зигзаг и пользовательский , моей разработки. Параметры настройки ста
Introduction Harmonic Patterns are best used to predict potential turning point. Traditionally, Harmonic Pattern was identified manually connecting peaks and troughs points in the chart. Manual harmonic pattern detection is painfully tedious and not suitable for everyone. You are often exposed under subjective pattern identification with manual pattern detection. To avoid these limitations, Harmonic Pattern Plus was designed to automate your harmonic pattern detection process. The functionality
CyberZingFx Volume Plus
Afsal Meerankutty
4.94 (17)
Advanced version of CyberZingFx Volume Plus, the ultimate MT4 indicator for traders seeking highly accurate buy and sell signals. With an additional strategy and price action dot signals that enhances its effectiveness, this indicator offers a superior trading experience for professionals and beginners alike. The CyberZingFx Volume Plus Advanced version combines the power of volume analysis and historical price data with an additional strategy, resulting in even more precise and reliable signals
TripleFusion
Rami Fatmi Fernandez
It is a technical indicator that combines three of the most popular oscillators in technical analysis: MACD, RSI, and Stochastic. The integrated advanced formula combines their signals to provide a single, clear and effective line, eliminating noise and helping you make quick, visual decisions. What makes this indicator unique? Integrates the difference between the MACD, RSI, and Stochastic into a single combined formula. It displays the result in a separate window, like the ATR, making i
Strong Pivot trend indicator is a trend indicator that uses standard pivot calculation and some indicators. The purpose of the indicator is to calculate the possible trends using the pivot point. And to give the user an idea about trend direction. You can use this indicator as a trend indicator. Or with other indicators suitable for your strategy. Features The blue bar represents the upward trend. The yellow bar represents the downward trend. The blue pivot point represents the upward trend. T
UPD1 Fibo Levels
Vitaliy Kuznetsov
5 (3)
The indicator analyzes the specified number of candles and plots Fibonacci levels based on the high-low. Since the levels are rearranging, we are interested in the right side of the range. The price magnetizes the levels and reacts to the touch. Use this tool to find a trend entry point after a correction. If on the left we see that the levels have risen perfectly, then we can assume that we have found the end of the movement at the extreme point. All lines are drawn through buffers or objects (
FREE
This indicators automatically draws the Support and resistances levels for you once you've dropped it on a chart.  It reduces the hustle of drawing and redrawing these levels every time you analysis prices on a chart. With it, all you have to do is dropped it on a chart, adjust the settings to your liking and let the indicator do the rest.  But wait, it gets better; the indicator is absolutely free!  Get the new and improved version here:  https://youtu.be/rTxbPOBu3nY Parameters Time-frame  -> T
FREE
This is a well-known ZigZag indicator. But it differs by the fact that its plot is based on values of the middle line which is set by a user. It can display Andrews’ Pitchfork and standard or Bobokus Fibo levels. NO REPAINTING. Parameters Period МА — middle line period. Default value is 34. Minimum value is 4. Maximum value is set at your discretion. Used to calculate price - base price to calculate the middle line. The averaging method - method of smoothing the middle line. Turning pitchfork —
The indicator detects important peaks and troughs (extremes) on the chart. These points can be used to plot support/resistance levels and trend lines, as well as any other graphical analysis. These points can serve as reference points for setting trading orders. The indicator does not redraw . Settings: Size_History  - the size of the calculated history. Num_Candles_Right  - number of candles to the right of the peak or trough. Num_Candles_Left  - number of candles to the left of the peak or
Special offer : ALL TOOLS , just $35 each! New tools   will be   $30   for the   first week   or the   first 3 purchases !  Trading Tools Channel on MQL5 : Join my MQL5 channel to update the latest news from me The Trend Levels indicator is meticulously crafted to pinpoint critical trend levels—High, Mid, and Low—during market movements. With real-time calculations based on the highest, lowest, and mid-level values over a customizable lookback period, this tool provides traders with a structure
Auto Levels
Yaroslav Varankin
Auto Level this tool is able to determine the levels of support and resistance. search and display when the price has broken through the level and when it pushed off from it. the indicator can be useful if you use resistance support levels in your trading. or the highs and lows of the price, then it will greatly simplify your work and help you more quickly and more accurately determine the rebound or breakdown of the current trend or tendencies level. blue line bottom uptrend red line on top dow
CyberZingFx Trend Reversal
Afsal Meerankutty
4.18 (17)
NEW YEAR SPECIAL DISCOUNT RUNNING NOW 40% DISCOUNT Price slashed from $149 to $89 until 3rd Jan 2025 Indicator captures the trend reversals with no-repaint Buy and Sell Arrow signals. CyberZingFx Trend Reversal Indicator - your go-to solution for accurate and reliable trend reversal signals. With its  advanced trading strategy , the indicator offers you Buy and Sell Arrow signals that do not repaint, making it a reliable tool for catching Swing Highs and Swing Lows in any market and any time fr
Pivot Points Classic PRO
Richard Bernard Parioleau
The Pivot Points Classic + Intermediate Lines indicator by maratoa201 is designed to help traders quickly visualize key price levels on their MT4 and MT5 charts. It automatically calculates: The central pivot point (PP) Support levels ( S1, S2, S3 ) Resistance levels ( R1, R2, R3 ) Intermediate lines (0.5, 1.5, 2.5) to refine rebound and breakout zones Main Features: Clear and fast reading of pivot levels Offset labels to prevent price overlap Optimized for XAUUSD M5 but compatible with any symb
BuySell FibPiv Fibonacci Pivot Level Indicator with Dynamic Support and Resistance Zones Overview BuySell FibPiv is a Fibonacci pivot-based technical analysis indicator designed to calculate dynamic support and resistance levels using previous session price data. The indicator applies Fibonacci expansion and retracement calculations to generate multiple pivot-based levels for intraday and swing trading analysis. It provides: Central pivot calculation Fibonacci-based support and resistance zones
Axiom FVG and OB Mt4
Miguel Angel Leon Yanez
AXIOM FVG + Order Block Pro v4.1 Professional ICT/SMC Institutional Trading Indicator Overview AXIOM FVG + Order Block Pro   is a professional non-repainting indicator for MetaTrader 5 that automatically detects and displays   Fair Value Gaps (FVGs)   and   Order Blocks (OBs)   based on ICT (Inner Circle Trader) and SMC (Smart Money Concepts) methodologies. Built with institutional-grade precision, this tool helps traders identify high-probability supply and demand zones where smart money enters
Voenix
Lorentzos Roussos
4.58 (12)
Harmonic patterns scanner and trader . Some Chart patterns too  Patterns included :  ABCD pattern Gartley pattern Bat pattern Cypher pattern 3Drives pattern Black Swan pattern White Swan pattern Quasimodo pattern or Over Under pattern Alt Bat pattern Butterfly pattern Deep Crab pattern Crab pattern Shark pattern FiveO pattern Head And Shoulders pattern Ascending Triangle pattern One Two Three pattern  And 8 custom patterns  Voenix is a multi timeframe and multi pair harmonic pattern scanner ,sup
Pivot levels Auto V1
Hafis Mohamed Yacine
What Is a Pivot Point? A pivot point is a technical analysis indicator, or calculations, used to determine the overall trend of the market over different time frames. The pivot point itself is simply the average of the intraday high and low, and the closing price from the previous trading day. On the subsequent day, trading above the pivot point is thought to indicate ongoing bullish sentiment, while trading below the pivot point indicates bearish sentimen How to Use Pivot Points The very ess
This indicator was created to spot potential reversals in the market. The Pinbar, or Pinnochio Bar, pattern is a a great candlestick pattern which can yield good trading results if traded properly. The idea behind this pattern is that price tries to trick us into thinking the wrong direction. When a Bullish Pinbar for example has formed, it tries to convince us price is going higher but in reality price is going down at the end of the bar. These patterns can be powerful reversal signals when use
This Automatic support/resistance indicator calculates various peaks and troughs of the price action, identifies relevant levels and draws support and resistance automatically. It uses the built-in "ZigZag" indicator in Metatrader as a data source hence, very much accurate indicator.  The support and resistance lines are contineusely updated as new levels and formed. The indicator has only 5 parameters to set, and mostly it can be used with the default values:  The description of the settings is
Fibonacci Retracement object is an object that has been provided by metatrader 4 platform. But  Fibonacci Retracement  object doesn't automated adjust the chart. You have to put and manage it manually to the chart. Because of that, this indicator was created. If you like using filbonacci retracement indicator, highly recommended to use Automated Fibonacci Retracement Indicator if you want to get better result in here: https://www.mql5.com/en/market/product/95515 LT Automated Fibonacci Retraceme
FREE
Harmonic ABCD Universal
Mihail Matkovskij
5 (2)
The indicator displays harmonic ABCD patterns, as well as the market entry points, which allows the trader to make trading decisions quickly. Harmonic ABCD Universal is one of the few indicators that predict price movement by determining pivot points with a rather high probability long before the pivot itself. It supports sending push and email notifications, as well as alerts. The indicator scans all possible combinations on the chart for the current moment, and also in history, with the help o
Peak Trough Analysis is the great tool to detect peaks and troughs in your chart. Peak Trough Analysis tool can use three different peaks and troughs detection algorithm. The three algorithm include the orignal Fractals Indicator by Bill Williams, the Modified Fractals indicator and ZigZag indicator. You can use this peak and trough analysis tool to detect the price pattern made up from Equilibrium Fractal-Wave process. For further usage, there are good guide line on how to use this peak trough
FREE
Automatic Fibonacci Pivots
Martin Alejandro Bamonte
Automatic Fibonacci Pivots automatically calculates pivot levels and support/resistance based on Fibonacci, clearly showing key reference points that indicate potential reversal or trend continuation zones, as well as buy and sell areas . Designed for traders seeking clarity on charts without having to recalculate and manually place Fibonacci levels each time. Once set up on your computer, it will send an alert to your phone when a potential buy/sell signal is issued, allowing you to trade direc
This indicator filters the Zigzag indicator to calculate the main support and resistance levels. Variables minimum gap between peaks : is the distance (GAP) between the peaks of the Zigzag peaks sensitivity : Minimum number of nearby peaks look back: it means that it has to test the last 50 peaks in the Zigzag object name perfix: a prefix for level’s line name on chart
FREE
Pivot Trend
Harun Celik
5 (2)
Pivot trend indicator is a trend indicator that uses standard pivot calculation and some indicators. The purpose of the indicator is to calculate the possible trends using the pivot point. And to give the user an idea about trend direction. You can use this display as a trend indicator. Or with other indicators suitable for your strategy. Features The green bar represents the upward trend. The red bar represents the downward trend. The blue pivot point represents the upward trend. The yellow pi
I recommend you to read the   product's blog  (manual) from start to end so that it is clear from the beginning what the indicactor offers. This multi time frame and multi symbol supply and demand zone dashboard indicator sends alerts when the price has reached a supply/demand zone. It is also possible to use it to be alerted about regular double tops/bottoms instead of zones. It can be used with all time frames from M1 to MN. It is possible to use RSI, divergence (MACD, OsMA, RSI or Awesome) a
Necessary for traders: tools and indicators Waves automatically calculate indicators, channel trend trading Perfect trend-wave automatic calculation channel calculation , MT4 Perfect trend-wave automatic calculation channel calculation , MT5 Local Trading copying Easy And Fast Copy , MT4 Easy And Fast Copy , MT5 Local Trading copying For DEMO Easy And Fast Copy , MT4 DEMO Easy And Fast Copy , MT5 DEMO The homeopathic indicator is also called the CCI indicator. The CCI indicator was proposed
FREE
Buyers of this product also purchase
Gann Made Easy
Oleg Rodin
4.83 (162)
Gann Made Easy is a professional and easy to use Forex trading system which is based on the best principles of trading using the theory of W.D. Gann. The indicator provides accurate BUY and SELL signals including Stop Loss and Take Profit levels. You can trade even on the go using PUSH notifications. PLEASE CONTACT ME AFTER PURCHASE TO GET TRADING  INSTRUCTIONS AND GREAT EXTRA INDICATORS   FOR FREE! Probably you already heard about the Gann trading methods before. Usually the Gann theory is a ve
M1 Sniper
Oleg Rodin
5 (22)
M1 SNIPER is an easy to use trading indicator system. It is an arrow indicator which is designed for M1 time frame. The indicator can be used as a standalone system for scalping on M1 time frame and it can be used as a part of your existing trading system. Though this trading system was designed specifically for trading on M1, it still can be used with other time frames too. Originally I designed this method for trading XAUUSD and BTCUSD. But I find this method helpful in trading other markets a
Scalper Inside PRO
Alexey Minkov
4.74 (69)
Scalper Inside PRO – Since 2020. An exclusive indicator that utilizes an innovative algorithm to swiftly and accurately determine the market trend. The indicator automatically calculates opening, closing, and profit levels, providing detailed trading statistics. With these features, you can choose the most appropriate trading instrument for the current market conditions. Additionally, you can easily integrate your own arrow indicators into Scalper Inside Pro to quickly evaluate their statistics
PRO Renko System
Oleg Rodin
5 (30)
PRO Renko System is a highly accurate trading system specially designed for trading RENKO charts. The ARROWS and Trend Indicators DO NOT REPAINT! The system effectively neutralizes so called market noise giving you access to accurate reversal signals. The indicator is very easy to use and has only one parameter responsible for signal generation. You can easily adapt the tool to any trading instrument of your choice and the size of the renko bar. I am always ready to provide extra support to help
Auto Optimized Parabolic RSI: Advanced 3D Momentum Engine Most retail indicators fail because they rely on static inputs that break the moment market volatility shifts. Auto Optimized Parabolic RSI solves the problem of "indicator decay" by continuously recalculating its own mathematical edge, bringing institutional-grade quantitative adaptation directly to your MT5 terminal. The Core Advantage: Custom In-Memory 3D Optimization   Standard auto-optimizers often freeze the MT5 platform because the
Quantum Breakout Indicator PRO
Bogdan Ion Puscasu
4.96 (26)
Introducing   Quantum Breakout PRO , the groundbreaking MQL5 Indicator that's transforming the way you trade Breakout Zones! Developed by a team of experienced traders with trading experience of over 13 years, Quantum Breakout PRO is designed to propel your trading journey to new heights with its innovative and dynamic breakout zone strategy. Quantum Breakout Indicator will give you signal arrows on breakout zones with 5 profit target zones and stop loss suggestion based on the breakout box. I
Market Makers
Mohamed Hassan
5 (4)
After purchase, contact me privately to receive 1 month of free testing with EA Forex Proton! This advanced MT4 trading robot automatically executes signals from any MT4 indicator, including Market Makers. The latest version also includes AI integration, allowing each trade signal to be analyzed using Artificial Intelligence. Live Signal with EA Forex Proton: Click here Market Makers is a powerful price action trading system designed to identify high-probability Buy and Sell opportunities based
Apex Edge No Repaint Professional Non-Repainting Trading Indicator for MT4 Apex Edge No Repaint is a premium, clean, and reliable trading tool designed for serious forex and cryptocurrency traders who want clear signals without the frustration of repainting arrows. Key Features: 100% No Repaint – Signals remain fixed once they appear on the chart Dual signal system: RAW signals for early opportunities and CONF signals for high-probability confirmed entries Simple one-click toggle buttons: RAW ON
This indicator has been designed to integrate with the Elliott Wave theory, providing two distinct methods of operation: Automatic Work: In this mode, the indicator operates autonomously by detecting all five motive waves on the chart according to Elliott Wave theory. It offers predictions and identifies potential reversal zones. Additionally, it has the capability to generate alerts and push messages to notify traders of significant developments. This automated functionality streamlines the pro
Please send me Direct message on MQL5 CHAT after purchasing the Indicator for Training and Installation Support There are some additional files that is important to use with the Indicator . So be sure to contact me after purchasing the Indicator So that I can add you for training and support . If you find any difficulty with installation then send me Direct message here So that I can connect with you via Anydesk or Teamview for the product installation. " Smart Order Block Indicator " to find m
GoldRush Trend Arrow Signal V1.6 The GoldRush Trend Arrow Signal indicator V1.6 continues to provide precise, real-time trend analysis tailored for high-speed, short-term scalpers in XAU/USD , but it now has additional features and improved efficiency and reliability. Built specifically for the 1-minute time frame, this tool displays directional arrows for clear entry points, allowing scalpers to navigate volatile market conditions with confidence. The indicator consists of PRIMARY and SECONDARY
The " Dynamic Scalper System " indicator is designed for the scalping method of trading within trend waves. Tested on major currency pairs and gold, compatibility with other trading instruments is possible. Provides signals for short-term opening of positions along the trend with additional price movement support. The principle of the indicator. Large arrows determine the trend direction. An algorithm for generating signals for scalping in the form of small arrows operates within trend waves.
PZ Trend Trading
PZ TRADING SLU
4.8 (5)
Capture every opportunity: your go-to indicator for profitable trend trading Trend Trading is an indicator designed to profit as much as possible from trends taking place in the market, by timing pullbacks and breakouts. It finds trading opportunities by analyzing what the price is doing during established trends. [ Installation Guide | Update Guide | Troubleshooting | FAQ | All Products ] Trade financial markets with confidence and efficiency Profit from established trends without getting whips
GOLD Impulse with Alert
Bernhard Schweigert
4.67 (12)
This indicator is a super combination of our 2 products  Advanced Currency IMPULSE with ALERT  and  Currency Strength Exotics . It works for all time frames and shows graphically impulse of strength or weakness for the 8 main currencies plus one Symbol! This Indicator is specialized to show currency strength acceleration for any symbols like Gold, Exotic Pairs, Commodities, Indexes or Futures. Is first of its kind, any symbol can be added to the 9th line to show  true currency strength accelerat
Day Trader Master is a complete trading system for traders who prefer intraday trading. The system consists of two indicators. The main indicator is the one which is represented by arrows of two colors for BUY and SELL signals. This is the indicator which you actually pay for. I provide the second indicator to my clients absolutely for free. This second indicator is actually a good trend filter indicator which works with any time frame. THE INDICATORS DO NOT REPAINT AND DO NOT LAG! The system is
Advanced Supply Demand
Bernhard Schweigert
4.91 (300)
Trading Special – 40% OFF Best Solution for any Newbie or Expert Trader! This indicator is a unique, high quality and affordable trading tool because we have incorporated a number of proprietary features and a new formula. With this update, you will be able to show double timeframe zones. You will not only be able to show a higher TF but to show both, the chart TF, PLUS the higher TF: SHOWING NESTED ZONES. All Supply Demand traders will love it. :) Important Information Revealed Maximize the pot
Gold Scalper Super
Aleksandr Makarov
5 (2)
Gold Scalper Super is an easy-to-use trading system. The indicator can be used as a standalone scalping system on the M1 time frame, as well as part of your existing trading system. Bonus: when purchasing an indicator, Trend Arrow Super is provided free of charge, write to us after purchase. The indicator 100% does not repaint!!! If a signal appears, it does not disappear! Unlike indicators with redrawing, which lead to the loss of a deposit, because they can show a signal and then remove it.
CRT Candle Range Theory HTF MT4.   Ultimate CRT Indicator: Advanced ICT Concepts and Malaysian SnR Trading System Discounted   Price   $50  !!     Secure your lifetime access   now   before it switches to   subscription-only ! Master the Market Maker's Footprints with the Most Advanced Candle Range Theory Indicator Unlock the true power of   Smart Money Concepts (SMC)   and trade precisely like the institutions with the   Ultimate CRT Indicator . Built exclusively for serious traders, this indic
PZ Turning Points MT4
PZ TRADING SLU
1 (1)
Identify key turning points with reliable fractal analysis This indicator examines the price structure of fractals of different periods to determine possible reversal points in the market, providing timing to positional traders that already have a fundamental or technical valuation model. Unlike its younger brother, Reversal Fractals , this indicator won't miss reversals because of the period selected, and will find reversal fractals on a zig-zag fashion, ignoring those reversals which do not
PZ Support Resistance
PZ TRADING SLU
3.33 (3)
Unlock key market insights with automated support and resistance lines Tired of plotting support and resistance lines? This is a multi-timeframe indicator that detects and plots supports and resistance lines in the chart with the same precision as a human eye would. As price levels are tested over time and its importance increases, the lines become thicker and darker, making price leves easy to glance and evaluate. [ Installation Guide | Update Guide | Troubleshooting | FAQ | All Products ] Boos
Super Signal – Skyblade Edition Professional No-Repaint / No-Lag Trend Signal System with Exceptional Win Rate | For MT4 / MT5 It works best on lower timeframes, such as 1-minute, 5-minute, and 15-minute charts. Core Features: Super Signal – Skyblade Edition is a smart signal system designed specifically for trend trading. It applies a multi-layered confirmation mechanism to detect only strong, directional moves supported by real momentum. This system does not attempt to predict tops or bottoms
They say history repeats itself. What if you could prove it in real-time? The Propfolio Ghost Pattern is an advanced algorithmic pattern-matching engine. It empowers you to select any current price action structure on your chart and instantly scan thousands of historical candles to find the exact moment in the past where the market did the exact same thing. Once it finds the highest probability match, it projects the historical outcome into the future as "Ghost Candles"—giving you a highly calcu
CURRENTLY 26% OFF !! This indicator is a super combination of both our main indicators ( Advanced Currency Strength 28 &  Advanced Currency IMPULSE with ALERT ). It shows Currency Strength values for TICK-UNITS and alert signals for 28 Forex pairs. 11 different Tick-Units can be used. Those are 1, 2, 3, 4, 5, 6, 10, 12, 15, 20, and 30 Seconds. The Tick-Unit bar in the sub-window will be shown and shifted to the left when there is at least 1 tick within the second’s timer.  With only ONE chart y
Atomic Analyst
Issam Kassas
5 (5)
First of all Its worth emphasizing here that this Trading Indicator is   Non-Repainting , Non Redrawing and Non Lagging Indicator   Indicator, Which makes it ideal from both manual and robot trading.  User manual: settings, inputs and strategy . The Atomic Analyst  is a PA Price Action Indicator that uses Strength and Momentum of the price to find a better edge in the market. Equipped with Advanced filters which help remove noises and false signals, and Increase Trading Potential. Using Multiple
Trend Screener
STE S.S.COMPANY
4.79 (95)
Trend Screener Indicator --Professional Trend Trading & Market Scanning System for MetaTrader Unlock the true power of trend trading with Trend Screener Indicator — a complete multi-currency, multi-timeframe trend analysis solution   powered by Fuzzy Logic,Trend Pulse Technology  and advanced market structure algorithms.   Trend Screener transforms your MetaTrader platform into a professional-grade Trend Analyzer and Market Scanner, helping you identify high-probability trend opportunities, ear
Contact me after purchase to get Bonus EA based on this indicator. The Self Optimizing Double MA Strategy is a professional-grade trading tool designed to eliminate parameter guesswork. Powered by a built-in auto-optimization engine, it continuously adapts to shifting market conditions by simulating thousands of parameter combinations in the background to maintain a statistical edge. Instead of relying on static, outdated settings, the indicator dynamically updates its own logic to find the mos
Bull versus Bear
Mohamed Hassan
4.5 (18)
Send us a message after your purchase to receive more information on how to get your  BONUS  for FREE  that works in great combination with Bull vs Bear ! Bull versus Bear is an easy-to-use Forex indicator that gives traders clear and accurate signals based on clear trend retests . Forget about lagging indicators or staring at charts for hours because  Bull vs Bear provides real-time entries with no lag and no repaint, so you can trade with confidence. Bull vs Bear  helps you enter trades during
Trading Special –40% OFF Best Solution for any Newbie or Expert Trader! This Indicator is a unique, high quality and affordable trading tool because we have incorporated a number of proprietary features and a new formula. With only ONE chart you can read Currency Strength for 28 Forex pairs! Imagine how your trading will improve because you are able to pinpoint the exact trigger point of a new trend or scalping opportunity? User manual: click here That's the first one, the original! Don't buy a
Technical indicator that structures charts and identifies cyclical price movements. Can work on any charts. Several types of alerts. There are additional arrows on the chart itself. Without redrawing on history, works on closing a candle. Recommended TF from M5 and higher. Easy to use and configure parameters. When using 2 indicators with different parameters, you can use without other indicators. Has 2 input parameters Cyclicality and Signal duration These 2 parameters work with the processin
KuKl
IGOR KIRIANEN
The indicator is built on a non-standard Zig Zag, it draws accumulations after which if the price leaves this zone and a test of this zone occurs, then a sound signal is given and an arrow appears - after the test candle closes.The indicator does not redraw its signals, it is very easy to use, there are only three settings 1- this is the zig zag parameter 2- this is the minimum price exit from the zone 3- this is the maximum price exit from the zone. The lower the parameter for Zig Zag, the more
More from author
UPD1 Volume BOX
Vitaliy Kuznetsov
4.94 (16)
The indicator displays the horizontal volume profile in the specified area (BOX) and the maximum volume (POC). Product Features. 1. You can use ticks or just price. 2. Adaptive grid spacing (M1-MN). 3. Adaptive high volume (median) search step depending on box size. 4. Automatic chameleon color for box lines and buttons. 5. Multiple boxes, easy to create and delete. 6. 70% volume area (enable in settings). 7. There is an alert for touching the maximum horizontal volume line (POC). 8. VWAP. 9. C
UPD1 Profile Levels
Vitaliy Kuznetsov
5 (7)
The indicator finds the levels of the maximum and minimum price volume (market profile) on the working histogram for the specified number of bars.  Composite profile . The height of the histogram is fully automatic and adapts to any instrument and timeframe. The author's algorithm is used and does not repeat well-known analogues. The height of the two histograms is approximately equal to the average height of the candle. Smart alert will help you to inform about the price concerning the volume
UPD1 Volume Cluster
Vitaliy Kuznetsov
4.82 (17)
The algorithm finds the zones of reduced volatility based on the UPD1 Trend Direction Indicator and builds the maximum horizontal volume based on the UPD1 Volume Box Indicator . As a rule, a strong trend movement occurs when exiting accumulation. If the price has left the accumulation, then it can test its maximum horizontal volume (POC). Smart alerts are available in the settings. Input parameters. Main Settings. Bars Count – the number of history bars on which the indicator will work. Timef
FREE
UPD1 Trend Direction
Vitaliy Kuznetsov
4.63 (8)
This indicator is used to display the places of the flat and trend. The construction is based on an oscillator. It is used as an additional filter, both for trading on a regular chart and for binary options. Flat places are used in the UPD1 Volume Cluster indicator for trading according to the concept of smart money The built-in alert signals the places of the greatest overbought/oversold. Input parameters. Main Settings. Bars Count - indicate the number of bars on which the trend direction w
FREE
UPD1 Volume Footer
Vitaliy Kuznetsov
4.85 (13)
The indicator shows the vertical volume. In the settings there are 2 coefficients for determining high and extreme volume and 1 for determining low volume. A similar algorithm is also used in the UDP1 Volume Pixel indicator . When the specified volume is detected, the histogram is painted in the appropriate color. The width of the histogram is selected automatically, depending on the scale. As a rule, the price reacts to the maximum and minimum volume. But it is necessary to use confirmation si
FREE
An indicator that displays the Engulfing candlestick pattern. In the settings, you can specify the type of engulfing (body, shadow and combination). It is possible to filter by trend (2 moving averages) and by reversal (RSI and Bollinger Bands). This is a very popular price action pattern. A multi-currency dashboard is available. With it, you can easily switch between charts. Trading Patterns: Retest by trend. False breakout. Order Block. Other. EURUSD, GBPUSD, XAUUSD, ... M15, M30, H1. Inpu
The indicator shows a signal on the chart when the second candlestick is inside the first candlestick, i.e. has not gone beyond its limits. This candlestick pattern is called the Inside Bar. This pattern is not as popular as Pin Bar or Engulfing, but it is sometimes used by some traders. There is a possibility to filter by trend (2 moving averages) and by reversal (RSI and Bollinger Bands). Multicurrency panel is available. With its help you can easily switch between charts. Trading patterns:
Trading panel with preset orders and automatic lot calculation for the MT4 terminal. Attention, the Trading Panel does not work in the strategy tester (only trailing stop testing). Manual, Description, Download Light Demo. Successful traders are distinguished by self-discipline and competent money management. If you use a fixed lot, then you are at risk. After all, there are different distances on different timeframes and one unprofitable transaction can cover several profitable ones. If you use
UPD1 Volume TimeFrame POC
Vitaliy Kuznetsov
4.4 (5)
The indicator display the maximum horizontal volume on the selected timeframe. Based on the UPD1 Volume Box indicator . The lines can be connected or separated. In the settings, you can enable smart touch alert. Such an indicator will be useful for those who trade according to the market profile and the concept of smart money. Input parameters. Main Settings. Bars Count - indicate the number of bars on which the TF POC will be drawn. Data Source - the time frame from which the ticks will be u
FREE
UPD1 Rsi Dots Dashboard
Vitaliy Kuznetsov
5 (2)
The indicator shows signals based on the terminal RSI oscillator on the chart. It is possible to filter out repeated signals. Here the oscillator is used to search for a reverse signal. It is recommended as an entry point in swing strategies and trading from levels. A multi-currency dashboard is available. With it, you can easily switch between charts. In product discussions, you can suggest an algorithm in which you can embed a dashboard. Input parameters. Main Settings. Bars Count – the n
FREE
UPD1 Profile Levels MT5
Vitaliy Kuznetsov
5 (4)
The indicator finds the levels of the maximum and minimum price volume (market profile) on the working histogram for the specified number of bars.  Composite profile . The height of the histogram is fully automatic and adapts to any instrument and timeframe. The author's algorithm is used and does not repeat well-known analogues. The height of the two histograms is approximately equal to the average height of the candle. Smart alert will help you to inform about the price concerning the volume l
The meaning of this indicator is to   find Murray levels on all timeframes   and combine them into   combo levels , including signal levels based on strong Murray levels (+2, +1, 8, 4, 0, -1, -2). The lower the timeframe, the more chances you have to see the combo level immediately. It will be highlighted in color. When you hover over any number, a hint will pop up to which timeframe the level belongs to. But you will always see the current timeframe as the leftmost one. A  smart alert  will he
UPD1 Watermark MT4
Vitaliy Kuznetsov
5 (2)
The indicator shows any text and any image on the chart, and can also output the information requested by macros. There are three text blocks and one block for images. Available font selection, size, color, indentation and positioning. If you want to brand your screenshots or display the necessary information on a graph, then UPD1 Watermark will be a very useful tool. Description of settings. Text Settings (3 blocks). Text 1, 2, 3 – enter the text and, or a macro. Font Name – write the font n
FREE
UPD1 Murrey Math Levels
Vitaliy Kuznetsov
5 (7)
Murray's mathematical levels are based on observations by Gann and his theory of the squareness of prices. According to Gann, the price moves in 1/8 of the range. These 1/8 allow us to get different resistance and support levels for a given chart, which have their own characteristics. After a breakout of -2 or +2 levels, or with a decrease in volatility, they are rebuilt. You can choose which period to display (current or entire history). All lines are drawn through buffers. Blog-Link -   Murrey
FREE
UPD1 X00 Levels
Vitaliy Kuznetsov
5 (10)
The indicator shows   round levels   on the chart. They are also called   psychological , banking, or levels of major players. At these levels, there is a real fight between bulls and bears, the accumulation of many orders, which leads to increased volatility. The indicator   automatically   adjusts to any instrument and timeframe. When the   level 80   is broken through and then tested, we   buy. When   level 20   is broken through and then tested, we   sell. The target is 00. Attention. Due t
FREE
UPD1 Impulse Channel
Vitaliy Kuznetsov
5 (8)
The channel indicator is trending and does not repaint. It creates an ATR price channel with the opposite volatility border. The indicator has proven itself well in the strategy of trading on impulse levels and fake breakout. The entry point should be looked for on the correction to the indicator line, and the take profit should be set on the opposite border. Blog-Link -   Retest and Fake Breakout with UPD1 . Input parameters. Bars Count - history to display. ATR - average true range period.
FREE
The indicator shows   round levels   on the chart. They are also called   psychological , banking, or levels of major players. At these levels, there is a real fight between bulls and bears, the accumulation of many orders, which leads to increased volatility. The indicator   automatically   adjusts to any instrument and timeframe. When the   level 80   is broken through and then tested, we   buy. When   level 20   is broken through and then tested, we   sell. The target is 00. Attention. Due to
FREE
UPD1 Fibo Levels
Vitaliy Kuznetsov
5 (3)
The indicator analyzes the specified number of candles and plots Fibonacci levels based on the high-low. Since the levels are rearranging, we are interested in the right side of the range. The price magnetizes the levels and reacts to the touch. Use this tool to find a trend entry point after a correction. If on the left we see that the levels have risen perfectly, then we can assume that we have found the end of the movement at the extreme point. All lines are drawn through buffers or objects (
FREE
UPD1 D Levels
Vitaliy Kuznetsov
5 (3)
Levels indicator based on the previous day. Mathematical formula determines entry and exit levels.  Trading recommendations. Levels are traded at the beginning of the European session when volatility appears. In case of insufficient volatility use half of take profit to exit. If the price reversed at half take profit, then on the reversal look for a target also at the level of half take profit. If the price bounced from the entry level, then in the opposite direction the price can reach the se
FREE
The Average True Range ( ATR ) is a measure of market volatility over a specified number of days. You should not expect a big continuation move when the price has reached the end of the range. The market is considered to have run out of fuel. If the price has not reached the edge, it still has a range. The indicator formula allows you to calculate High-Low levels both in aggregate and individually. You can also use these levels as support/resistance and target. Input parameters. Start Day - f
FREE
UPD1 Pivot Levels
Vitaliy Kuznetsov
5 (2)
The indicator shows on the chart the classic pivot levels calculated on the basis of the previous day . You can choose from what hour to calculate the formula. Trade on reversal levels in a flat. In a trending market, use them as a target. Combine with your strategies for successful trading. The levels are drawn using   buffers and displayed on the entire available quote   history. Input parameters. Start Hour - Choose from what hour to start building levels. 00 - Default. Show Mid Pivots - M
FREE
UPD1 Impulse Level
Vitaliy Kuznetsov
5 (7)
The indicator finds impulse waves on the chart. Analyzes the breakdown of the fractal channel and builds impulse levels . In addition, it finds the alleged places of false breakouts and liquidity grabs . In the settings, you can enable a multi-currency dashboard and select any tools and timeframes. Notification Choose between the current schedule or the entire list. There are separate impulse and false breakdown signals. Blog-Link -  Retest and Fake Breakout with UPD1 . Trade Patterns: + Retes
UPD1 Impulse Candle
Vitaliy Kuznetsov
5 (2)
The indicator searches for impulse candles and displays them on the chart. It includes a shadow filter. It also finds breakout levels of Bollinger Bands. You can enable multi-currency dashboard in the settings. Alerting choose between the current chart or the entire list. Blog-Link -  Retest and Fake Breakout with UPD1 Trading patterns: Trend retest. False Breakout. Others. EURUSD, GBPUSD, XAUUSD, ... M15, M30, H1. Input parameters. Basic. Bars Count - the number of history bars on which th
The indicator builds a three-period semaphore and reversal pattern 123 from the extremum. The signal comes at the opening of the second candle. This pattern can be traded in different ways (test point 3, breakout and others). Exit from the channel or breakout of the trendline is the main trigger for finding an entry point. Icons are colored according to Fibonacci levels. Yellow icons indicate a test of a level at which the signal is amplified. Using the multi-currency dashboard, you can track w
UPD1 Volume Pixel
Vitaliy Kuznetsov
5 (4)
The indicator finds the low, high, extreme volume based on the specified coefficients and paints them in the specified colors. This replaces the standard volume drawing function in the metatrader terminal. Bars can also be painted in the color of the volume. On bars with extreme volume, the maximum horizontal volume (cluster/POC) is determined. Depending on its location (pushing, neutral, stopping), the cluster also has its own color. If the cluster is in the shadow, and the bar has an extreme
UPD1 Pin Bar Dashboard
Vitaliy Kuznetsov
5 (3)
An indicator that displays the Pin Bar candlestick pattern. With the help of coefficient settings, the ratio of shadow, body and size is easily adjusted. It is possible to filter by trend (2 moving averages) and by reversal (RSI and Bollinger Bands). This is the most popular price action pattern. A multi-currency dashboard is available. With it, you can easily switch between charts. Trading Patterns: Retest by trend. False breakout. Other. EURUSD, GBPUSD, XAUUSD, ... M15, M30, H1. Input para
The indicator displays the "Rails" pattern on the chart. This pattern consists of two multidirectional candles with identical bodies and small shadows. If on the current timeframe the pattern "Rails", then on the x2 timeframe it will look like a Pin Bar (Doji). This indicator was created to automatically find the pattern in the most efficient way with logically simple settings that you can easily change. There is an option to filter by trend (2 moving averages) and reversal (RSI and Bollinger B
The meaning of this indicator is to   find Murray levels on all timeframes   and combine them into   combo levels , including signal levels based on strong Murray levels (+2, +1, 8, 4, 0, -1, -2). The lower the timeframe, the more chances you have to see the combo level immediately. It will be highlighted in color. When you hover over any number, a hint will pop up to which timeframe the level belongs to. But you will always see the current timeframe as the leftmost one. A  smart alert  will hel
The indicator builds a three-period semaphore and reversal pattern 123 from the extremum. The signal comes at the opening of the second candle. This pattern can be traded in different ways (test point 3, breakout and others). Exit from the channel or breakout of the trendline is the main trigger for finding an entry point. Icons are colored according to Fibonacci levels. Yellow icons indicate a test of a level at which the signal is amplified. Using the multi-currency dashboard, you can track w
Filter:
No reviews
Reply to review