Retest Trading Theory
Let's decide on the designation of what a retest is.
This concept is directly related to levels.
Let's go gradually. First, let's define what a level test is.


If we get a reaction (bounce) from the top of the chart ( High), then we see a test of the level. In this case, the level is called resistance.
If there is a low test, then this level is support.
The more touches, the stronger the potential retest pattern in the future.


This is followed by a breakout of the level. And pay attention to the breakout candle.
It should be preferably a large ( impulse) candle that closes behind the level.


The culmination will be a level test from the back. This is a retest.
Perhaps a good retest should not be too small or too large.
Fast tests and too sweeping tests can turn out to be a fake breakout.
Analyze the graphics, find working examples and define the concept - good retest.


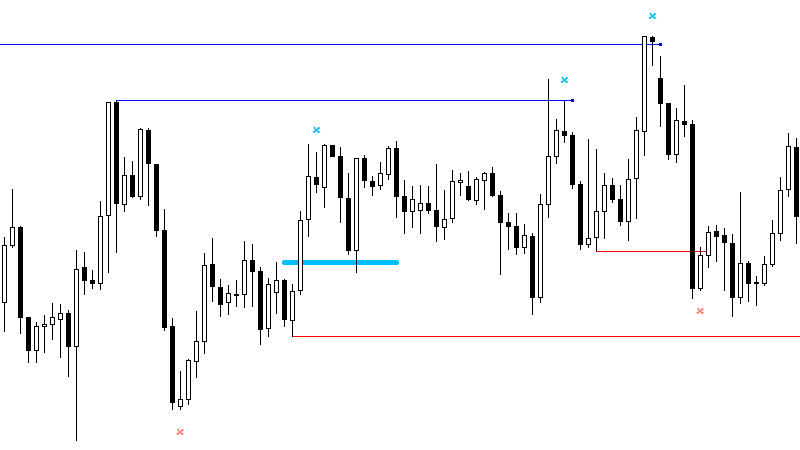
If a fractal level is broken by an impulse movement, then we consider it an impulse level.


Schematic representation in the figure. And don't trade level breakouts. Wait for retest.


The chart shows the UPD1 Impulse Level indicator. The cross shows the end of the impulse.
Rectangles are drawn on the breakout of fractal levels.


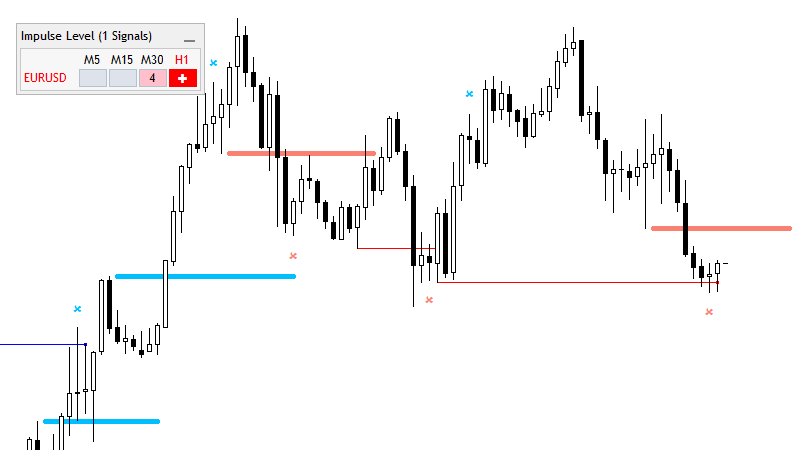
With the help of a dashboard, you can follow the incoming signals.
A cross signal indicating the end of an impulse is formed as a fractal.
As soon as the candle to the right has closed, we get a signal.
This allows us to analyze the situation in a timely manner.

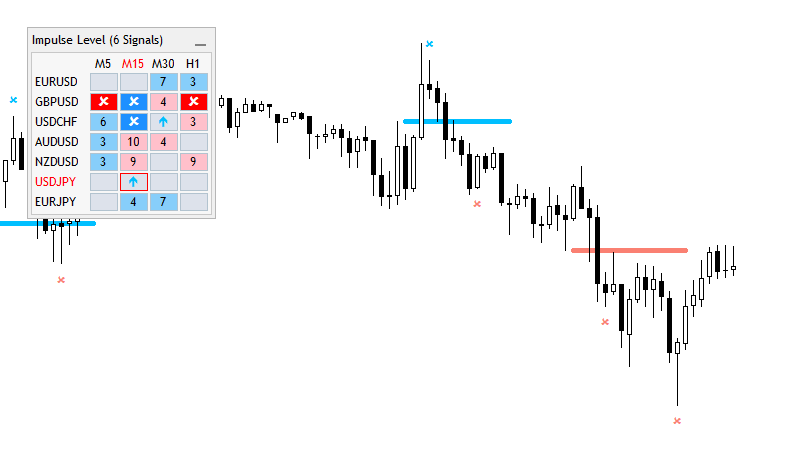
An arrow signal shows us that we are in impulse motion. Clicking on the dashboard automatically switches charts.

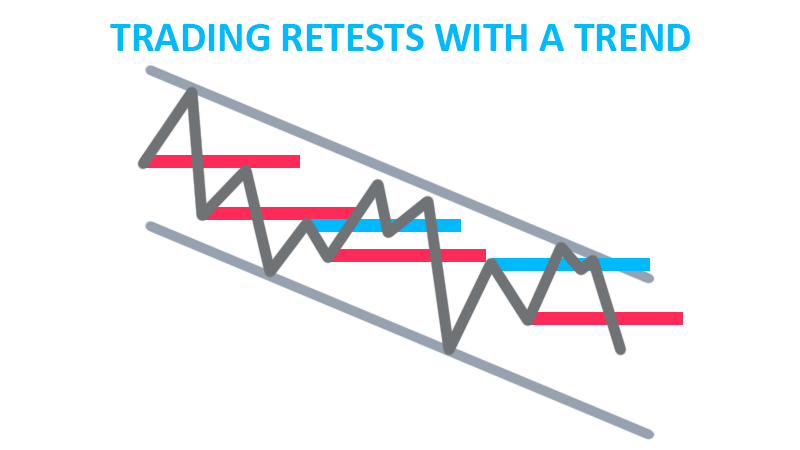
If the entry point is on the border of the channel against its slope, then we skip such an entry point.
Trade with the trend!
After a channel breakout, it is allowed to look for an entry point against the trend.

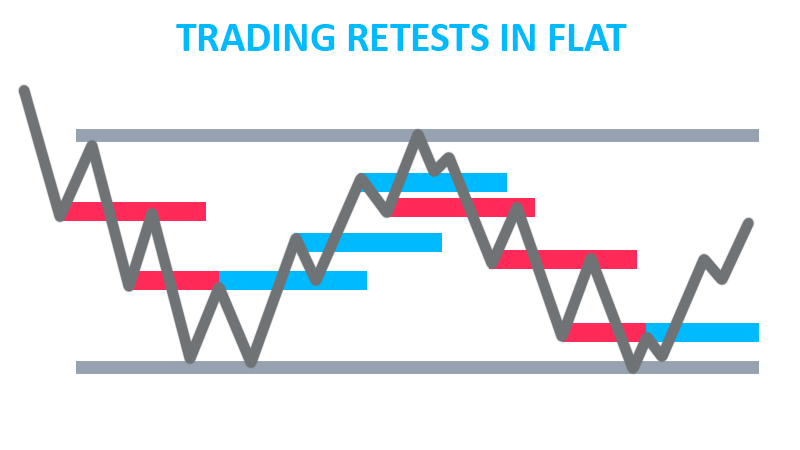
If the price is in a visible horizontal range (box), then do not trade on the edge, fake breakouts often occur there.
If the price has confidently broken through the box and made a retest, then this is a good pattern.

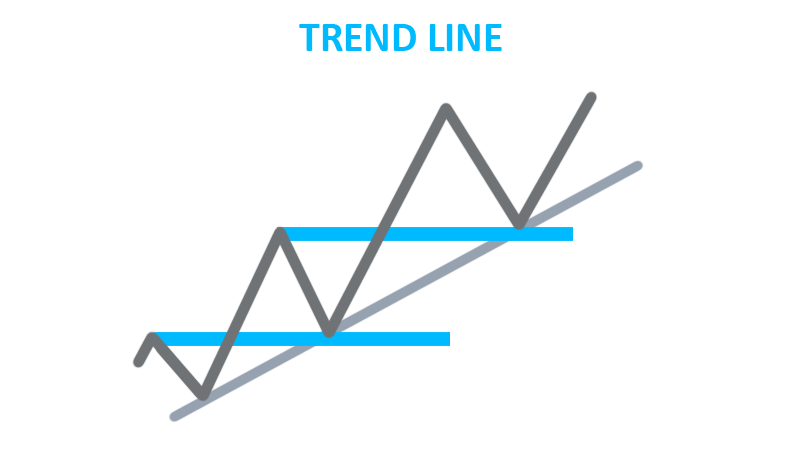
The presence of an entry point on a trend line is an amplifying signal.

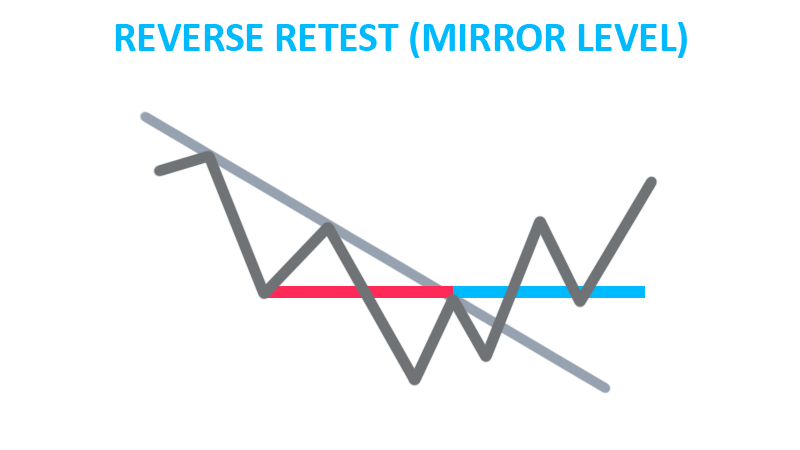
A reverse retest is also a good pattern if the price has fixed behind a broken trend line / channel.
Quite often, this pattern looks like a head and shoulders / double bottom / mirror level / RU3 (TS Sniper).


Divergence - movement fading, trend weakening.
Therefore, trading retests along the trend should be careful or excluded.

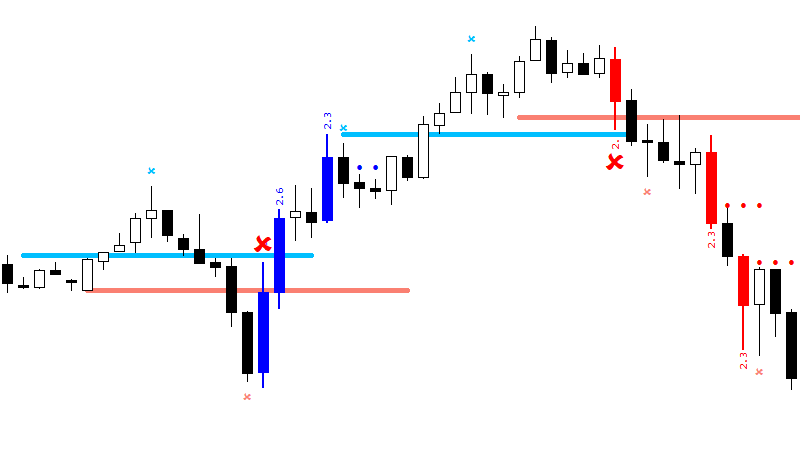
Also, do not trade against a large (impulse) candle. This could be the start of a new trend movement.
On the chart, such candles are shown in red and blue (indicator UPD1 Impulse Candle)

Displaying impulse candles allows you to better see the picture of trend movements.
The levels (dots) that appear from impulse candles can also be used for retests.


Dotted levels are formed at the places where the impulse candlestick broke through the Bollinger bands.
It is a very popular indicator used by thousands of traders. Therefore, these bands breakdown sites carry a high volume ( cluster).


The further the candle closes after the breakout, the more significant the resulting level.

Fake Breakout Trading Theory

A fake breakout is a breakout and level return.
This usually happens quickly, but there are also complex breakouts in the form of price files.
This formation often occurs in flat.
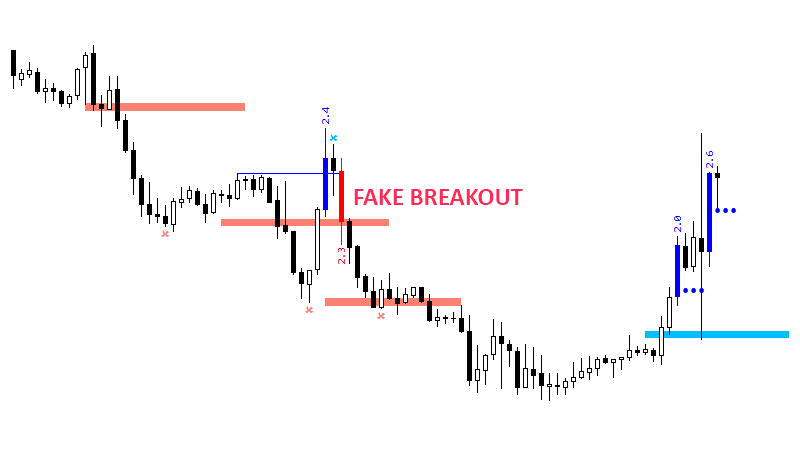
The picture shows two simple and one complex false breakout.


A fake breakout with a trend is rare, but it is a stable good pattern.

Using the indicator UPD1 Impulse Level, you can easily find a fake breakout pattern.
For this purpose, a separate module has been made in the new version 3 of the indicator.
If the impulse ends behind the fractal level, then a thin level line is displayed.
In the multi-currency dashboard, instead of "x" there will be "+"
It is advisable to trade on trend or against trend with a small take profit up to the border of the visible channel.

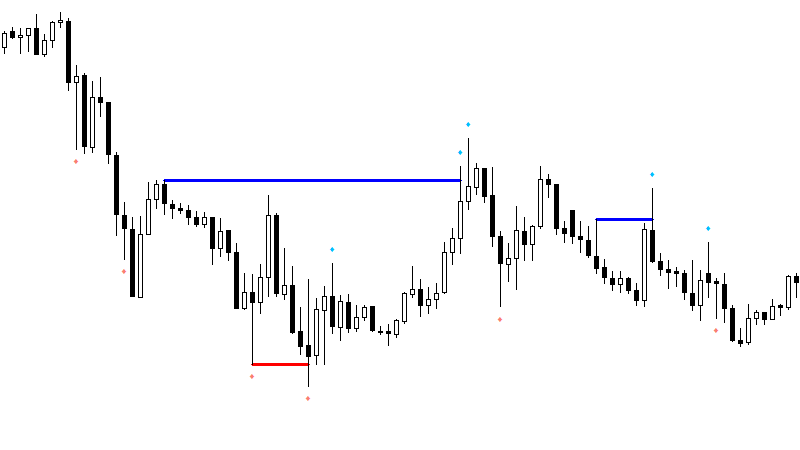
Fake breakout patterns work well on horizontal flat borders.
Moreover, if we do not see impulse levels, then a flat is formed.

When the indicator detects a potential false breakdown, there will be a "+" signal in the dashboard.


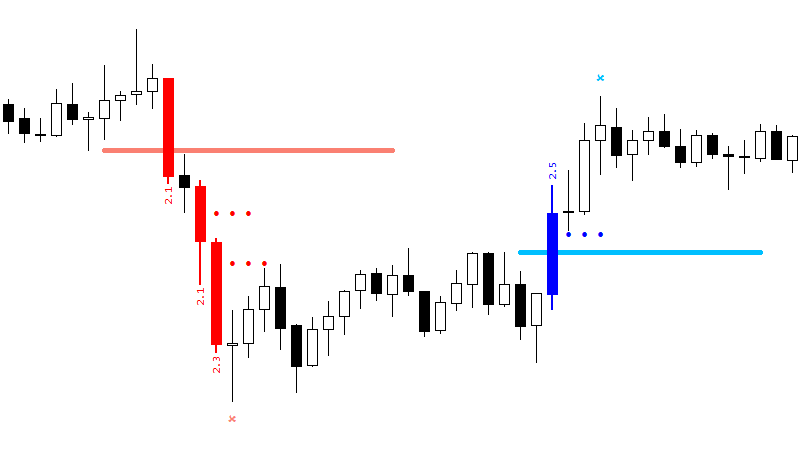
We can also find fake breakouts using the UPD1 impulse Candle indicator.
If we break through the level with an impulse candlestick and then return beyond the level with an impulse candlestick, then we have a fake breakout.


Possible different variations of the pattern.
The presence of a small candlestick between impulse candles strengthens the pattern.
Trading along the trend or at the channel border inward.


On the chart, examples of trading patterns at the borders of the box inward.

The chart shows a good example of a fake trend breakout. Moreover, it can be seen in two indicators at once.

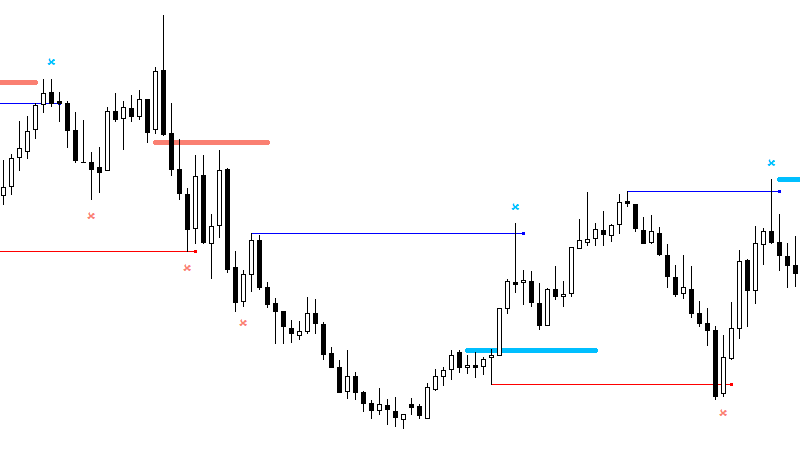
Another way to find a false breakout is shadows. The UPD1 Impulse Shadow indicator will help us in this.
The rules are the same, we are looking for patterns in a wide flat and on trend.

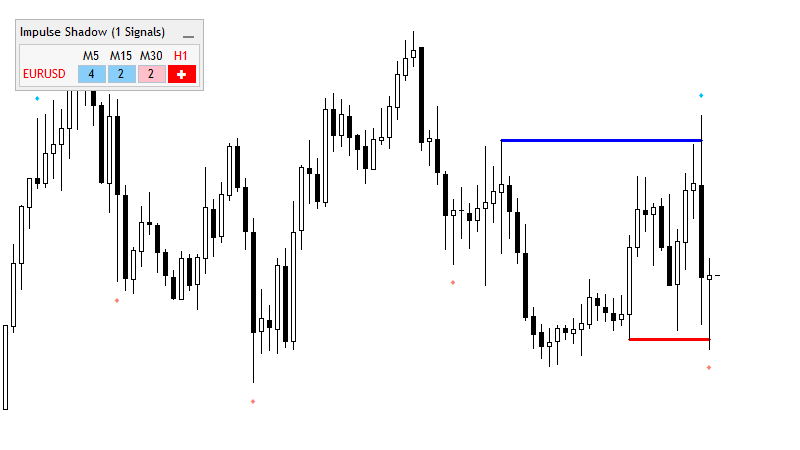
If the shadow has crossed the fractal, then we will see the "+" icon in the multi-currency dashboard.
The numbers show how many candles have passed after the signal.

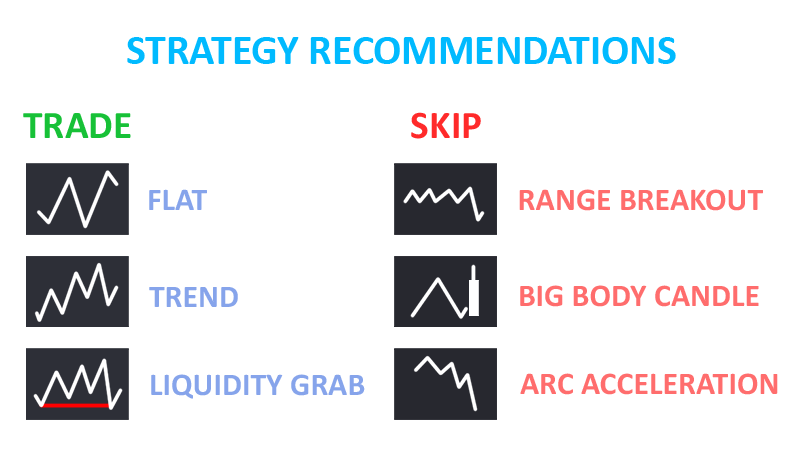
According to the strategy, it is more important to understand which signals we should skip.
For example, an exit from a narrow accumulation can create a recoilless movement, as well as a large candle and arc acceleration

By correctly combining the market structure / context, retest and false breakout signals, you can come to a profitable trade.
Any skill must be practiced. Find beautiful patterns and avoid sloppy ones. This is what distinguishes the trader from the machine.

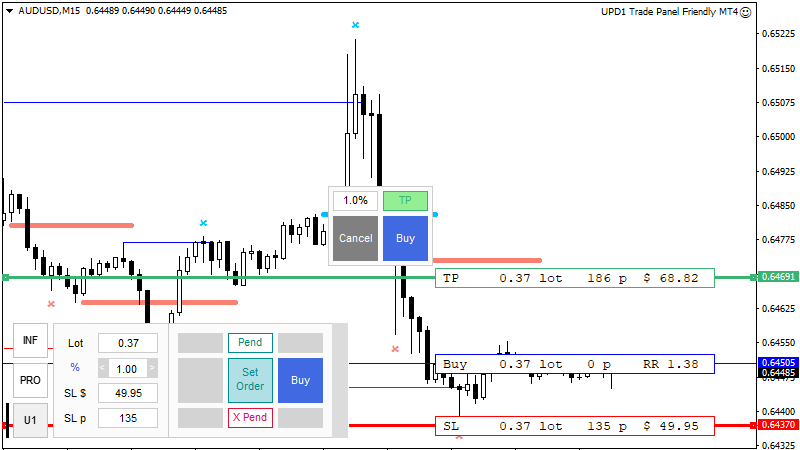
Control risks using the utility UPD1 Trade Panel Friendly MT4