UPD1 Engulfing Dashboard
- Indicators
-
Vitaliy Kuznetsov
 UPD1 MT4 Indicators - https://www.mql5.com/en/market/mt4/indicator?filter=UPD1
Levels
Patterns
Volume
Money Management - Version: 3.82
- Updated: 1 January 2025
- Activations: 20
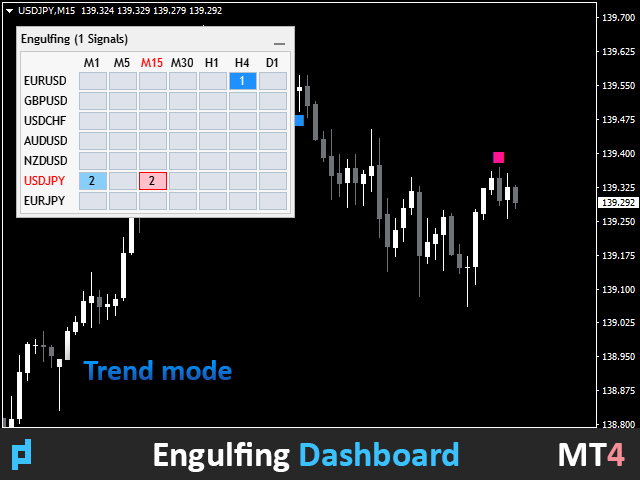
An indicator that displays the Engulfing candlestick pattern. In the settings, you can specify the type of engulfing (body, shadow and combination).
It is possible to filter by trend (2 moving averages) and by reversal (RSI and Bollinger Bands).
This is a very popular price action pattern.
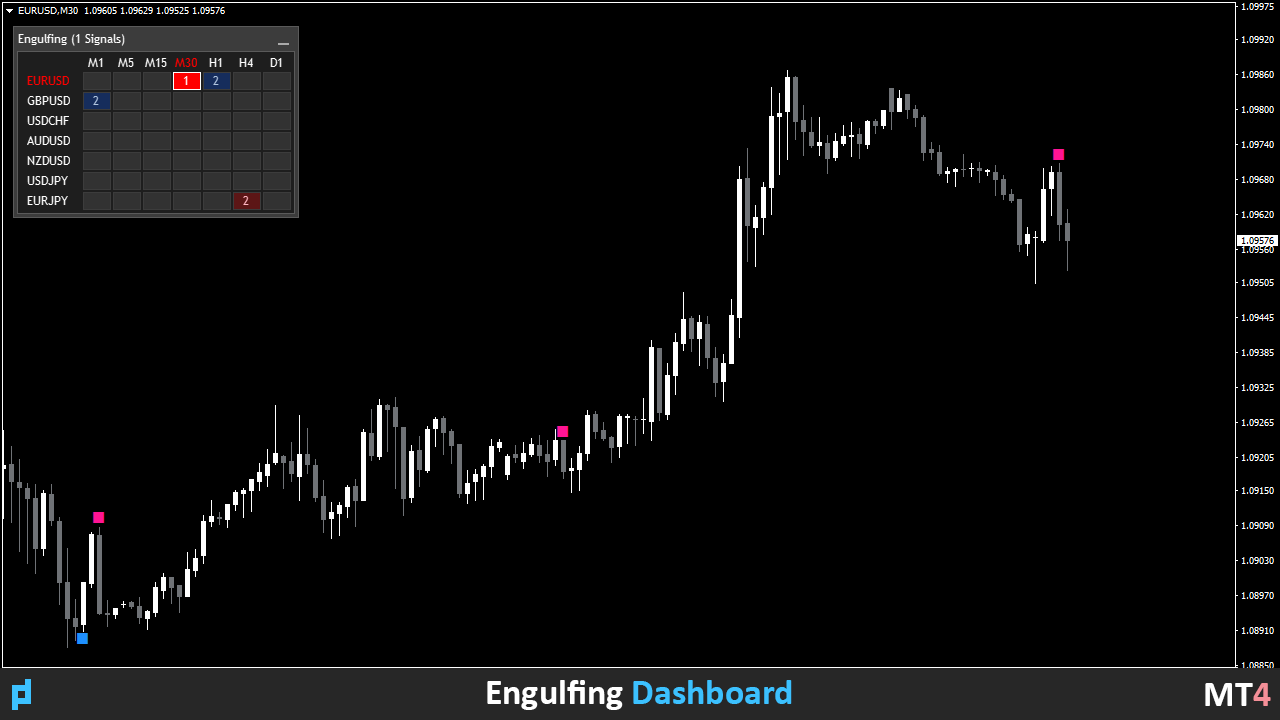
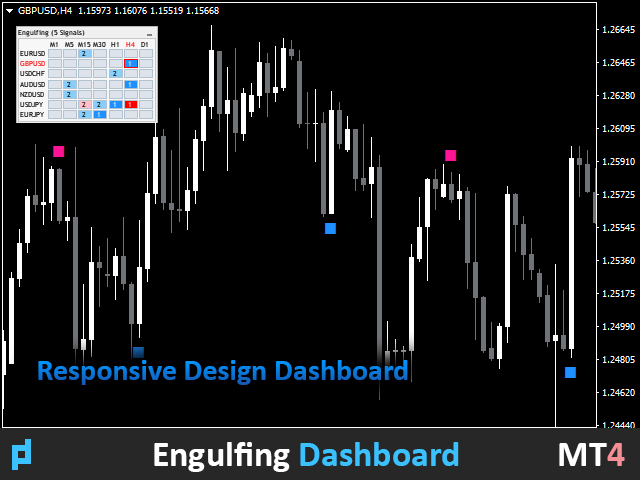
A multi-currency dashboard is available. With it, you can easily switch between charts.
Trading Patterns:
- Retest by trend.
- False breakout.
- Order Block.
- Other.
EURUSD, GBPUSD, XAUUSD, ...
M15, M30, H1.
Input parameters.
Main.
Bars Count – the number of history bars on which the indicator will work.
Calc Mode – choose a type of engulfing.
3 Lines Strike (Close overlap First Open).
PPR (Close overlap High).
High overlap High.
Close overlap Open.
High and Close overlap High and Open.
High-Low overlap High-Low.
Body Candle overlap Body Candle.
Body Candle and High-Low overlap Body Candle and High Low.
Filters.
Candles On Filter – which candle does the filter take.
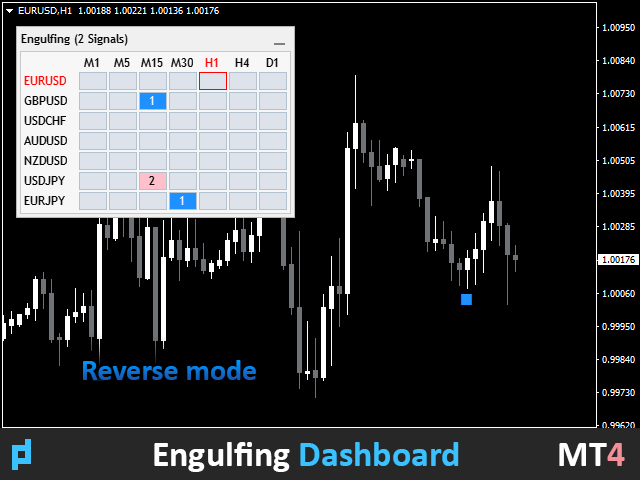
Filter 2 Trend And Reverse – enable/disable the trend filter, reverse or both.
Trend – trend filter based on 2 moving averages.
Reverse – filter by the RSI oscillator (enabled by default).
Trend And Reverse – both modes are enabled and work independently of each other at the same time.
Filter 3 Bollinger Bands – enable/disable the Bollinger Bands filter. It acts as a final filter, filtering out all previous settings.
Trend Filter Settings.
2 MA On Chart – display moving averages. Disabled by default. But if the filter is enabled and the display is enabled, then you can see which Engulfing are selected and why.
Period MA1 – selecting the period of the first moving average.
Period MA2 – selecting the period of the second moving average.
Method MA – calculation method.
Applied Price MA – calculation price.
Reverse Filter Settings – filter settings by oscillator.
RSI Period – period of the oscillator.
RSI Level – the cutoff level (default is 30). The Engulfing is considered correct if the oscillator for the Sell Engulfing is above 70 (100-30), and for the Buy Engulfing below 30.
RSI Applied Price – calculation price.
Bollinger Bands Filter Settings.
MA Period.
MA Price.
MA Deviation.
MA Shift - offset.
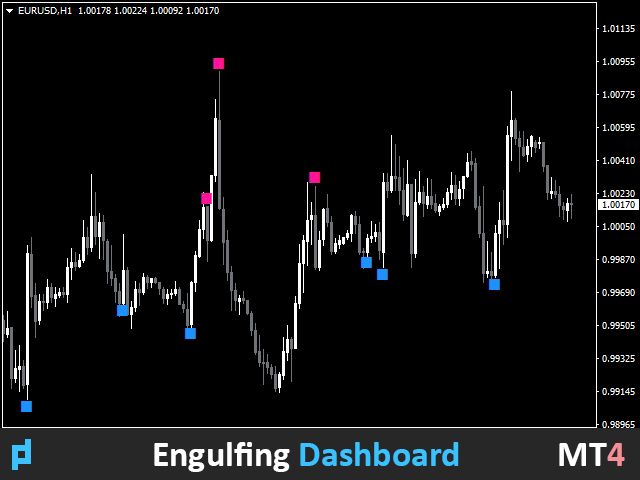
Visual Arrows.
Visual – visual display of the signal. You can choose arrows (Arrow) or a box of 3 candles (Box).
Bull Arrow Code – the code number of the Buy Engulfing icon.
Bull Color – the color of the Buy Engulfing icon.
Bear Arrow Code – the code number of the Sell Engulfing icon.
Bear Color – the color of the Sell Engulfing icon.
Style - the style of the frame lines, if the box display is selected (Visual = Box).
Indent Coeff – indent from the shadow by the volatility coefficient.
Size – icon size.
Dashboard.
Dashboard - enable / disable multicurrency dashboard.
Scan Bars - how many candles to monitor per history.
Dashboard Zoom % (0 -auto) - choose any zoom.
Color Theme - automatic or manual selection of the panel color theme (light and dark).
Symbol Lyst - write down the instruments to be monitored.
View M1-MN - enter the timeframes to be monitored.
Alert Settings.
Alert - enable / disable notification settings.
Current Chart – alert only on the current chart, ignoring dashboard signals.
Dashboard List – alert when new signals appear in the dashboard.
Alert Work Time - specify the time period when the alert will be active.
Alert Pop Up - enable / disable alert popup.
Alert Push - enable / disable notification to phone.
Alert E-mail - enable / disable email notification.
Alert Sound - enable / disable sound notification.
Alert Sound Name - select sound alert file.