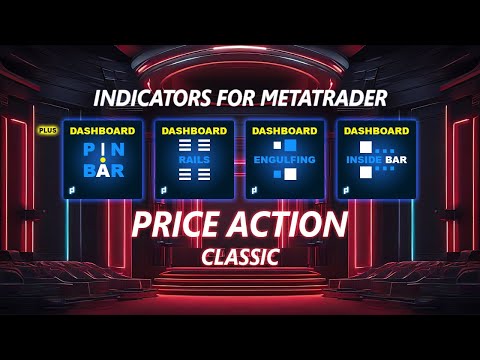
UPD1 Rails Dashboard
- Indicators
-
Vitaliy Kuznetsov
 UPD1 MT4 Indicators - https://www.mql5.com/en/market/mt4/indicator?filter=UPD1
Levels
Patterns
Volume
Money Management - Version: 3.82
- Updated: 1 January 2025
- Activations: 20
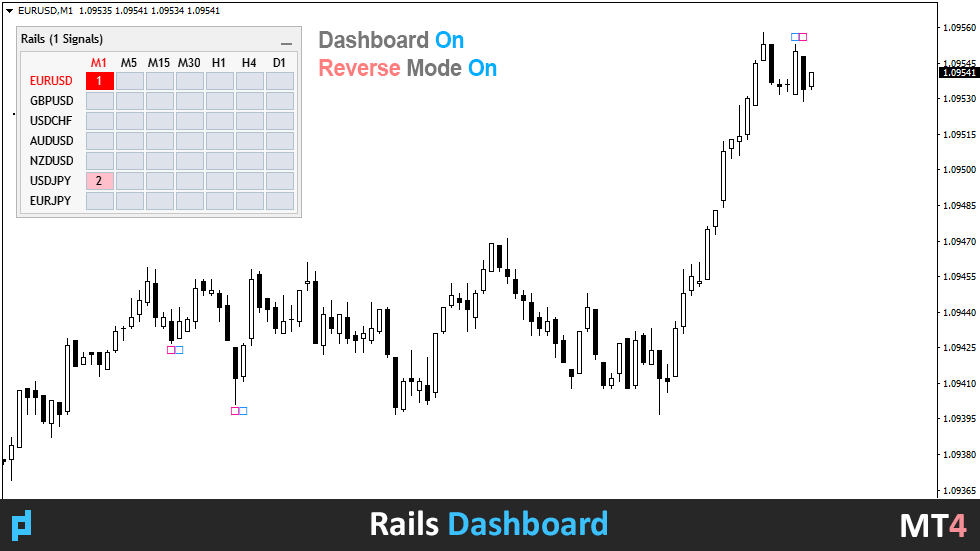
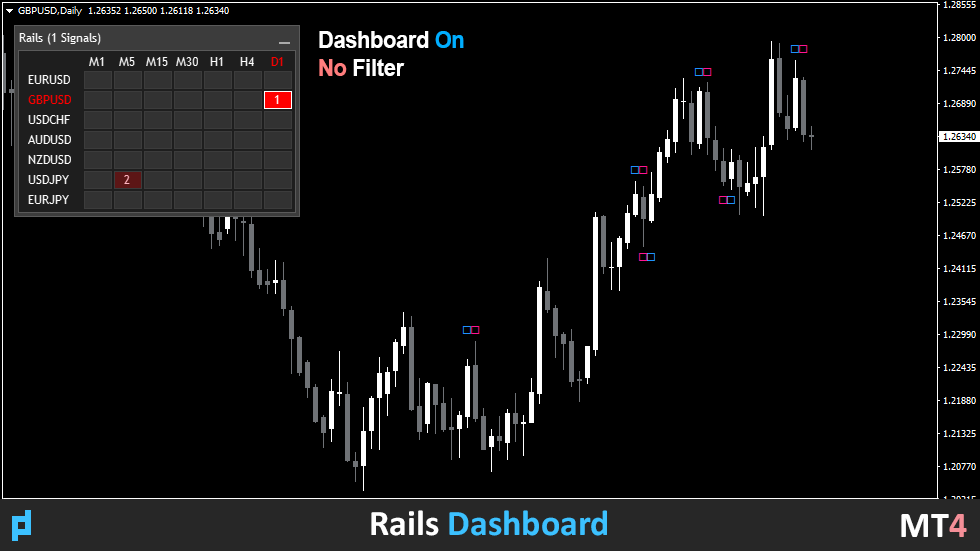
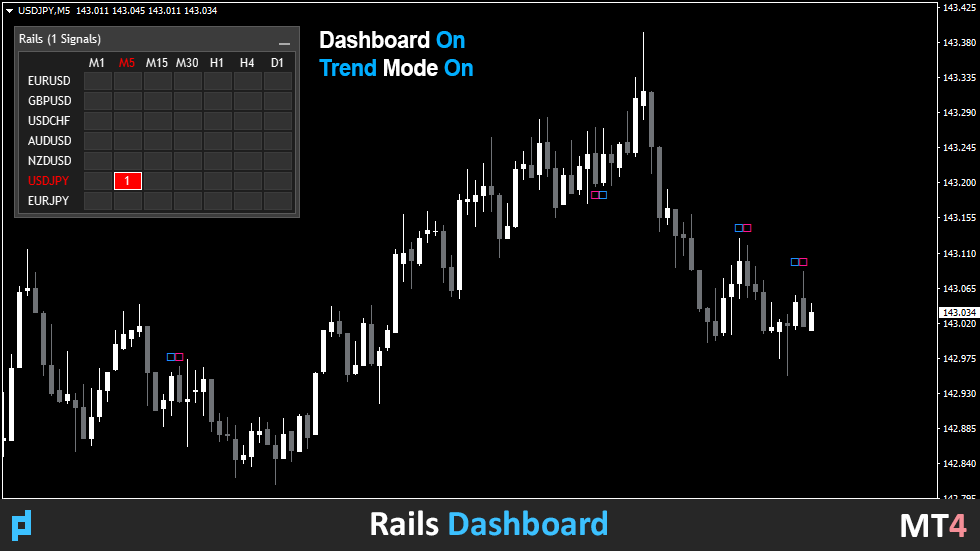
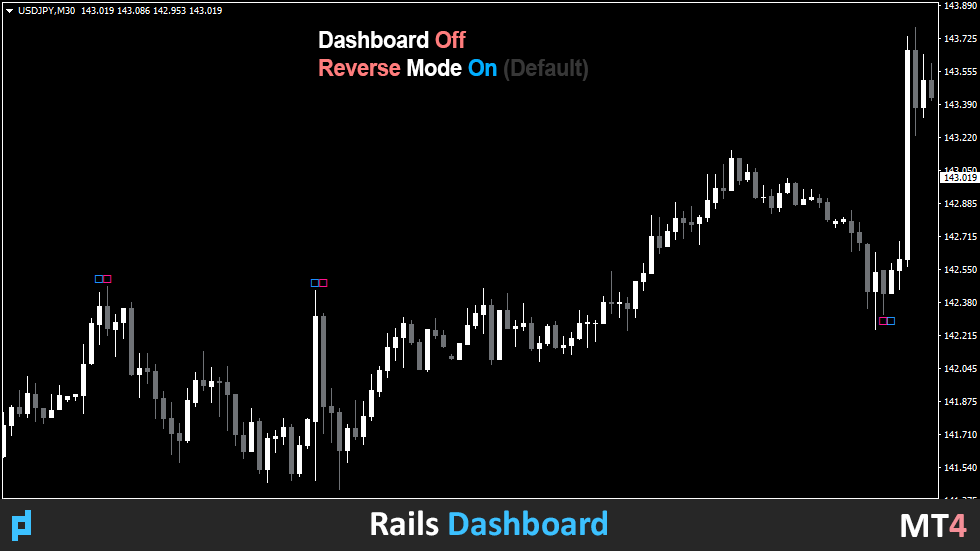
The indicator displays the "Rails" pattern on the chart. This pattern consists of two multidirectional candles with identical bodies and small shadows.
If on the current timeframe the pattern "Rails", then on the x2 timeframe it will look like a Pin Bar (Doji).
This indicator was created to automatically find the pattern in the most efficient way with logically simple settings that you can easily change.
There is an option to filter by trend (2 moving averages) and reversal (RSI and Bollinger Bands).
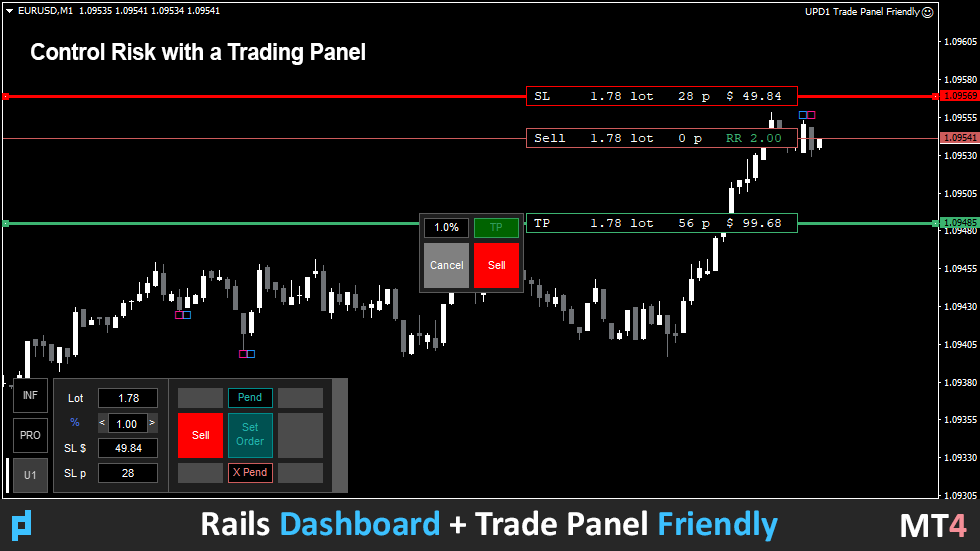
Multicurrency panel is available. With its help you can easily switch between charts.
Trading patterns:
- Trend retest.
- False Breakout.
- Others.
EURUSD, GBPUSD, XAUUSD, ...
M15, M30, H1.
Input parameters.
Basic.
Bars Count - the number of history bars on which the indicator will work.
Max Candles Shadows / Body Ratio - the maximum ratio of the shadow to the candle body. If the shadow is greater than the specified value, such candle is ignored. The formula is (HL-OC)/OC.
Max Delta OC Ratio - maximum divergence between open/close prices. 0,1 - 10%. Do not set it higher than 0.3, the rails will cease to exist.
Calc HL Candles - how many candles we count to determine the average candle size.
Minimal Rails Ratio - the minimum ratio of the candle size in the rails pattern to the average of the specified candles. I.e. if the ratio is 1 - the rail candle cannot be smaller than the average value of the last 10 candles, and if the ratio is 2, it must be at least 2 times larger. Simply put, we weed out the very small rails and leave the larger ones. Since the rail pattern should stand out with rather large candlesticks, I consider the minimum ratio to be 0.8.
Filters.
Filter 1 Trend And Reverse - enable/disable the filter of trend, reverse or both.
Trend - filter by trend based on 2 moving averages.
Reverse - filter by RSI oscillator (enabled by default).
Trend And Reverse - both modes are enabled and work independently of each other, simultaneously.
Filter 2 Bollinger Bands - enable/disable the Bollinger Bands filter. It acts as a final filter, pre-filtering all previous settings.
Trend filter settings.
2 MA On Chart - display moving averages. By default it is off. But if the filter is enabled and display is on, you will be able to see which Rails are selected and why.
Period MA1 - select the period of the first moving average.
Period MA2 - selection of the period of the second moving average.
Method MA - calculation method.
Applied Price MA - calculation price.
Reversal filter settings.
RSI Period - oscillator period.
RSI Level - cutoff level. The Rails pattern is considered correct if the oscillator for Sell-Rails is above 70 (100-30) and for Buy-Rails is below 30.
RSI Applied Price - the calculation price.
Bollinger Bands settings.
MA Period - moving average period.
MA Price - price settings.
MA Deviation - deviation setting.
MA Shift - offset setting.
Icons Visual.
UP Rails Code - the code number of the Buy-Rails icon.
UP Candle Color - the color of the Buy-Rails.
DN Rails Code - code number of Sell-Rails icon.
DN Candle Color - color of Sell-Rails.
Indent Coeff - shadow indent on the volatility coefficient.
Size - size of the icon.
Dashboard.
Dashboard - enable / disable multicurrency dashboard.
Scan Bars - how many candles to monitor per history.
Dashboard Zoom % (0 -auto) - choose any zoom.
Color Theme - automatic or manual selection of the panel color theme (light and dark).
Symbol Lyst - write down the instruments to be monitored.
View M1-MN - enter the timeframes to be monitored.
Alert Settings.
Alert - enable / disable notification settings.
Current Chart – alert only on the current chart, ignoring dashboard signals.
Dashboard List – alert when new signals appear in the dashboard.
Alert Work Time - specify the time period when the alert will be active.
Alert Pop Up - enable / disable alert popup.
Alert Push - enable / disable notification to phone.
Alert E-mail - enable / disable email notification.
Alert Sound - enable / disable sound notification.
Alert Sound Name - select sound alert file.