UPD1 Pin Bar Dashboard
- Indicators
-
Vitaliy Kuznetsov
 UPD1 MT4 Indicators - https://www.mql5.com/en/market/mt4/indicator?filter=UPD1
Levels
Patterns
Volume
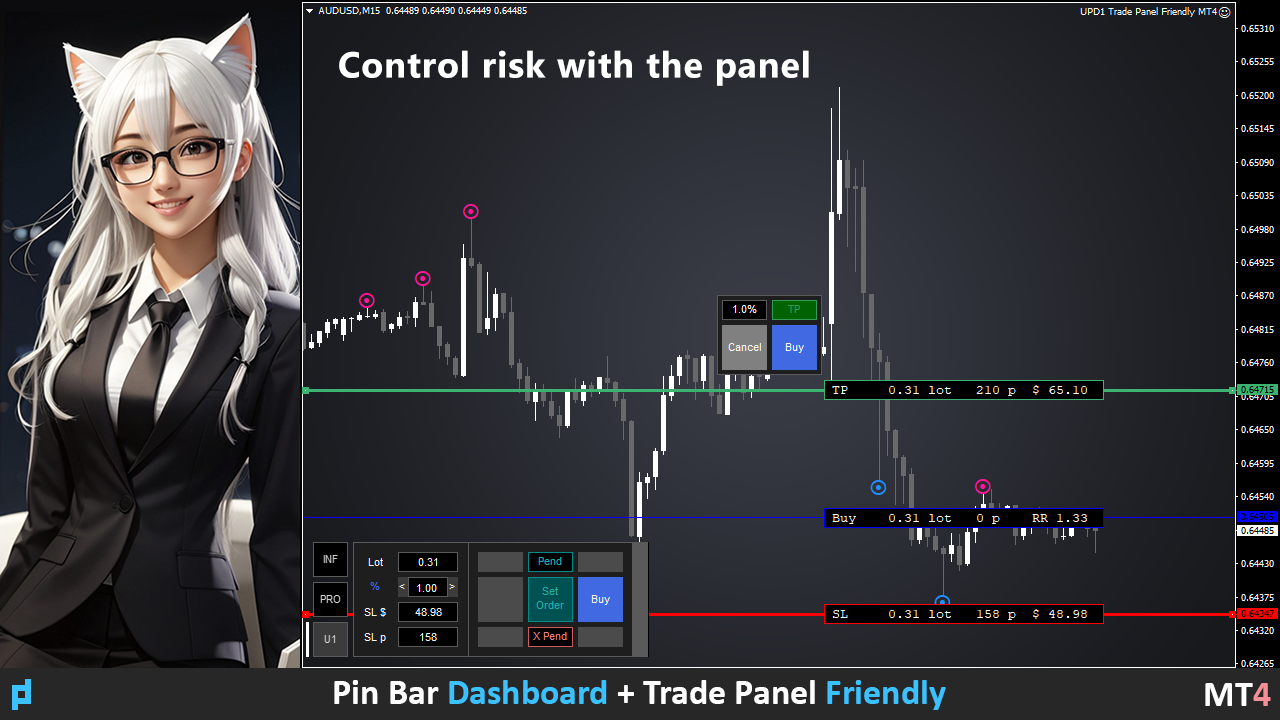
Money Management - Version: 3.82
- Updated: 1 January 2025
- Activations: 20
An indicator that displays the Pin Bar candlestick pattern. With the help of coefficient settings, the ratio of shadow, body and size is easily adjusted.
It is possible to filter by trend (2 moving averages) and by reversal (RSI and Bollinger Bands).
This is the most popular price action pattern.
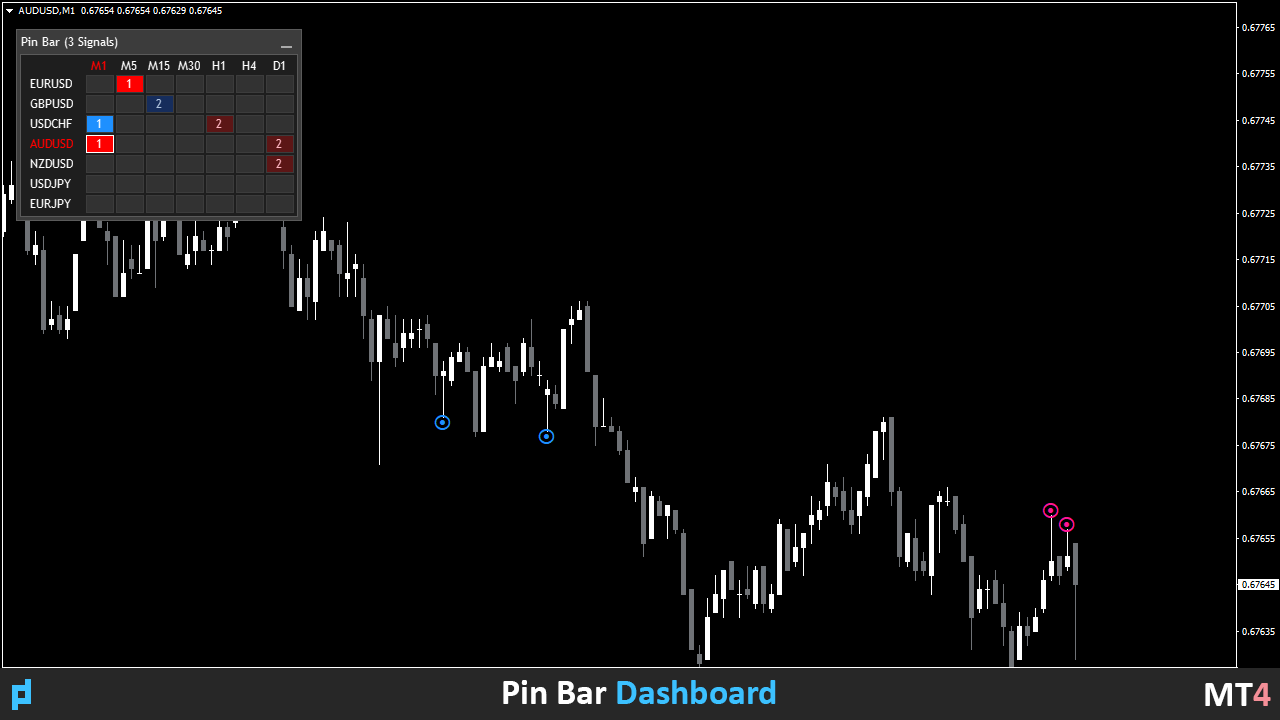
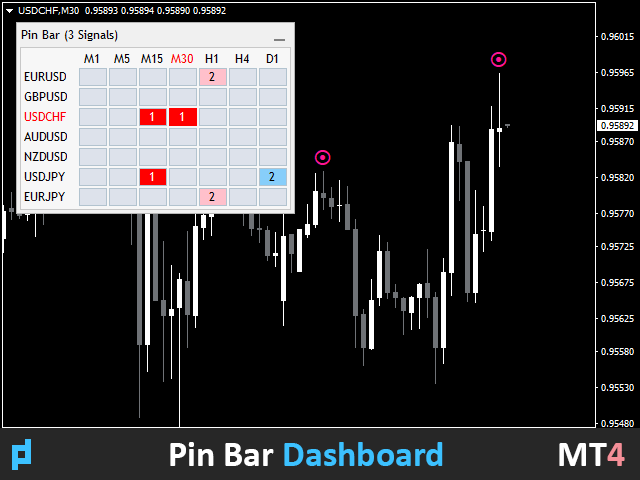
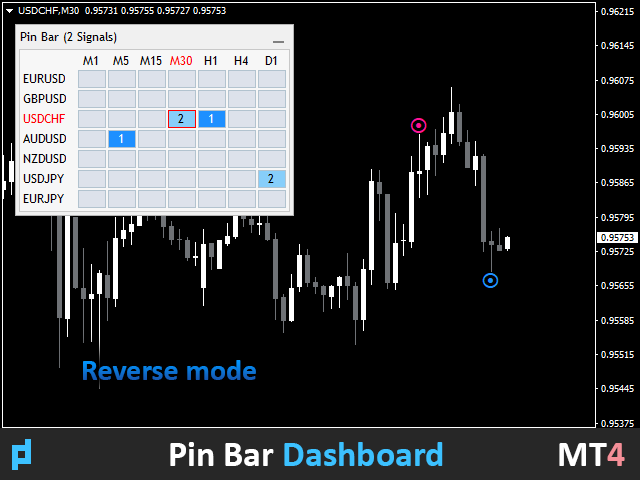
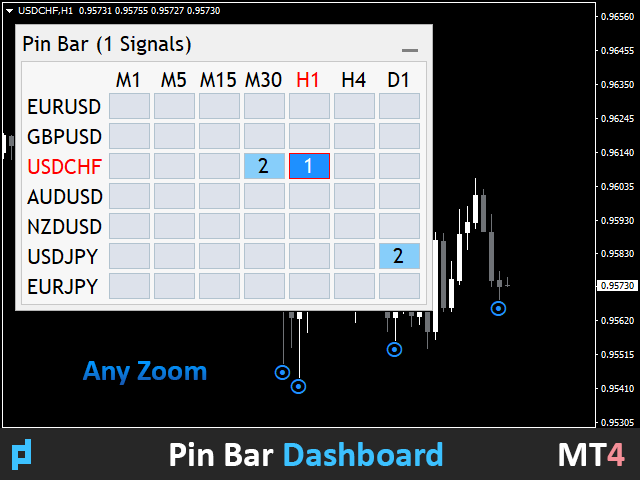
A multi-currency dashboard is available. With it, you can easily switch between charts.
Trading Patterns:
- Retest by trend.
- False breakout.
- Other.
EURUSD, GBPUSD, XAUUSD, ...
M15, M30, H1.
Input parameters.
Main.
Bars Count – the number of history bars on which the indicator will work.
Min Candles Shadows / Body Ratio – the minimum ratio of the shadow to the body of the candle. If the shadow is less than the specified value, then such a candle is ignored. Formula (HL-OC)/OC.
Min Shadows UP/DN Ratio – the minimum ratio of shadows from different sides of the candle. If the shadows on both sides are the same in length, then their ratio is 1.0, and we have a minimum of 1.5 set in the settings, so such a candle will be ignored. If you need more signals, then set the ratio to 1.0.
Calc HL Candles – how many candles we count to determine the average candle size.
Min PinBar HL Ratio - is the minimum ratio of the pinbar value to the average value of the specified candles. I.e., with a coefficient of 1, the pinbar cannot be less than the average value of the last 10 candles, and with a coefficient of 2 it must be at least 2 times higher. Simply put, we filter out very small pinbars and leave larger ones. I consider the coefficient 0.4 to be the minimum possible, and 0.8 is already large.
Filters.
Filter 1 Back Candle – filter by the previous candle. I.e. when enabled (by default), the Pin Bar should go beyond the high or low of the previous candle, depending on the direction of the largest tail of the shadow.
Filter 2 Trend And Reverse – enable/disable the trend filter, reverse or both.
Trend – trend filter based on 2 moving averages.
Reverse – filter by the RSI oscillator (enabled by default).
Trend And Reverse – both modes are enabled and work independently of each other at the same time.
Filter 3 Bollinger Bands – enable/disable the Bollinger Bands filter. It acts as a final filter, filtering out all previous settings.
Trend Filter Settings.
2 MA On Chart – display moving averages. Disabled by default. But if the filter is enabled and the display is enabled, then you can see which Pin Bars are selected and why.
Period MA1 – selecting the period of the first moving average.
Period MA2 – selecting the period of the second moving average.
Method MA – calculation method.
Applied Price MA – calculation price.
Reverse Filter Settings.
RSI Period – period of the oscillator.
RSI Level – the cutoff level (default is 30). The Pin Bar is considered correct if the oscillator for the Sell Pin Bar is above 70 (100-30), and for the Buy Pin Bar below 30.
RSI Applied Price – calculation price.
Bollinger Bands Filter Settings.
MA Period.
MA Price.
MA Deviation.
MA Shift - offset.
Visual Arrows.
UP Shadow Code – the code number of the Sell Pin Bar icon (large shadow at the top) from the standard set.
UP Shadow Color – the color of the Sell Pin Bar icon (large shadow at the top).
DN Shadow Code – the code number of the Buy Pin Bar icon (large shadow at the bottom) from the standard set.
DN Shadow Color – the color of the Buy Pin Bar icon (large shadow at the bottom).
Indent Coeff – indent from the shadow by the volatility coefficient.
Size – icon size.
Dashboard.
Dashboard - enable / disable multicurrency dashboard.
Scan Bars - how many candles to monitor per history.
Dashboard Zoom % (0 -auto) - choose any zoom.
Color Theme - automatic or manual selection of the panel color theme (light and dark).
Symbol Lyst - write down the instruments to be monitored.
View M1-MN - enter the timeframes to be monitored.
Alert Settings.
Alert - enable / disable notification settings.
Current Chart – alert only on the current chart, ignoring dashboard signals.
Dashboard List – alert when new signals appear in the dashboard.
Alert Work Time - specify the time period when the alert will be active.
Alert Pop Up - enable / disable alert popup.
Alert Push - enable / disable notification to phone.
Alert E-mail - enable / disable email notification.
Alert Sound - enable / disable sound notification.
Alert Sound Name - select sound alert file.

Приветствую, Виталий! Отличный индикатор, спасибо за проделанный труд!