UPD1 Semaphore 123 Dashboard MT5
- Indicators
-
Vitaliy Kuznetsov
 UPD1 MT4 Indicators - https://www.mql5.com/en/market/mt4/indicator?filter=UPD1
Levels
Patterns
Volume
Money Management - Version: 2.96
- Updated: 1 January 2025
- Activations: 20
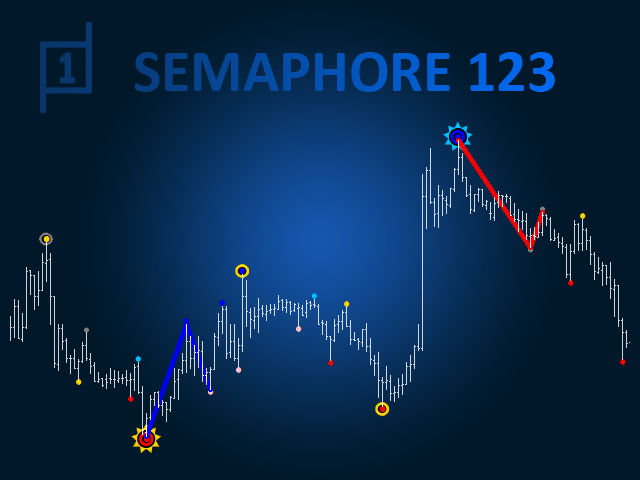
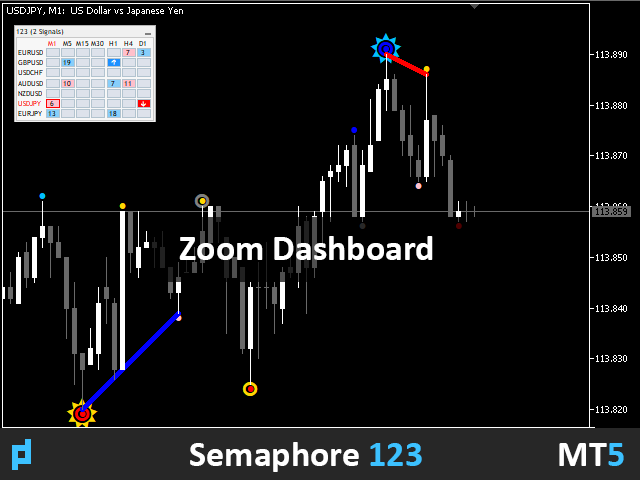
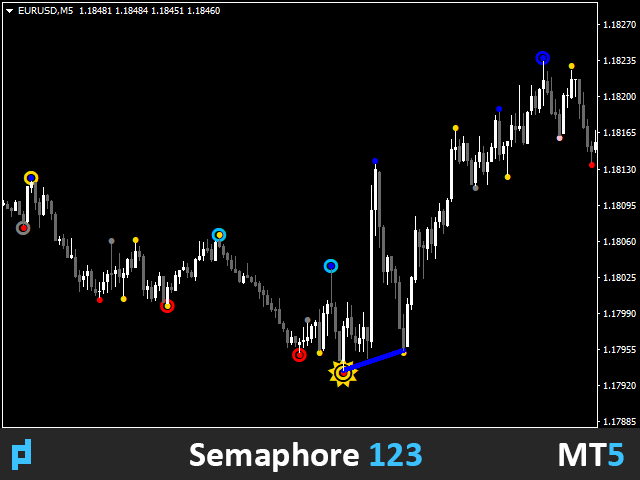
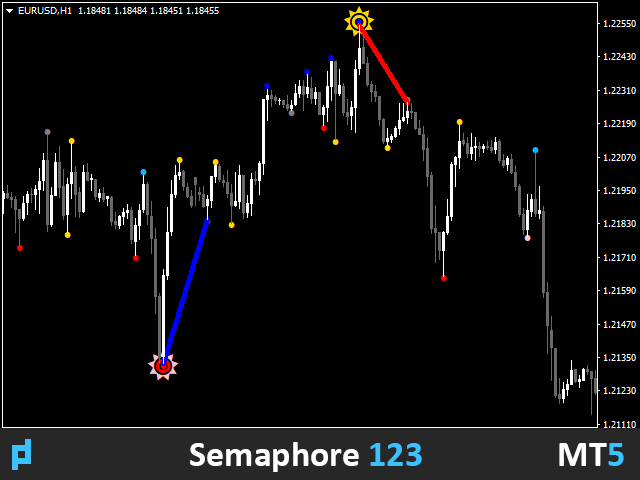
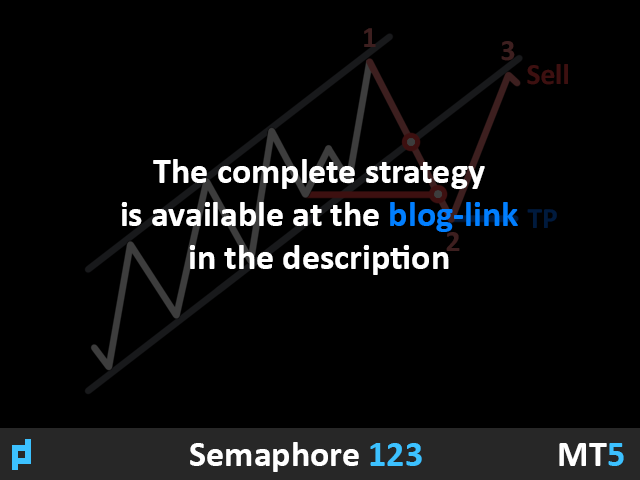
The indicator builds a three-period semaphore and reversal pattern 123 from the extremum. The signal comes at the opening of the second candle.
This pattern can be traded in different ways (test point 3, breakout and others). Exit from the channel or breakout of the trendline is the main trigger for finding an entry point.
Icons are colored according to Fibonacci levels. Yellow icons indicate a test of a level at which the signal is amplified.
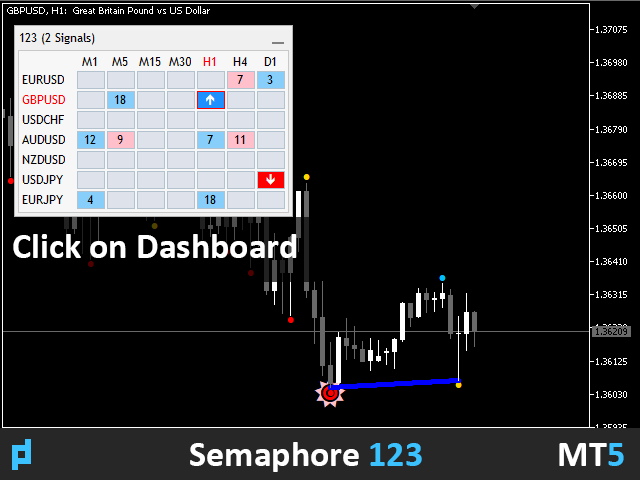
Using the multi-currency dashboard, you can track which currency pairs the 123 pattern was found on and how many bars have followed it.
Input parameters.
Bars Count - history to display.
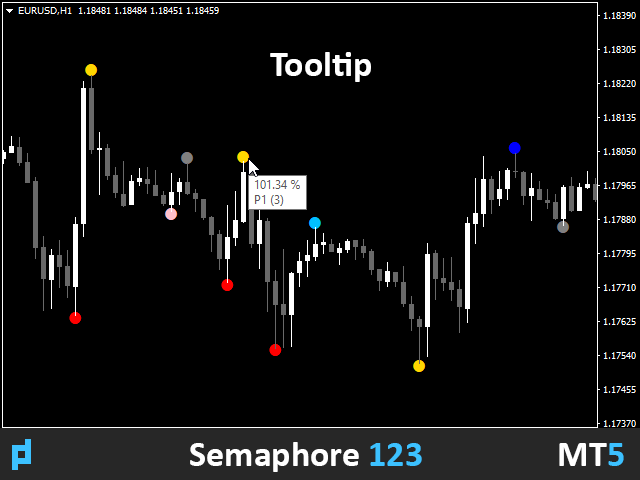
Tooltip - whether or not to show tooltips when hovering over an object.
Show Semaphore - enable, disable semaphore.
Show 123 - enable or disable the display of pattern 123.
Period 1, 2, 3 - semaphore period.
Period 1, 2, 3 Visual - enable, disable the display of a separate period.
Arrow Coeff Period - number of bars for calculation.
Arrow Coeff - the coefficient of the average candlestick value to form an indentation of icons.
Period 1, 2, 3 Arrow Code - code of the wingdings font icon.
Period 1, 2, 3 Arrow Size - size of arrows.
(<50; 50-76,4; 76,4 -123,6; 123,6-150) UP, DN - color by Fibonacci levels for arrows.
Draw Line Objects - select how to draw the pattern (1-3, 1-2-3, 1-2-3-4).
123 UP, DN Color - color of the 123 pattern line.
123 UP, DN Width - the thickness of the 123 pattern line.
Dashboard - enable, disable the multicurrency dashboard.
Scan Bars to 123 - how many bars in the history to track after the end of 123.
Dashboard Zoom % (0 - auto) - size of the dashboard in percent.
Color Theme - automatic or manual selection of the panel color theme (light and dark).
Symbol Lyst - enter the currency pairs to be monitored.
View M1-MN - enter the time periods to be monitored.
Alert - the main setting that enables the alert (Current Chart, Dashboard List).
Alert Work Time - Alert Work Time 00:00-23:59 (editable).
Alert Pop Up - enable, disable the pop up window.
Alert Push - enable, disable in-app notification.
Alert Email - enable, disable alert to email.
Alert Sound - enable or disable the sound.
Alert Sound Name - the sound file.
Indicator ID - enter a new value if you want to use more than 1 indicator on one chart.

It is hard to give a negative review for an indicator priced for all people. However, I have used it several days and I am not liking the way it works. All I see are colored dots. I would rather see a line or something designating it is time to take a trade and targets. Or maybe an arrow? This is my fourth 123 indicator I have tried. I dont know about other traders, but I have colors assigned in my head for Fibonacci numbers. And Fibonacci numbers are generally the same wherever I go. The Vendor uses colored bubbles to identify levels. Too confusing for me to have a bunch of repeating bubbles. Plus, using a yellow for designating 50 to 76.4 is confusing to me. Does that mean it goes to 50 or 76.4? The Vendor did allow for adding different equations for the 123. If you want to see only the 1, or the 2 or the 3, you can add or remove each step of the process. I dont regret purchasing it, but it isnt my cup of tea. It seems like it was more designed to show his skills/abilities, but not so much for me to trade by. .