Automatic Fibonacci Pivots
- Indicators
-
Martin Alejandro Bamonte
 With 24 years of trading experience and 14 years in programming, my journey has been one of constant learning. From an early age, I was fascinated by the challenge of understanding the markets, that unpredictable universe... It was then that I discovered how technology could translate complexity
 - Version: 1.0
Now free. The key Fibonacci pivot levels, drawn for you automatically every day,
on any timeframe.
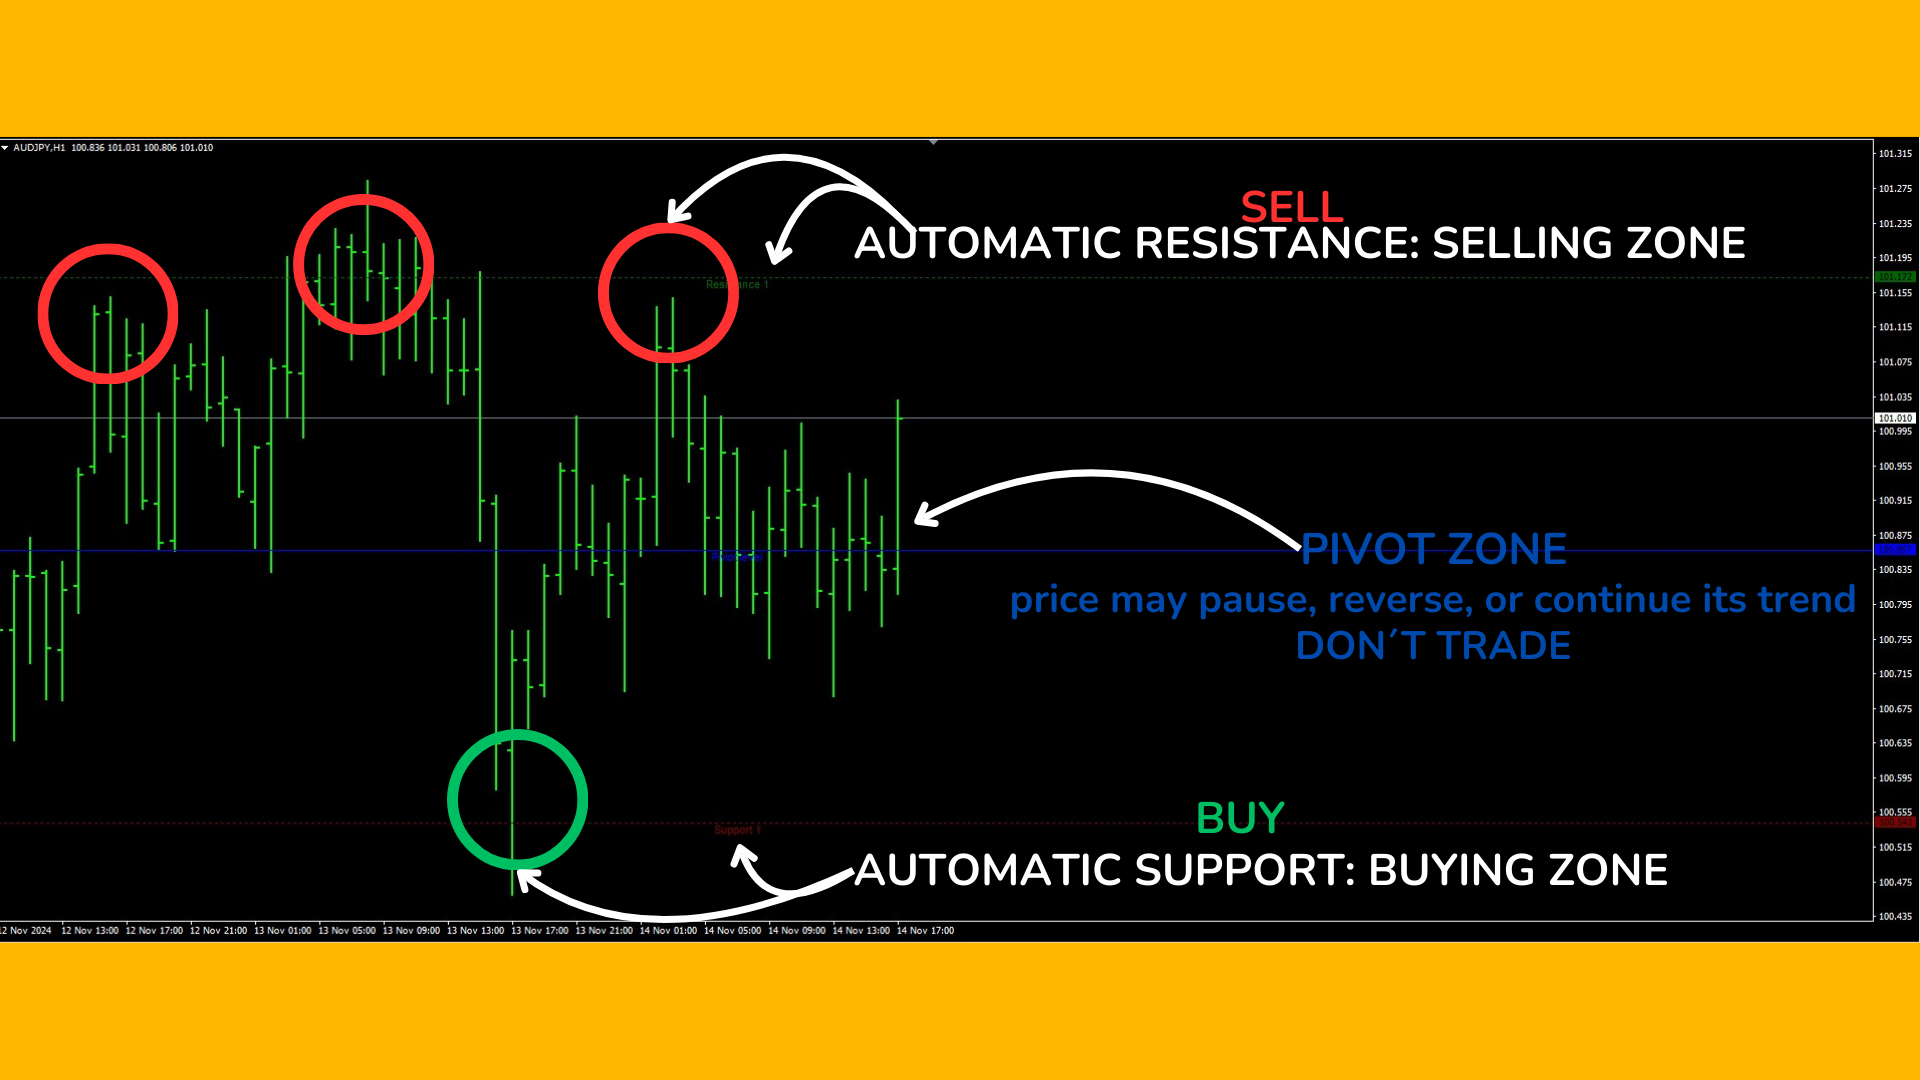
Automatic Fibonacci Pivots calculates the daily support and resistance from the
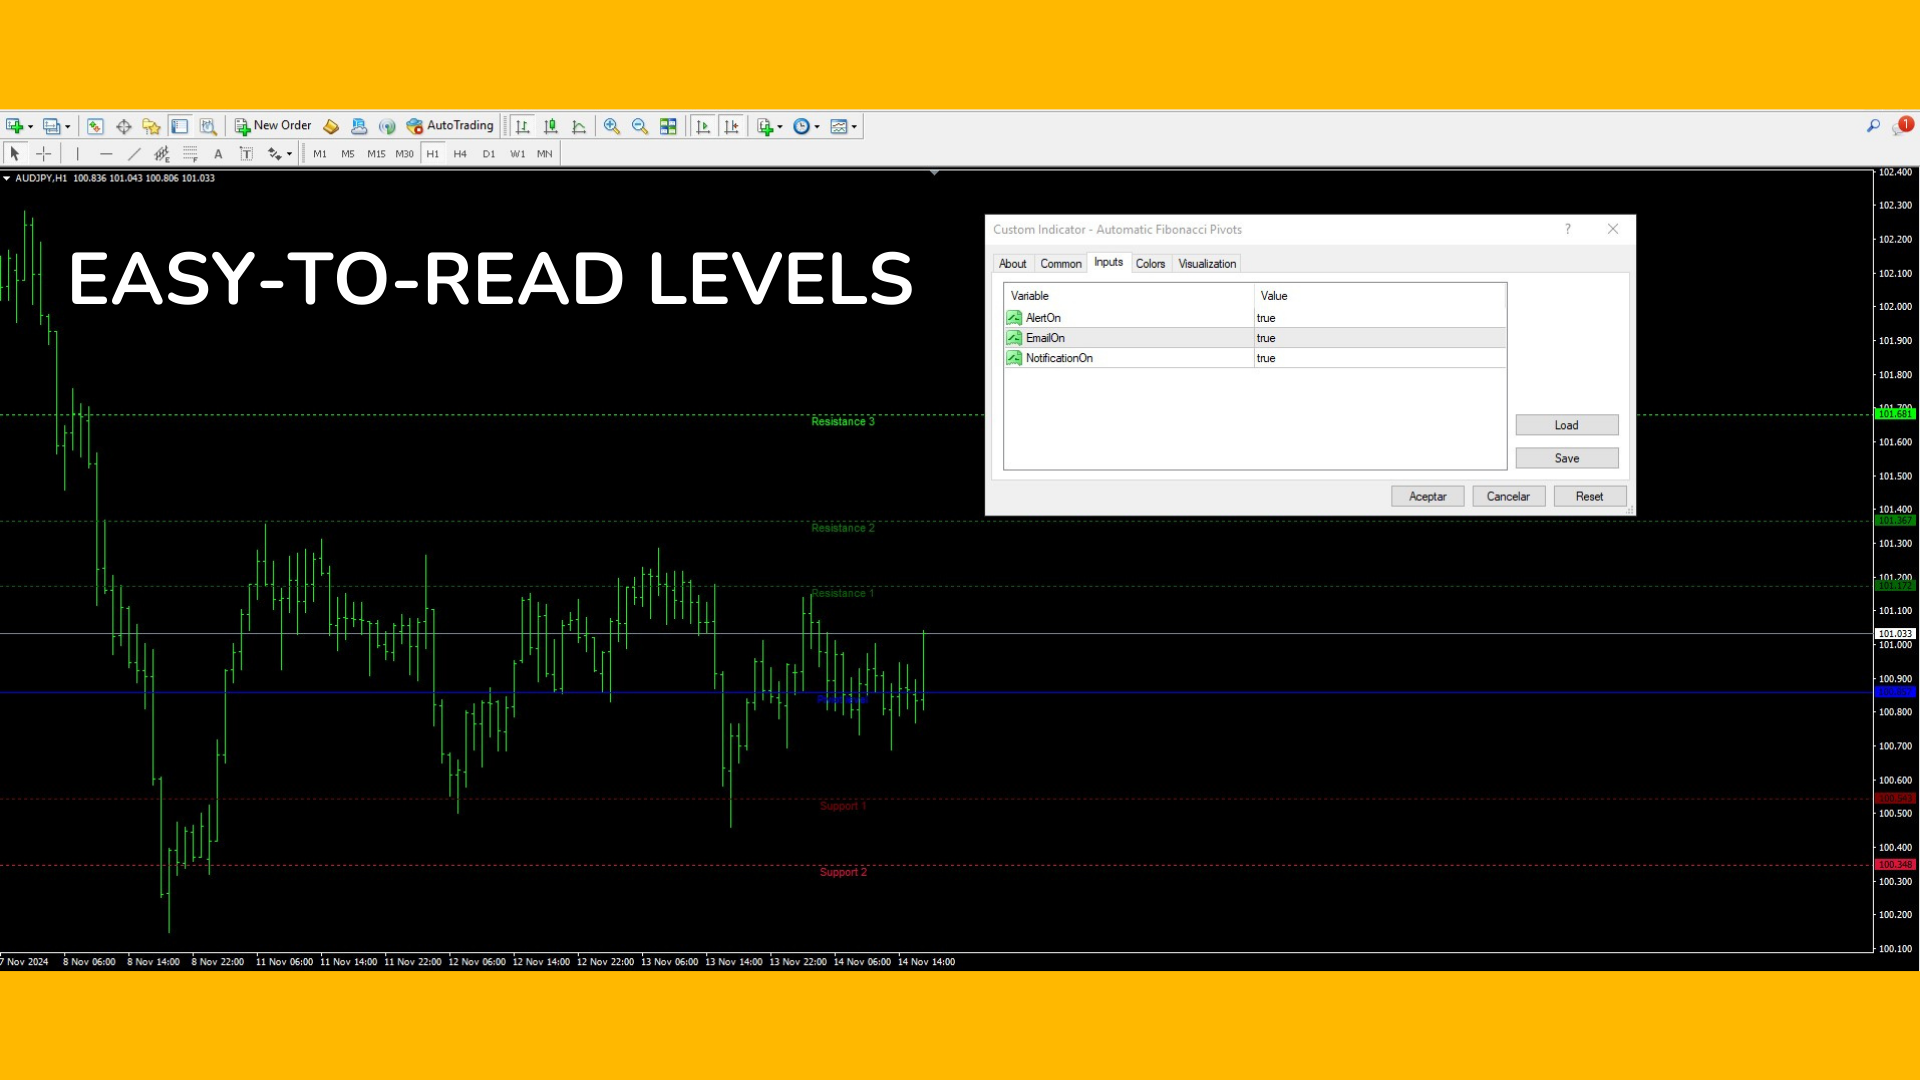
Fibonacci sequence and plots them clean on your chart: the daily pivot, S1/S2/S3
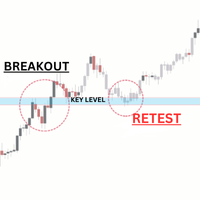
below and R1/R2/R3 above. These are the price zones where the market tends to
react, bounce or break, and now you see them without drawing a single line.
What it does:
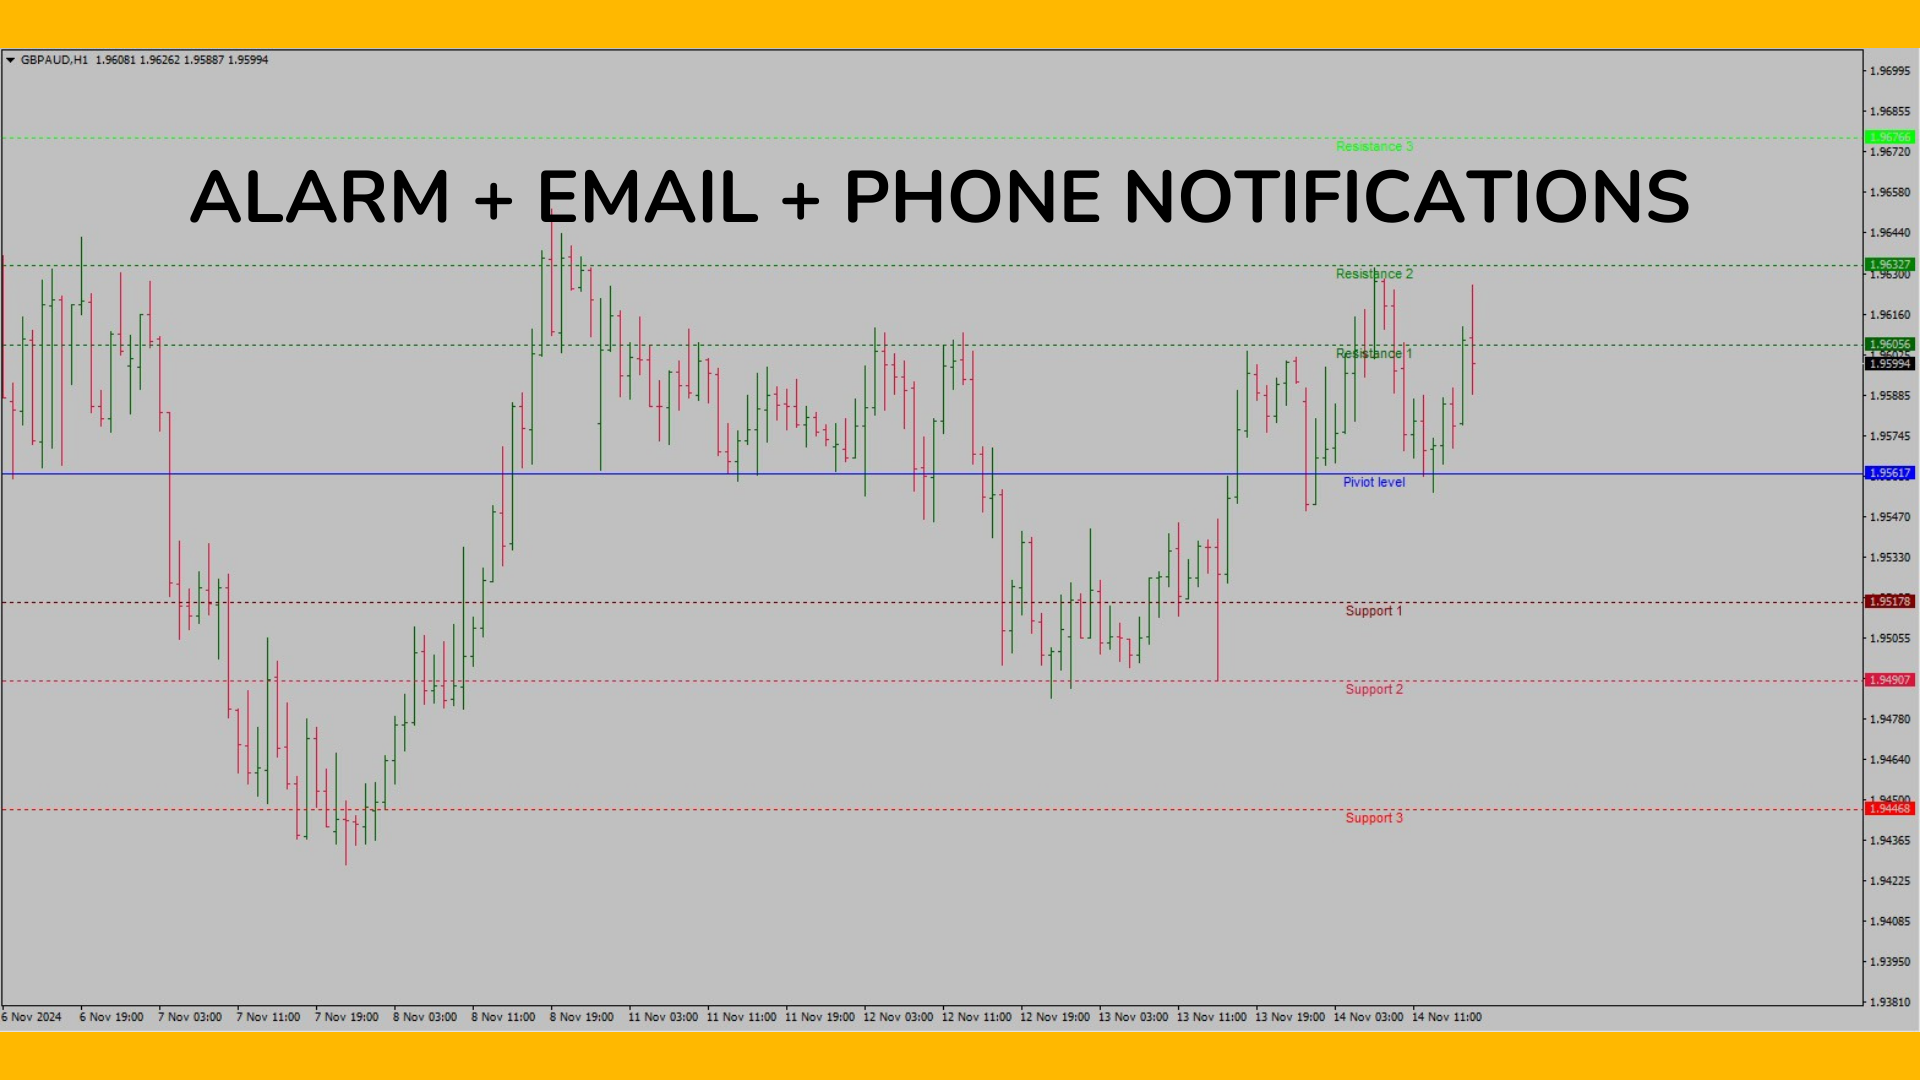
- Daily Fibonacci pivot levels (pivot, S1/S2/S3, R1/R2/R3), updated automatically
- Levels come from daily data, so they stay the same on every timeframe, M5 to D1
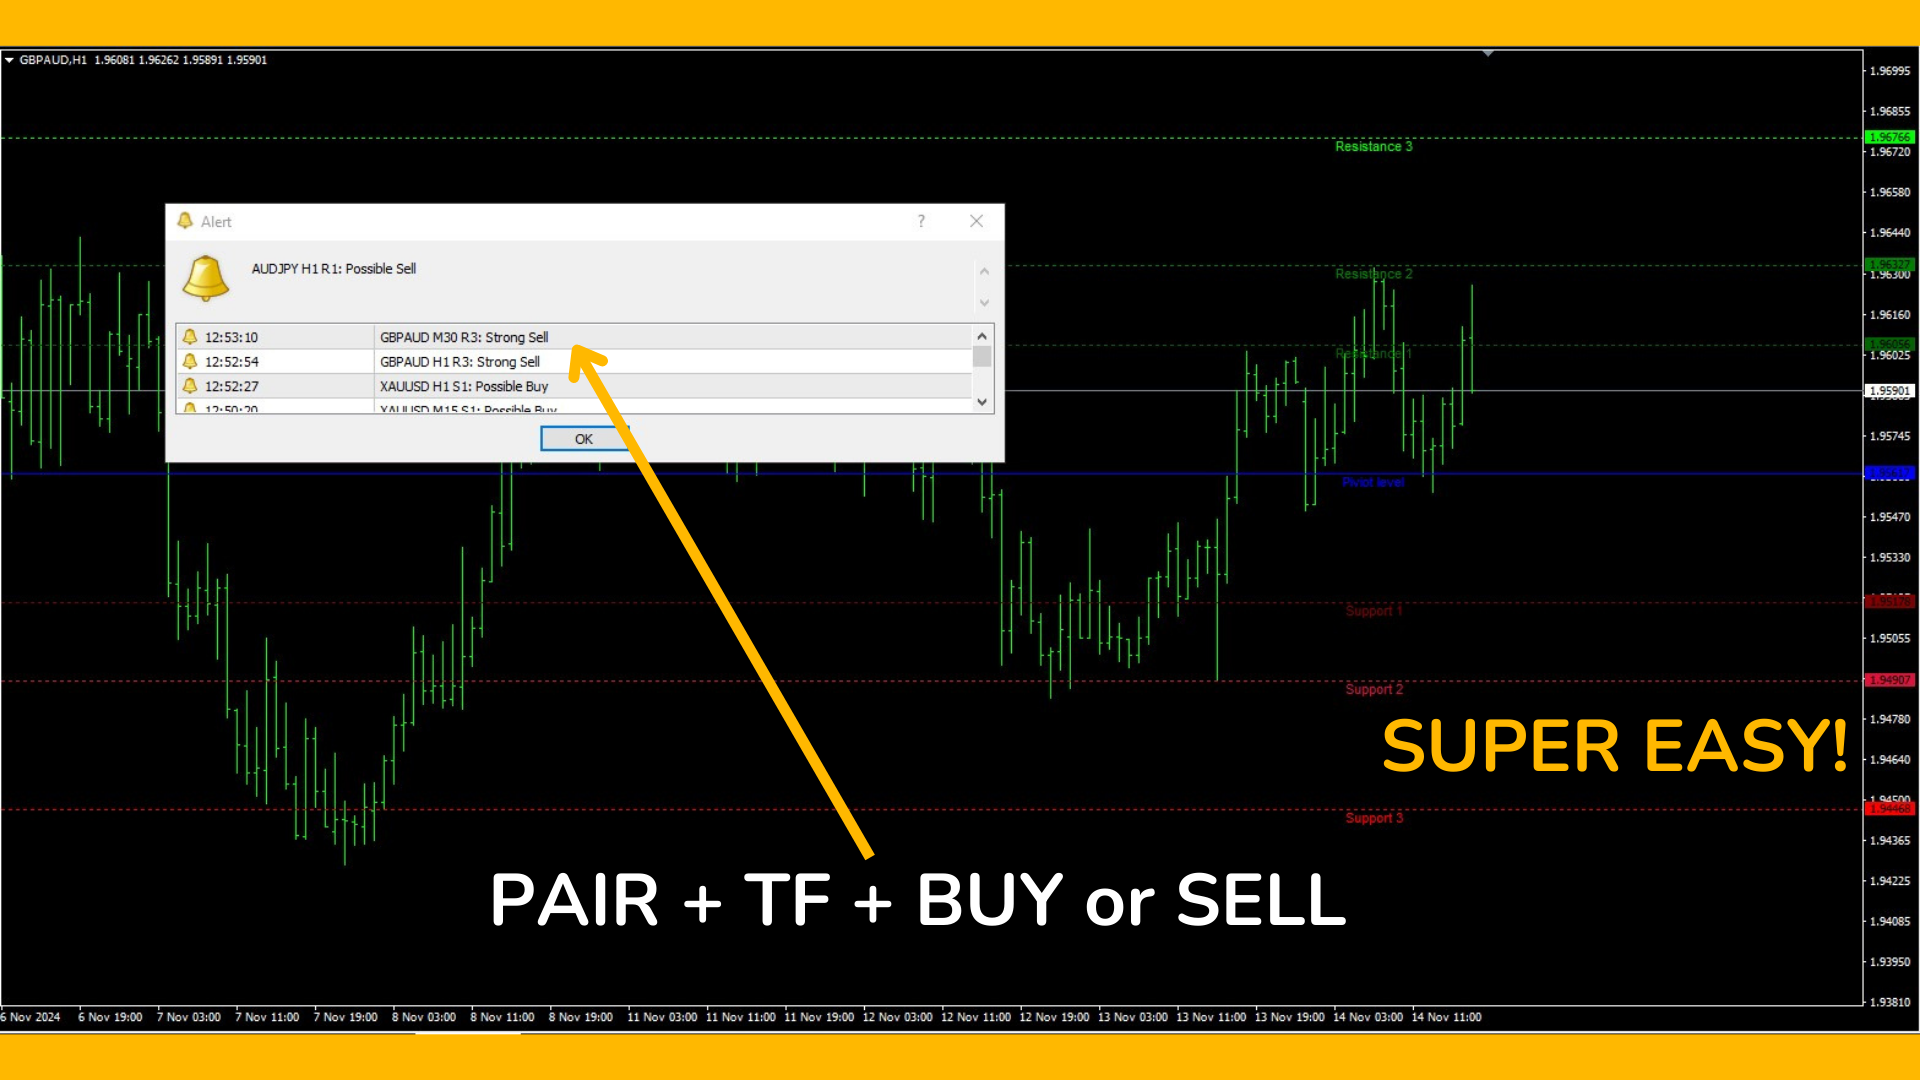
- Alerts when price reaches a level, by popup, sound or push to your phone
- Each alert tells you the pair, the timeframe and the exact level touched
- Works on any symbol, forex, metals, indices, crypto
How to use it:
Attach it to any chart. The levels appear right away and refresh each day. Trade
them the way your strategy uses support and resistance, bounces, breakouts, or as
take-profit and stop targets. The alerts let you walk away and get pinged when
price reaches a level that matters.
Why I made this free: clean levels are something every trader should have, and I
would rather you use mine than eyeball them by hand. If you want a robot that
trades for you instead of marking levels, my Expert Advisors are on my profile.
Free. If these levels help your trading, a short review helps other traders find
it and means a lot.