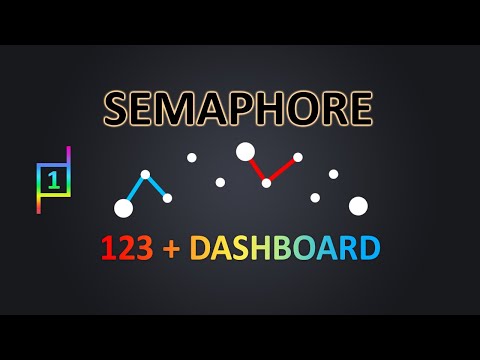
UPD1 Semaphore 123 Dashboard
- Indicators
-
Vitaliy Kuznetsov
 UPD1 MT4 Indicators - https://www.mql5.com/en/market/mt4/indicator?filter=UPD1
Levels
Patterns
Volume
Money Management - Version: 2.96
- Updated: 1 January 2025
- Activations: 20
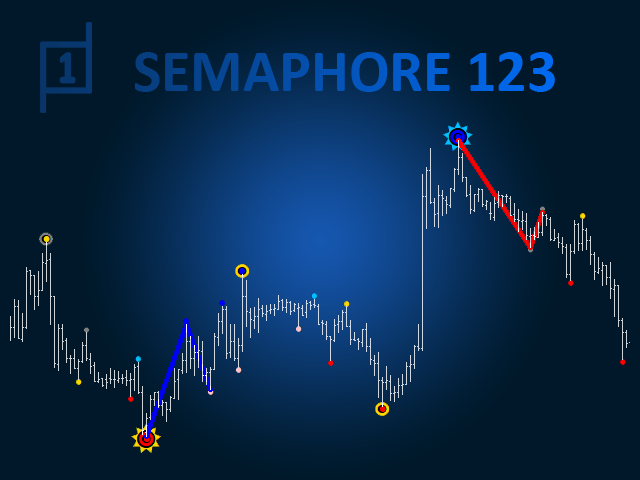
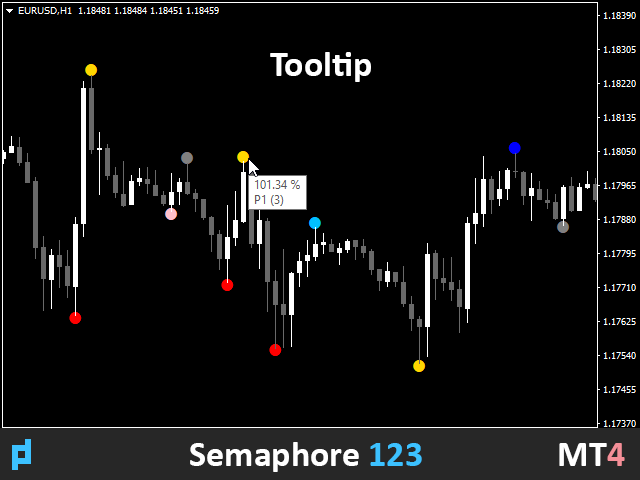
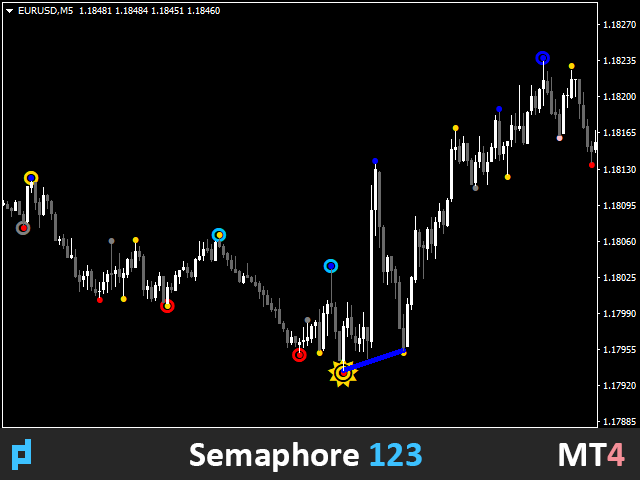
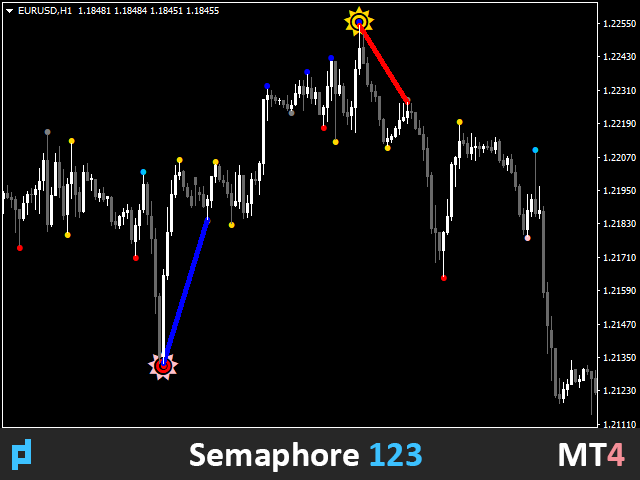
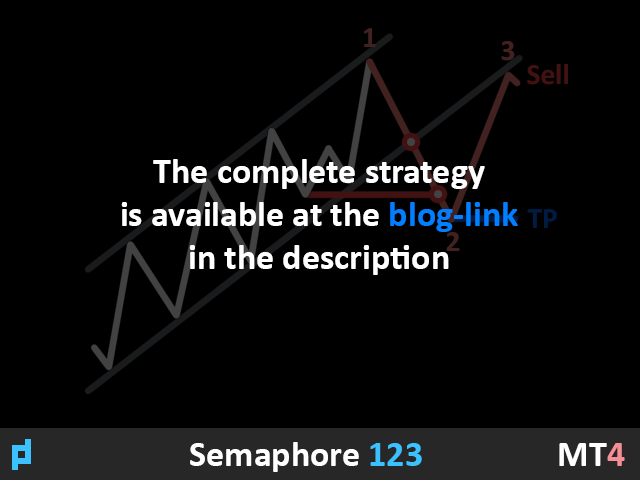
The indicator builds a three-period semaphore and reversal pattern 123 from the extremum. The signal comes at the opening of the second candle.
This pattern can be traded in different ways (test point 3, breakout and others). Exit from the channel or breakout of the trendline is the main trigger for finding an entry point.
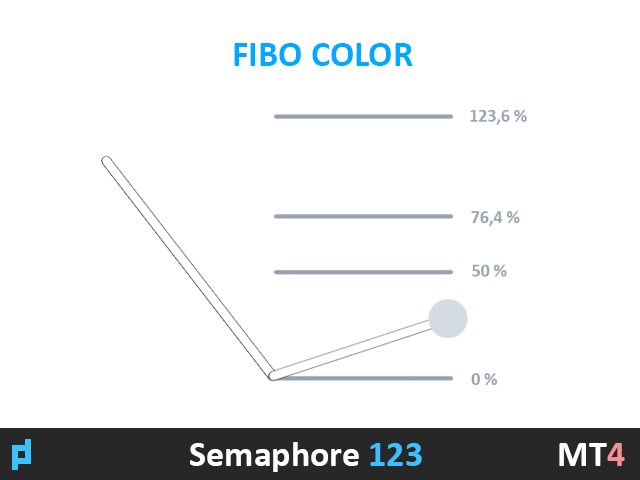
Icons are colored according to Fibonacci levels. Yellow icons indicate a test of a level at which the signal is amplified.
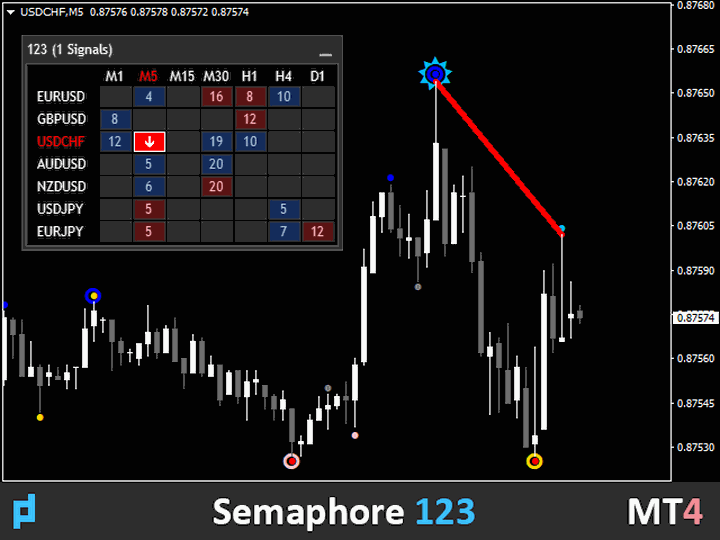
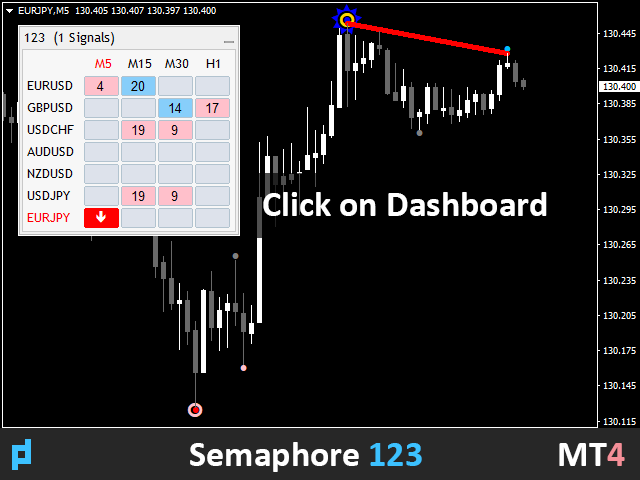
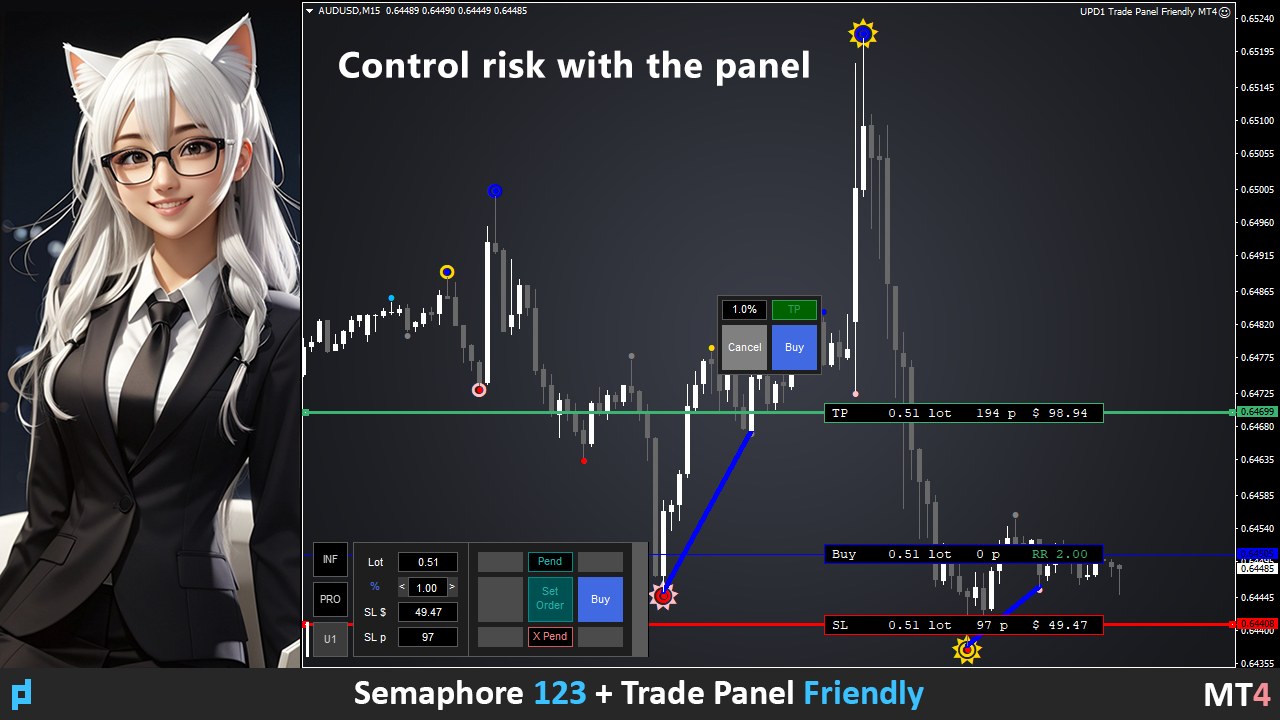
Using the multi-currency dashboard, you can track which currency pairs the 123 pattern was found on and how many bars have followed it.
Input parameters.
Bars Count - history to display.
Tooltip - whether or not to show tooltips when hovering over an object.
Show Semaphore - enable, disable semaphore.
Show 123 - enable or disable the display of pattern 123.
Period 1, 2, 3 - semaphore period.
Period 1, 2, 3 Visual - enable, disable the display of a separate period.
Arrow Coeff Period - number of bars for calculation.
Arrow Coeff - the coefficient of the average candlestick value to form an indentation of icons.
Period 1, 2, 3 Arrow Code - code of the wingdings font icon.
Period 1, 2, 3 Arrow Size - size of arrows.
(<50; 50-76,4; 76,4 -123,6; 123,6-150) UP, DN - color by Fibonacci levels for arrows.
Draw Line Objects - select how to draw the pattern (1-3, 1-2-3, 1-2-3-4).
123 UP, DN Color - color of the 123 pattern line.
123 UP, DN Width - the thickness of the 123 pattern line.
Dashboard - enable, disable the multicurrency dashboard.
Scan Bars to 123 - how many bars in the history to track after the end of 123.
Dashboard Zoom % (0 - auto) - size of the dashboard in percent.
Color Theme - automatic or manual selection of the panel color theme (light and dark).
Symbol Lyst - enter the currency pairs to be monitored.
View M1-MN - enter the time periods to be monitored.
Alert - the main setting that enables the alert (Current Chart, Dashboard List).
Alert Work Time - Alert Work Time 00:00-23:59 (editable).
Alert Pop Up - enable, disable the pop up window.
Alert Push - enable, disable in-app notification.
Alert Email - enable, disable alert to email.
Alert Sound - enable or disable the sound.
Alert Sound Name - the sound file.
Indicator ID - enter a new value if you want to use more than 1 indicator on one chart.


I am addicted to all UPD1 software published by Vitaliy. Currently I use the following softwares from him: Volume Box, Volume Pixel, Profile levels, Semaphore 123 Dashboard and Impulse level. All of them are top notch programs, well-designed, aesthetically pleasing to the eye, do not clutter the chart and work as advertised. His blogs where he explains how to trade using his software are simply superb. I realize that he is not only an astute programmer but also an experienced trader. He is prompt to respond to my questions when asked. The prices of his products are very reasonable. I do not know what more one could ask for?