
Volumatic VIDyA MT4
- Indicators
-
Duc Hoan Nguyen
 I develop practical trading tools for MetaTrader 4/5, with a focus on indicator integration, Multi-Timeframe analysis, market scanning, and automated trading solutions.
My work mainly includes:
• Indicator-to-EA Solutions - Version: 3.1
- Updated: 28 September 2026
- Activations: 10
Get this indicator and more for free here: Convert indicator into a trading robot (no coding required)
Special offer: ALL TOOLS, just $35 each for a limited time!
New tools will be $30 for the first week or the first 3 purchases!
Trading Tools Channel on MQL5: Join my MQL5 channel to receive the latest updates
See the MT5 version at: Volumatic VIDyA MT5 Multi-Timeframe Scanner
See the MT4 version at: Volumatic VIDyA MT4 Multi-Timeframe Scanner
See more products at: All Products or Trading Indicators, Special Offers & New Releases
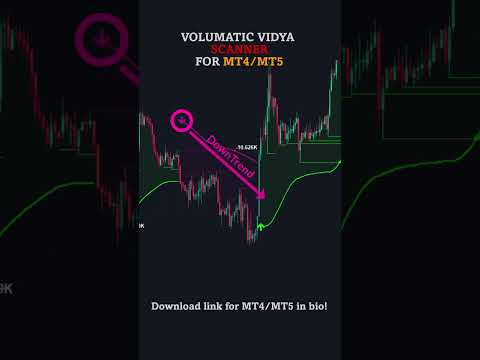
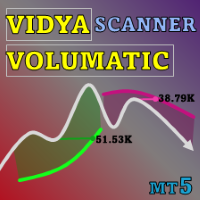
Volumatic VIDyA Multi-Timeframe Scanner combines adaptive trend detection, ATR-based volatility bands, pivot liquidity levels, directional volume analysis, Multi-Timeframe visualization, and a Multi-Symbol Scanner in one comprehensive indicator.
At its core, the indicator uses VIDyA - Variable Index Dynamic Average - to adapt its smoothing speed to current market momentum. VIDyA is combined with volatility bands to determine the active trend and identify trend shifts. Confirmed pivot highs and lows are converted into temporary liquidity levels, while cumulative bullish and bearish volume provides additional context about participation within each trend phase.
The result is a structured view of trend direction, trend transitions, pullback areas, liquidity interactions, and volume balance across symbols and timeframes.
1. Adaptive VIDyA calculationA conventional moving average uses a fixed smoothing speed. VIDyA changes its effective smoothing according to recent directional momentum.
The indicator measures positive and negative price momentum over the selected VIDyA Momentum period. The relationship between these values controls how strongly VIDyA responds to new price data:
- Strong directional momentum makes VIDyA react faster.
- Weak or balanced momentum makes VIDyA smoother and less reactive.
- VIDyA Length controls the base smoothing factor.
- VIDyA Value Smoothing Period applies additional smoothing to the resulting VIDyA value.
This adaptive behavior allows the trend baseline to respond more actively when the market moves directionally while remaining smoother when momentum becomes weak or mixed.
2. ATR-based volatility bandsThe indicator creates an Upper Band and a Lower Band around VIDyA:
Upper Band = VIDyA + ATR x Band Distance
Lower Band = VIDyA - ATR x Band Distance
The ATR Period controls the volatility measurement, while Band Distance determines how far the two bands are positioned from VIDyA.
- A larger Band Distance requires a stronger price movement before the trend changes. It generally produces fewer and more selective trend shifts.
- A smaller Band Distance places the bands closer to VIDyA. It reacts sooner but may produce more frequent changes in sideways conditions.
- A longer ATR Period produces a more stable volatility measurement.
- A shorter ATR Period adapts faster to recent changes in volatility.
The trend state changes when the selected Applied Price crosses one of the volatility bands:
Applied Price crosses above Upper Band - Upward trend begins
Applied Price crosses below Lower Band - Downward trend begins
A movement occurring between the two bands does not independently reverse the existing trend. The current state remains active until the opposite band-crossing condition occurs.
This creates separate thresholds for bullish and bearish transitions, helping reduce unnecessary state changes caused by minor price fluctuations around a single average.
4. Trend lines and trend cloudAfter the trend has been determined, the indicator displays the band associated with the active state:
Upward trend - Lower VIDyA smoothing line
The Lower Line is displayed below price as a dynamic bullish trend reference.
Downward trend - Upper VIDyA smoothing line
The Upper Line is displayed above price as a dynamic bearish trend reference.
When the trend changes, the displayed line switches from one side of the market to the other. The active line can be used to identify the current direction, follow trend continuation, monitor pullbacks toward the adaptive boundary, and provide context for pivot liquidity levels.
The optional filling creates a visual trend cloud between the active line and the average candle price. Bullish filling appears during an upward trend and bearish filling appears during a downward trend. Set Filling Transparency to 100 to disable the filling.
5. How Buy and Sell signals are createdThe Buy and Sell arrows are created directly from changes in the internal trend state:
5.1. Buy Signal
A Buy Signal appears when the previous state was bearish and the Applied Price crosses above the Upper Band:
Bearish - Bullish - Buy Arrow at the new Lower VIDyA Line
5.2. Sell Signal
A Sell Signal appears when the previous state was bullish and the Applied Price crosses below the Lower Band:
Bullish - Bearish - Sell Arrow at the new Upper VIDyA Line
The arrows identify the beginning of a newly detected trend phase rather than every possible entry in the same direction.
A signal on the current open candle can change or disappear if price moves back before the candle closes. Closed-bar users can evaluate the arrow after the signal candle has completed.
6. Pivot detectionThe indicator detects structural pivot highs and pivot lows using the configured left-side and right-side bars.
- High/Low: pivot highs are calculated from candle highs and pivot lows from candle lows.
- Close/Close: both pivot highs and pivot lows are calculated from closing prices.
A pivot must be surrounded by the required number of bars before it can be confirmed. Left Side Pivot Bars controls the bars on one side of the pivot, while Right Side Pivot Bars controls how many subsequent bars are required for confirmation.
Because subsequent bars are required, the pivot is not known immediately when the extreme occurs. Once confirmed, its liquidity line is positioned at the original pivot bar. Increasing Right Side Pivot Bars makes detection more selective but also increases the confirmation delay.
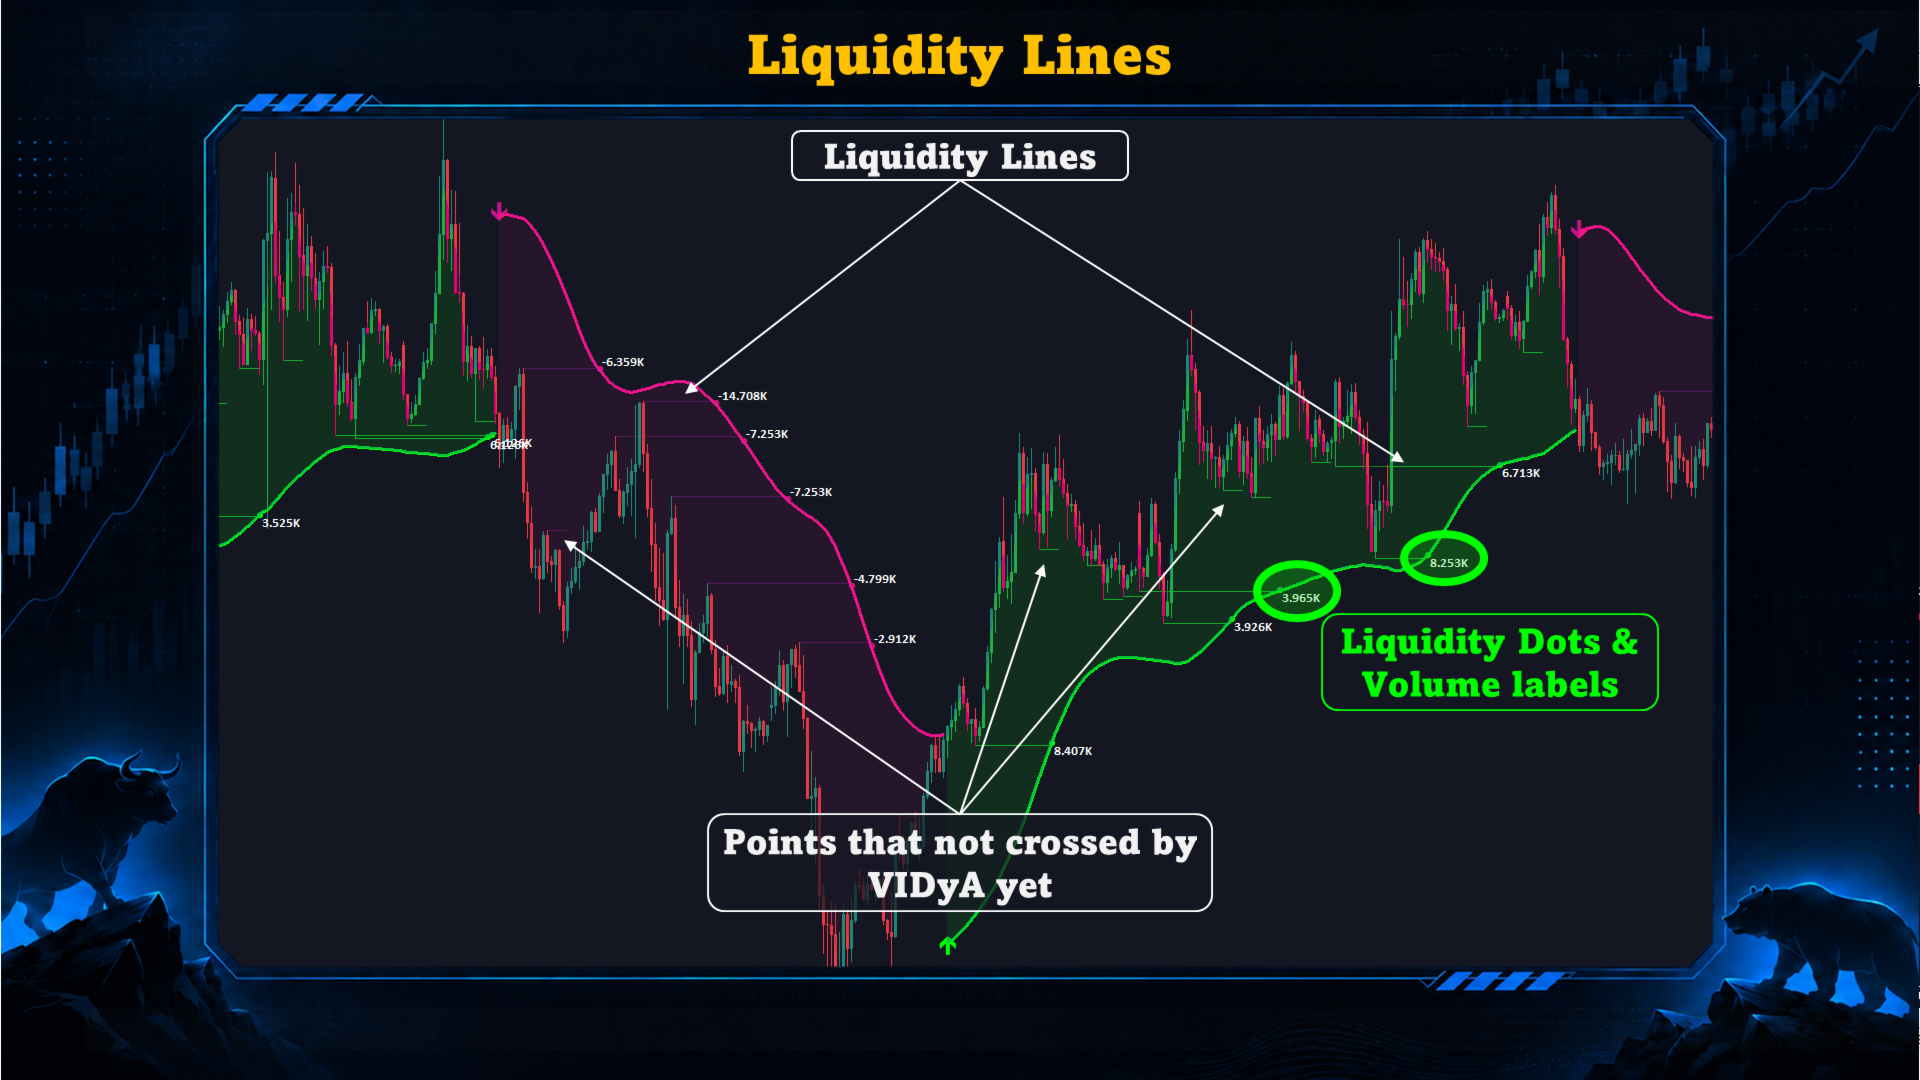
7. How liquidity lines are formedNot every confirmed pivot becomes a liquidity line. The indicator filters pivots according to the active trend and their position relative to the VIDyA trend line.
7.1. Bullish Liquidity Line
During an upward trend, a confirmed pivot low can form a bullish liquidity line when the trend has not just changed and the pivot low is positioned above the active Lower VIDyA Line.
The horizontal line is drawn at the pivot-low price.
7.2. Bearish Liquidity Line
During a downward trend, a confirmed pivot high can form a bearish liquidity line when the trend has not just changed and the pivot high is positioned below the active Upper VIDyA Line.
The horizontal line is drawn at the pivot-high price.
This trend-based filtering focuses attention on structural levels formed inside the active trend rather than displaying every local high and low.
8. Meaning and lifetime of liquidity linesA liquidity line represents a previously confirmed structural pivot that remains relevant to the current trend phase. These levels can help locate previous pullback extremes, identify possible retest areas, monitor the internal trend structure, and analyze continuation setups around recent pivots.
A liquidity line remains active until one of the following occurs:
- The active VIDyA trend line reaches or crosses the liquidity level.
- The trend changes direction.
- The line exceeds Maximum Liquidity Line Length.
The maximum-length setting prevents old levels from remaining on the chart after their intended analytical context has expired.
9. Price retest vs. Liquidity DotA price retest and a Liquidity Dot are related but different events.
Price Retest: Has market price returned to the displayed liquidity line?
Liquidity Dot: Has the active smoothed VIDyA trend line reached or crossed that liquidity level?
9.1. Price Retest
A price retest is observed directly from market candles and is not the condition that creates a Liquidity Dot.
- For a bullish continuation, price returns to a recent pivot-low liquidity line while the bullish trend remains active.
- For a bearish continuation, price returns to a recent pivot-high liquidity line while the bearish trend remains active.
- A wick may touch or briefly interact with the level.
- Holding the level or closing back on the trend side can provide additional continuation context.
If the retest candle closes through the level in the opposite direction, the next candle can be used to evaluate whether price recovers the level or confirms a deeper structural change.
9.2. Liquidity Dot
A Liquidity Dot is generated only when the active smoothed VIDyA trend line reaches or crosses an eligible liquidity level:
- A bullish-colored dot corresponds to an interaction with a pivot-low liquidity line.
- A bearish-colored dot corresponds to an interaction with a pivot-high liquidity line.
- Price may retest a liquidity line before a dot appears.
- A dot does not automatically create a new Buy or Sell signal.
- A dot does not necessarily mean that the trend has reversed.
When a liquidity level is processed, the indicator can display its associated volume value. The value is calculated from the selected volume source around the pivot area:
- Positive values are associated with pivot-low liquidity levels.
- Negative values are associated with pivot-high liquidity levels.
- Tick Volume uses the number of price changes recorded by the broker.
- Real Volume uses actual traded volume when the broker and symbol provide it.
For many Forex and CFD instruments, real volume may not be available, making tick volume the practical selection. The liquidity volume label is separate from the cumulative Buy Volume, Sell Volume, and Delta Volume displayed for the current trend.
11. Cumulative Buy and Sell VolumeThe indicator separates volume according to candle direction:
- Volume from candles with Close > Open is added to Buy Volume.
- Volume from candles with Close < Open is added to Sell Volume.
- Neutral candles do not contribute to either side.
Buy Volume and Sell Volume are accumulated throughout the active trend phase. When a Trend Shift occurs, both counters are reset and a new volume calculation begins for the new trend.
The current labels therefore describe only the active trend, not the complete chart history. During a bullish phase, for example, Buy Volume is the accumulated volume of bullish candles since that phase began, while Sell Volume is the accumulated volume of bearish candles occurring within the same bullish phase.
12. Delta VolumeDelta Volume compares the cumulative bullish and bearish volume within the current trend:
Delta Volume = (Buy Volume - Sell Volume) / (Buy Volume + Sell Volume) x 100
The result ranges from -100% to +100%:
- Positive Delta means Buy Volume is larger than Sell Volume.
- Negative Delta means Sell Volume is larger than Buy Volume.
- A value near zero means bullish and bearish volume are relatively balanced.
- A value moving farther from zero indicates increasing dominance by one side.
- A value moving back toward zero indicates increasing participation from the opposing side.
The direction of Delta Volume can be compared with the trend:
Bullish trend + Positive Delta - Bullish volume agreement
Bearish trend + Negative Delta - Bearish volume agreement
Bullish trend + Weak or Negative Delta - Limited bullish volume agreement
Bearish trend + Weak or Positive Delta - Limited bearish volume agreement
A weakening Delta does not independently reverse the trend. The trend state changes only when the Applied Price crosses the relevant volatility band.
13. Reference Delta Volume zonesThe following values can be used as flexible reference zones rather than fixed trading conditions:
- Absolute Delta below approximately 10%: Buy Volume and Sell Volume are relatively balanced. This may occur during a weak trend, transitional phase, or ranging market.
- Absolute Delta of approximately 10%-20%: One side has a slight advantage, but volume alignment is not yet particularly clear.
- Absolute Delta of approximately 20%-30%: One side has a noticeable advantage, with clearer volume alignment in that direction.
- Absolute Delta of approximately 30% or more: A relatively strong volume imbalance is present during the current trend phase.
In a bullish trend, a larger positive Delta indicates stronger bullish-volume dominance. In a bearish trend, a more negative Delta indicates stronger bearish-volume dominance.
Values of 50% or more may be considered exceptionally strong, but they occur less frequently and do not need to be used as a primary evaluation threshold.
These zones are analytical references. Appropriate ranges can vary according to the symbol, timeframe, trading session, volatility, and selected volume source.
13.1. Trend and Delta alignmentThe sign of Delta Volume should always be interpreted together with the current VIDyA trend state. A positive Delta is not automatically bullish in every context, and a negative Delta is not automatically bearish in every context.
Bullish Trend + Positive Delta
The price-based trend and cumulative volume are aligned. Buy Volume is larger than Sell Volume during the active bullish phase.
Bearish Trend + Negative Delta
The price-based trend and cumulative volume are aligned. Sell Volume is larger than Buy Volume during the active bearish phase.
Bullish Trend + Negative Delta
The VIDyA trend remains bullish, but Sell Volume has become larger than Buy Volume within the current bullish phase. This disagreement can occur during a strong pullback, weakening bullish participation, a transitional condition, or before a possible Trend Shift.
Bearish Trend + Positive Delta
The VIDyA trend remains bearish, but Buy Volume has become larger than Sell Volume within the current bearish phase. This disagreement can occur during a strong bullish retracement, weakening bearish participation, a transitional condition, or before a possible Trend Shift.
A trend-Delta disagreement does not reverse the indicator by itself. The VIDyA trend changes only when the Applied Price crosses the relevant volatility band. Delta describes volume participation inside the active trend; the VIDyA bands determine the trend state.
The magnitude remains important. A small opposite Delta near zero can represent only a minor imbalance, while a larger opposite Delta indicates stronger disagreement between the current trend state and cumulative volume.
14. Current information labelsThe labels positioned beside the current VIDyA trend line can display:
- Cumulative Buy Volume for the active trend.
- Cumulative Sell Volume for the active trend.
- Current Delta Volume percentage.
- Selected indicator timeframe.
- Remaining time of the current timeframe candle.
- A colored marker matching the active trend.
The label color can be selected manually or set to automatic so that it follows the bullish or bearish trend color.
15. Practical ways to use the indicator16. Bullish continuation workflow15.1. Basic Trend Identification
Use the active VIDyA line and cloud to establish directional context:
Lower Line active - Bullish state
Upper Line active - Bearish stateFrequent switching between the two states can indicate unstable, transitional, or ranging conditions.
15.2. Trend and Volume Confirmation
Compare the trend direction with Delta Volume. A bullish state with positive Delta or a bearish state with negative Delta indicates volume agreement. Delta near zero indicates a more balanced volume distribution.
15.3. Ranging or Uncertain Conditions
Possible signs include Delta remaining near zero, frequent trend switching, liquidity levels forming close together, price repeatedly moving through the cloud, or conflicting directions across timeframes.
15.4. Monitoring Trend Weakening
In a bullish trend, Delta moving from strongly positive toward zero indicates increasing relative bearish participation. In a bearish trend, Delta moving from strongly negative toward zero indicates increasing relative bullish participation.
- Confirm that the Lower VIDyA Line and bullish cloud are active.
- Preferably confirm that the higher timeframe is also bullish.
- Identify the latest bullish liquidity line formed from a pivot low.
- Wait for price to pull back and retest that liquidity line.
- Observe whether the candle rejects the level or closes back above it.
- Evaluate whether Delta remains positive and meets the selected reference level.
- Use the surrounding price structure to evaluate whether the bullish setup remains valid.
A bullish Liquidity Dot may appear later if the Lower VIDyA Line reaches or crosses the pivot-low level. The dot provides additional structural information and is not required for the initial price retest.
17. Bearish continuation workflow- Confirm that the Upper VIDyA Line and bearish cloud are active.
- Preferably confirm that the higher timeframe is also bearish.
- Identify the latest bearish liquidity line formed from a pivot high.
- Wait for price to retrace and retest that liquidity line.
- Observe whether the candle rejects the level or closes back below it.
- Evaluate whether Delta remains negative and meets the selected negative reference level.
- Use the surrounding price structure to evaluate whether the bearish setup remains valid.
A bearish Liquidity Dot may appear later when the Upper VIDyA Line reaches or crosses the pivot-high level.
18. Multi-Timeframe workflowA higher timeframe can be used for directional context while a lower timeframe is used for detailed observation:
- H1 Bullish + M15 Bullish Retest: possible trend-aligned bullish context.
- H1 Bearish + M15 Bearish Retest: possible trend-aligned bearish context.
- Higher-timeframe trend active + Lower-timeframe Delta weakening: possible temporary pullback.
- Higher and lower timeframes point in opposite directions: possible correction or transition.
- Several timeframes align with supportive Delta: broader directional agreement.
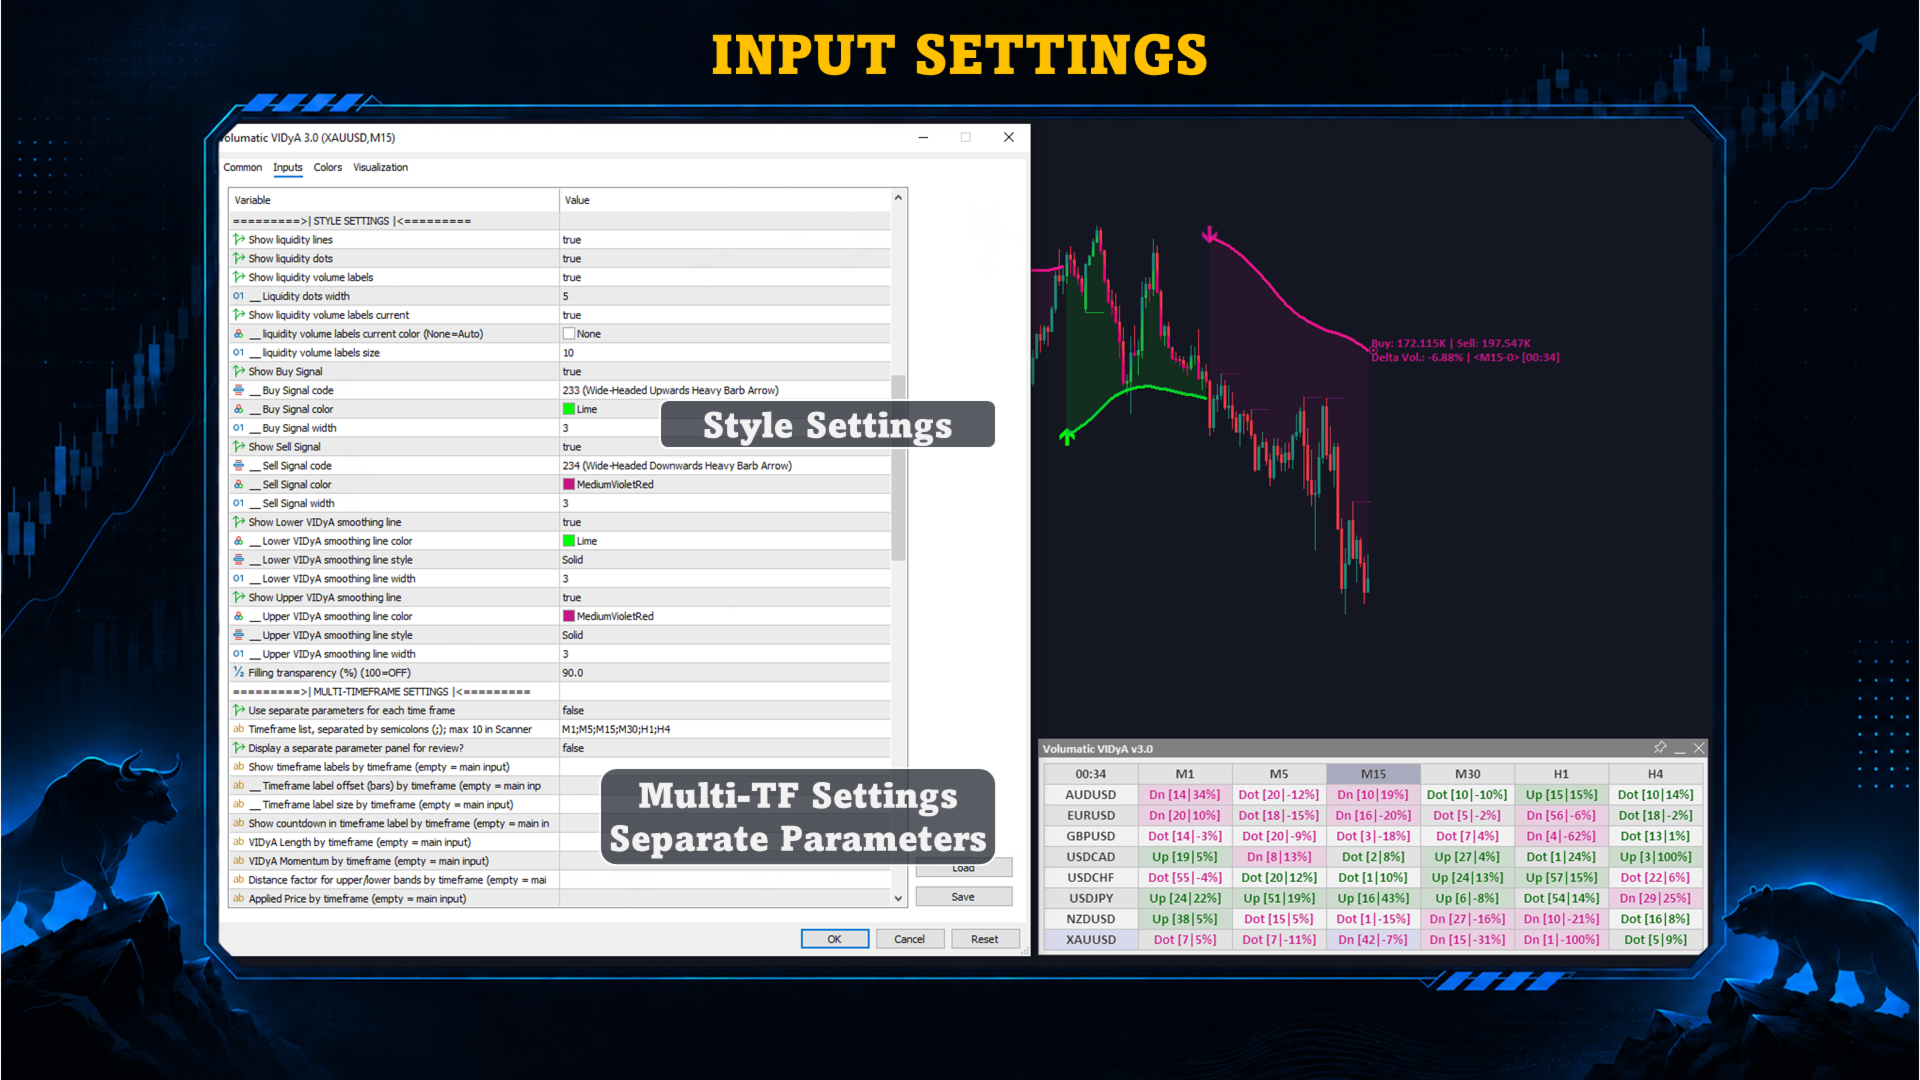
Different VIDyA, ATR, pivot, volume, and visual settings can be assigned to each timeframe when Use Separate Parameters for Each Timeframe is enabled.
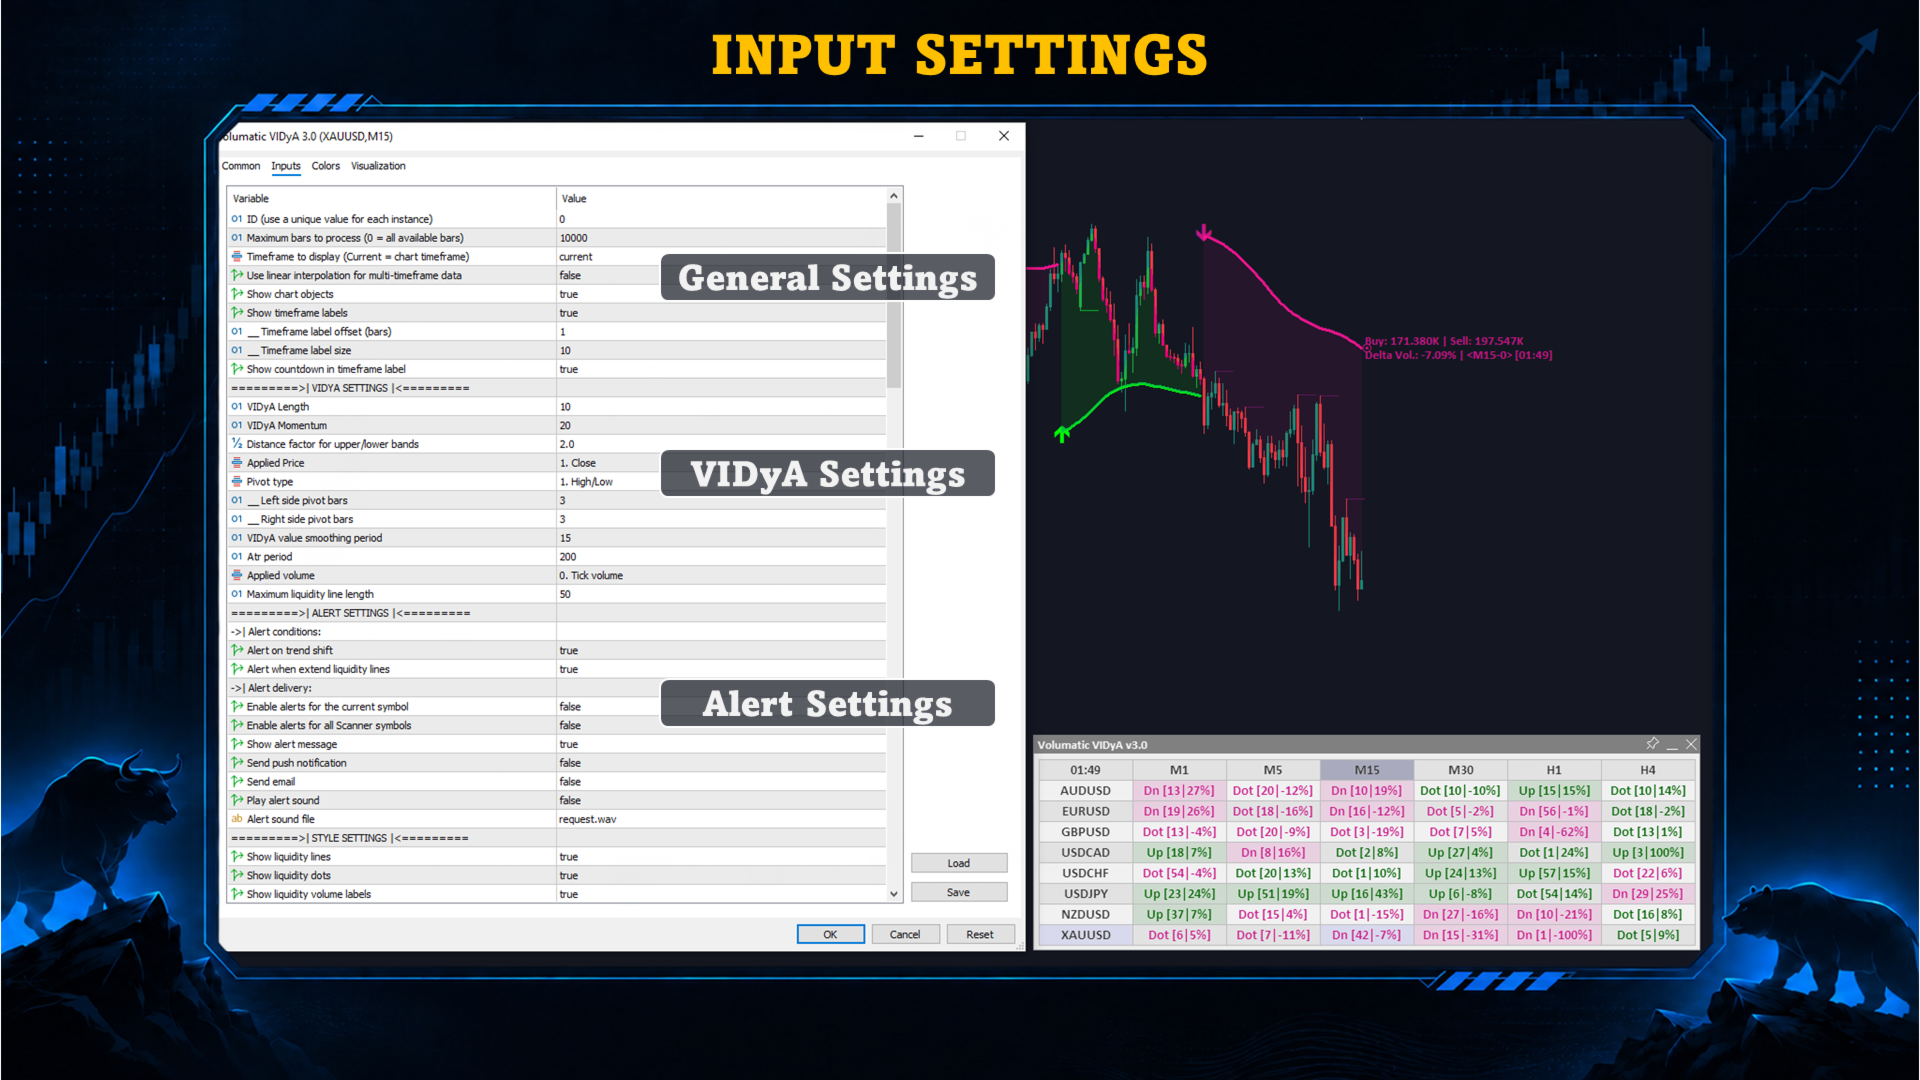
19. AlertsThe indicator provides two main alert conditions:
19.1. Trend Shift Alert
Notifies the user when a bullish or bearish Trend Shift is detected.
19.2. Liquidity Line Alert
Notifies the user when the VIDyA trend line reaches or crosses an eligible liquidity level and the corresponding Liquidity Dot is generated.
Available delivery methods:
- Terminal alert message
- Push notification
- Sound
Use Enable Alerts for the Current Symbol for the chart symbol. Use Enable Alerts for All Scanner Symbols to receive enabled alerts from symbols monitored by the Scanner.
20. Multi-Timeframe & Multi-Symbol ScannerThe integrated Multi-Timeframe system displays calculations from a selected timeframe on the current chart. Multiple indicator instances can be combined to show several timeframes simultaneously.
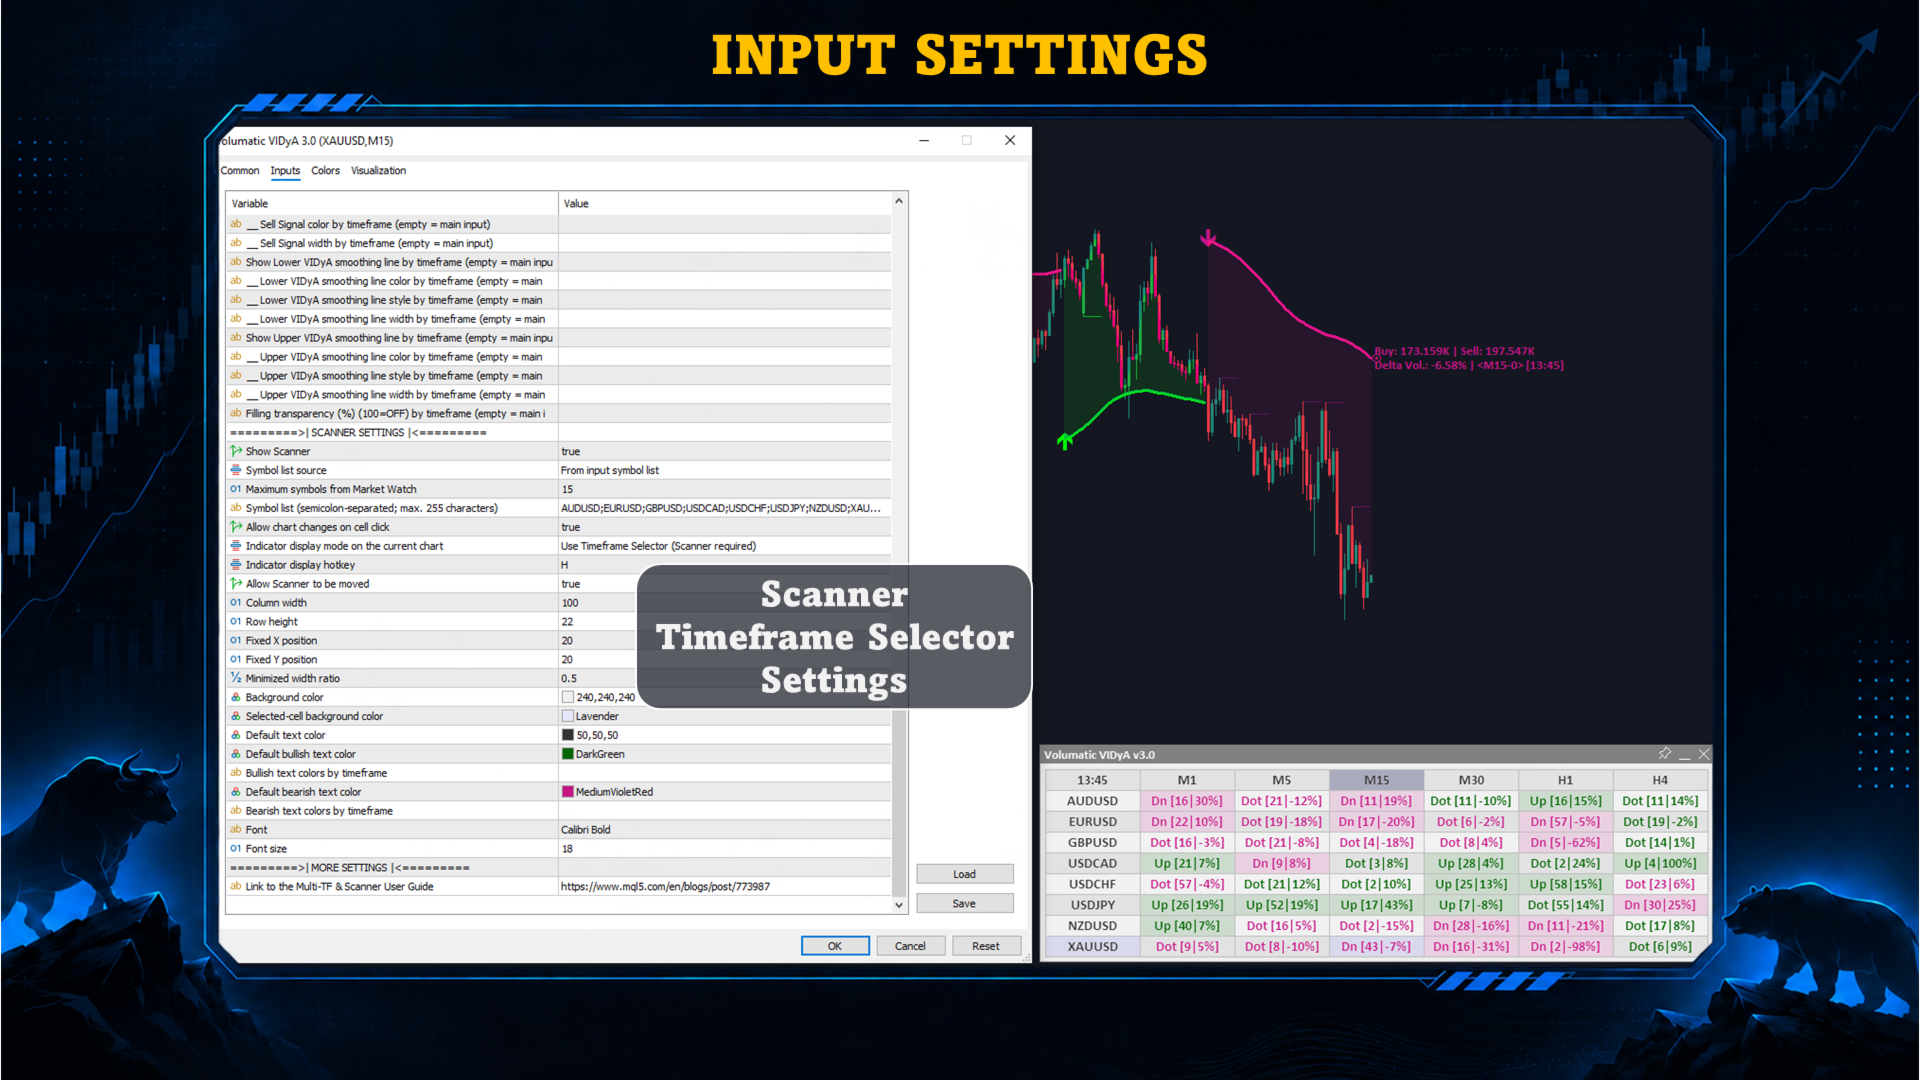
The Scanner provides a compact view of the latest detected condition across selected symbols and timeframes. Its main functions include:
- Custom timeframe list
- Custom symbol list or Market Watch symbols
- Up to 10 Scanner timeframes
- Chart switching by clicking a Scanner cell
- Separate bullish and bearish colors
- Movable and minimizable panel
- Hotkey-controlled indicator visibility
- Alerts for the current symbol or all Scanner symbols
- Optional individual parameters for each timeframe
- Direct display of the current Delta Volume value and sign
- Display of the latest Buy Signal, Sell Signal, or Liquidity Dot together with Delta Volume
How to interpret Delta Volume together with the latest Scanner signal:
Buy Signal or Bullish Liquidity Dot + Positive Delta: bullish event with bullish-volume agreement.
Buy Signal or Bullish Liquidity Dot + Negative Delta: bullish event, but current cumulative volume favors the bearish side.
Sell Signal or Bearish Liquidity Dot + Negative Delta: bearish event with bearish-volume agreement.
Sell Signal or Bearish Liquidity Dot + Positive Delta: bearish event, but current cumulative volume favors the bullish side.
The latest signal records the most recent Trend Shift or Liquidity Dot, while current Delta continuously reflects the cumulative volume balance of the active trend. They can therefore point in different directions without either value being incorrect.
When scanning multiple symbols and timeframes, aligned combinations can be used to quickly identify trend phases with supporting volume. Opposing combinations can be used to identify symbols that require closer inspection for pullbacks, weakening participation, transition, or a possible future Trend Shift.
When Use Separate Parameters for Each Timeframe is disabled, all timeframes use the main indicator settings. When enabled, semicolon-separated lists can assign different settings to individual timeframes.
The values in each per-timeframe list must follow the exact order specified in Timeframe List. An empty list inherits the corresponding main input value.
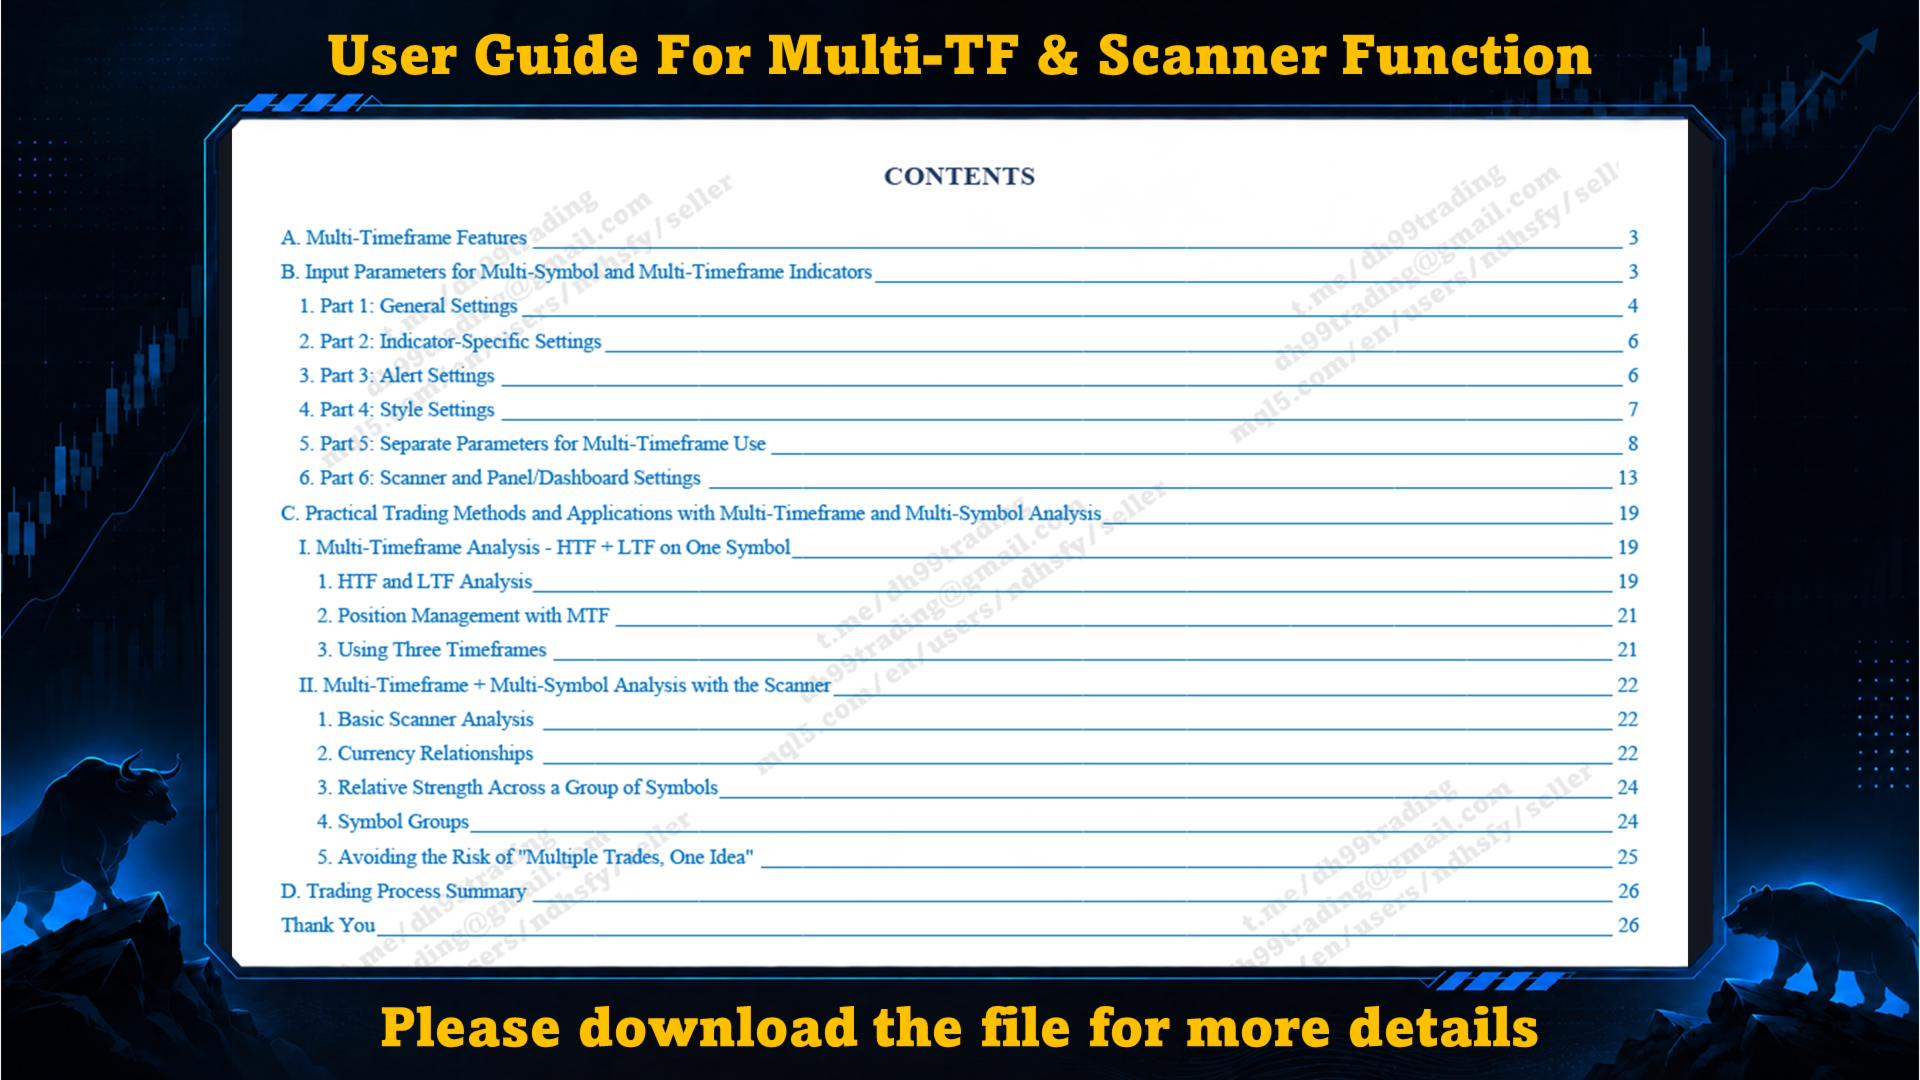
For detailed instructions about Multi-Timeframe display, the Scanner, Separate Parameters, Timeframe Selector, Scanner Alerts, Hotkeys, Timeframe Labels, and related controls, use the Multi-Timeframe & Multi-Symbol Guide linked at the beginning of this page.
21. Important input parameters21.1. General Settings
- ID: assign a unique value to each indicator instance on the same chart to avoid conflicts between objects and Scanner panels.
- Maximum Bars to Process: limits the amount of historical data processed. Set to 0 to use all available bars.
- Timeframe to Display: selects the timeframe calculated and displayed on the current chart.
- Linear Interpolation: smooths the visual connection of higher-timeframe values on a lower-timeframe chart. It affects presentation rather than the source-timeframe calculation.
- Show Chart Objects: controls liquidity lines, volume labels, and other chart objects.
- Timeframe Labels and Countdown: display the source timeframe and remaining time of its current candle.
21.2. VIDyA Settings
- VIDyA Length: controls the base responsiveness. Lower values react faster; higher values are smoother.
- VIDyA Momentum: determines the momentum window used to adjust VIDyA's smoothing speed.
- Band Distance: controls the distance and sensitivity of the Upper and Lower Bands.
- Applied Price: selects the price source used for VIDyA and trend-crossing calculations.
- VIDyA Value Smoothing Period: applies additional smoothing to the VIDyA result.
- ATR Period: controls the volatility calculation used to construct the bands.
21.3. Pivot and Liquidity Settings
- Pivot Type: selects High/Low or Close/Close pivot calculation.
- Left Side Pivot Bars: number of bars on the left side used to validate a pivot.
- Right Side Pivot Bars: number of subsequent bars required to confirm a pivot.
- Maximum Liquidity Line Length: maximum number of timeframe bars for which a liquidity line remains active.
- Applied Volume: selects Tick Volume or Real Volume.
Left Side Pivot Bars and Right Side Pivot Bars cannot both be zero.
21.4. Visual Settings
- Liquidity Line visibility
- Liquidity Dot visibility and size
- Liquidity volume label visibility, color, and size
- Current Buy Volume, Sell Volume, and Delta Volume labels
- Buy and Sell arrow code, color, and width
- Lower and Upper VIDyA Line color, style, and width
- Trend-cloud filling transparency
- Adaptive VIDyA with ATR-based trend bands and optional cloud
- Dynamic bullish and bearish trend lines
- Buy and Sell arrows at Trend Shifts
- High/Low or Close/Close pivot detection
- Trend-filtered liquidity lines, dots, and volume labels
- Cumulative Buy Volume, Sell Volume, and Delta Volume
- Tick Volume and Real Volume options
- Trend Shift and Liquidity Line alerts
- Multi-Timeframe display with separate parameters
- Multi-Symbol and Multi-Timeframe Scanner





































































指标不重绘,搭建系统很好,开发者服务很好,很有耐心的回复所有疑问,赞