UPD1 Volume BOX
- Indicators
-
Vitaliy Kuznetsov
 UPD1 MT4 Indicators - https://www.mql5.com/en/market/mt4/indicator?filter=UPD1
Levels
Patterns
Volume
Money Management - Version: 3.71
- Updated: 1 January 2025
- Activations: 20
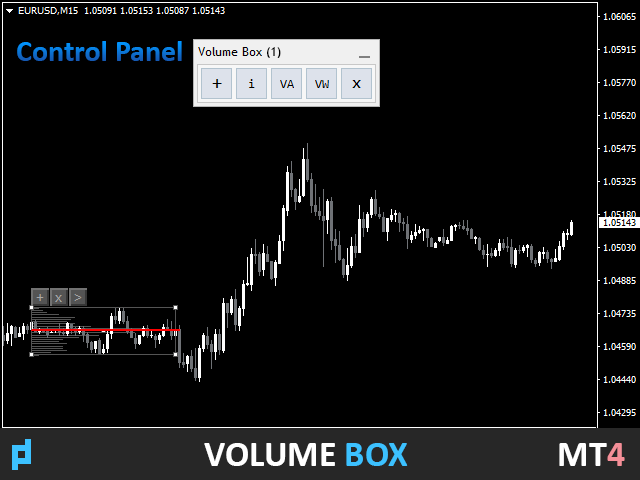
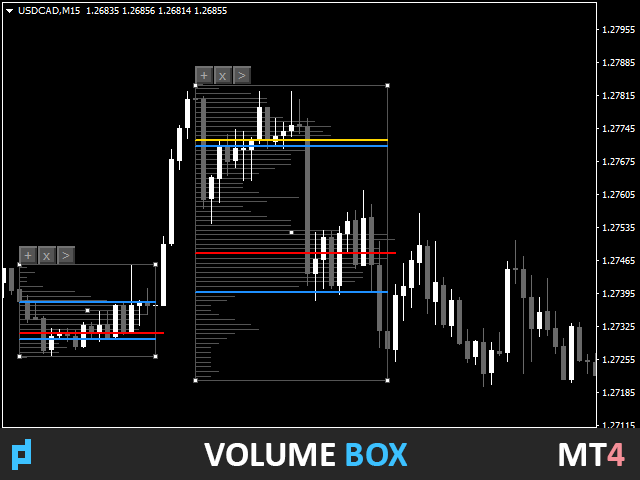
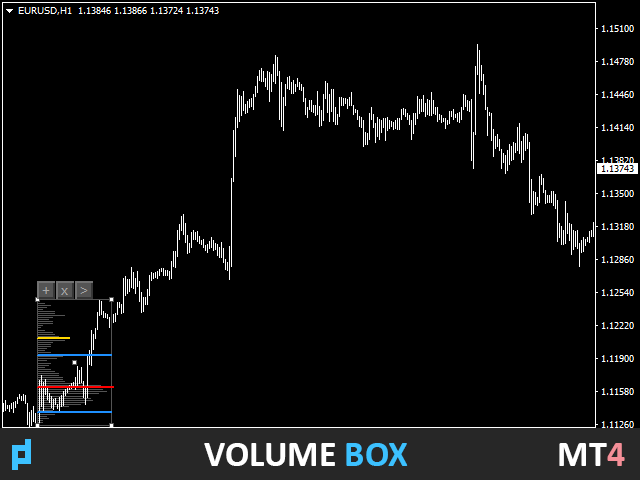
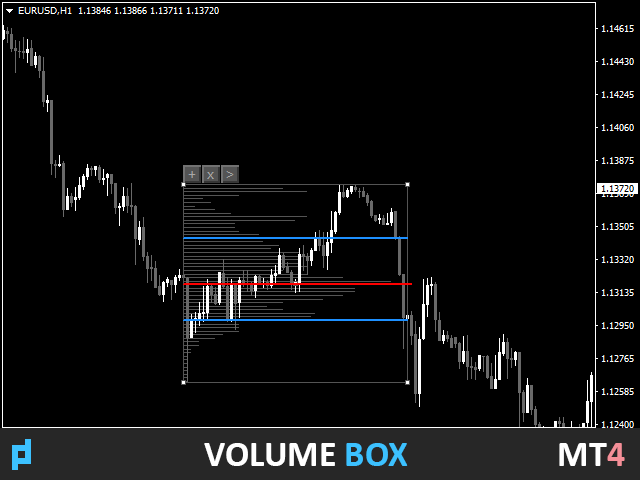
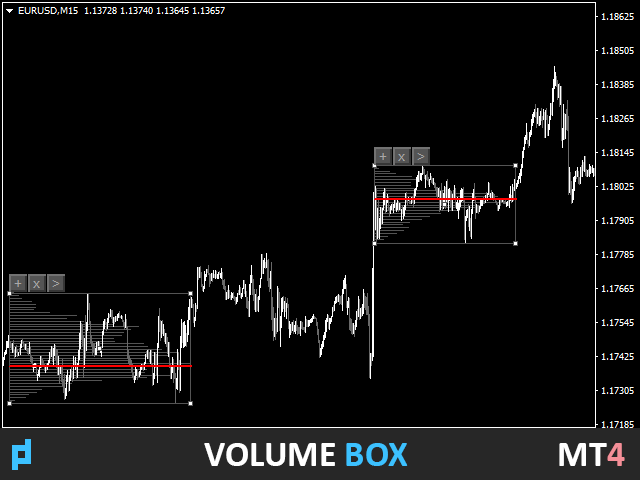
The indicator displays the horizontal volume profile in the specified area (BOX) and the maximum volume (POC).
Product Features.
1. You can use ticks or just price.
2. Adaptive grid spacing (M1-MN).
3. Adaptive high volume (median) search step depending on box size.
4. Automatic chameleon color for box lines and buttons.
5. Multiple boxes, easy to create and delete.
6. 70% volume area (enable in settings).
7. There is an alert for touching the maximum horizontal volume line (POC).
8. VWAP.
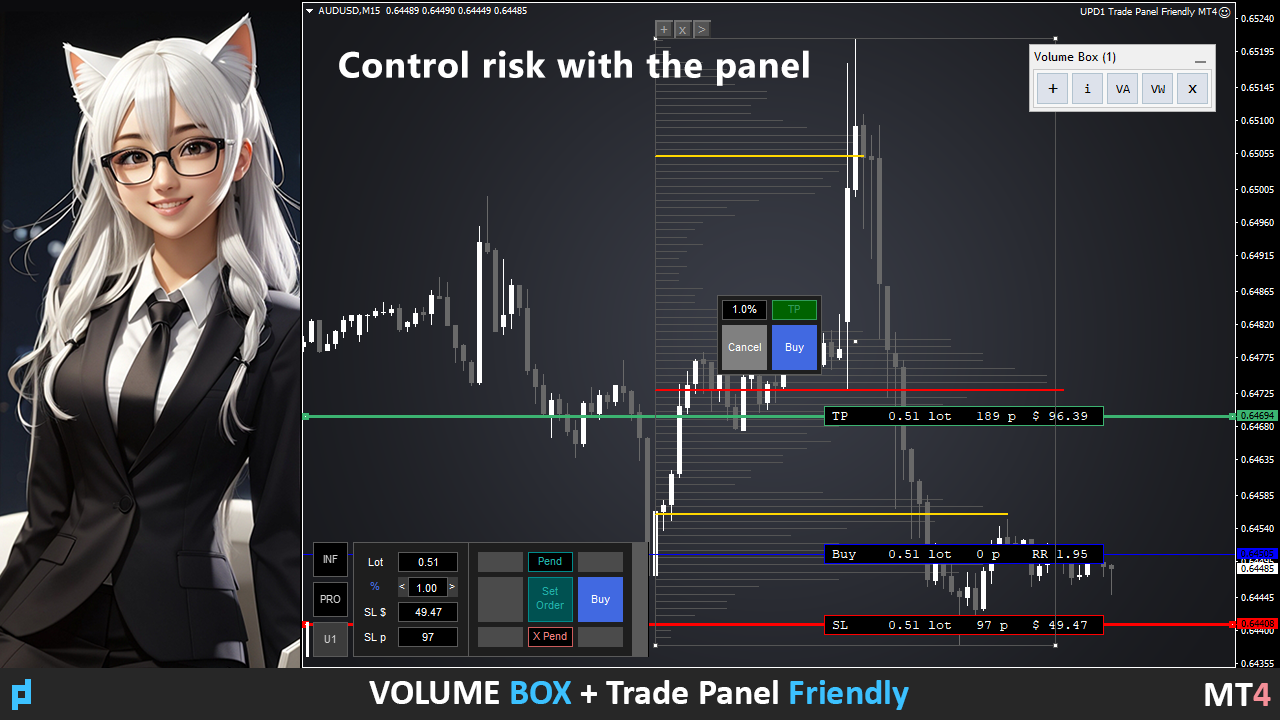
9. Control Panel.
Explore the market with the volume profile indicator. I did it for myself, but now it is available to you too.
Main Settings.
Calc Histo Mode – histogram calculation method (Market Profile – calculation by price, Tick Volume Profile – calculation by ticks).
Mode Step In Pips – calculation of median lines by pips.
Vertical Step – vertical step of the histogram (distance between lines in pips).
Data Source – auto selection of quotes timeframe (up to H1 takes ticks from M1).
Touch First Bar - toggle on to make the extension POC-line stop on the first touch.
Hide Button - hiding buttons setting (when the rectangle is inactive).
Control Panel Settings.
Control Panel – this setting allows you to enable the control panel on the chart.
Control Panel Zoom (0 - auto) - select the panel size as a percentage (50, 100, 200 and others).
Color Theme - automatic or manual selection of the panel color theme (light and dark).
Show Histo - this setting enables the display of the main profile histogram.
Show Info - this setting enables the display of the total tick volume number.
Visual Settings.
Button Color - chameleon or gray.
BOX Color (None - Chameleon) – box frame color. If color is None, chameleon mode will be used.
BOX Line Style – frame line style (solid, dotted, etc.).
BOX Line Width - the thickness of the box line.
Histo Color (None - Chameleon) – the color of the horizontal histogram lines. If color is None, chameleon mode will be used.
Chameleon Color % - specify the percentage by which the brightness will be changed from the original background color.
Histo Width – thickness of horizontal histogram lines.
POC Color – maximum horizontal volume color (POC).
Median Line Color – median color (high horizontal volume).
POC And Median Line Width – line thickness of median and maximum horizontal volume (POC).
Extend Median Line Style – the line style of the median to the edge of the box. Disabled by default.
Extend POC Line Style – POC continuation line style is out of box. Activated by pressing the > button on the frame.
Extend POC Line Width (If Style Solid) – the thickness of the POC continuation line outside the box if a solid style is selected.
Volume Area Settings.
Show Volume Area – display volumetric price range.
VA TPO In % – volumetric price range. Set as a percentage.
VA Line Style – price range line style (VAH and VAL) (Volume Area High, Volume Area Low).
VA Line Width – price range line thickness.
VA Line Color – price range line color.
VWAP Settings.
VWAP - this setting allows you to enable VWAP lines on the chart in the box.
VWAP Line Style - set the line style.
VWAP Line Width - set the line width.
VWAP R3-S3 Color - set the line color.
Alert Settings.
Alert - enable / disable notification settings.
Alert Work Time - specify the time period when the alert will be active.
Alert Pop Up - enable / disable alert popup.
Alert Push - enable / disable notification to phone.
Alert E-mail - enable / disable email notification.
Alert Sound - enable / disable sound notification.
Alert Sound Name - select sound alert file.


Wonderful Indicator. It has totally transformed my trading. Makes all other indicators I have used previously look very ordinary.