UPD1 Volume Cluster

4.82

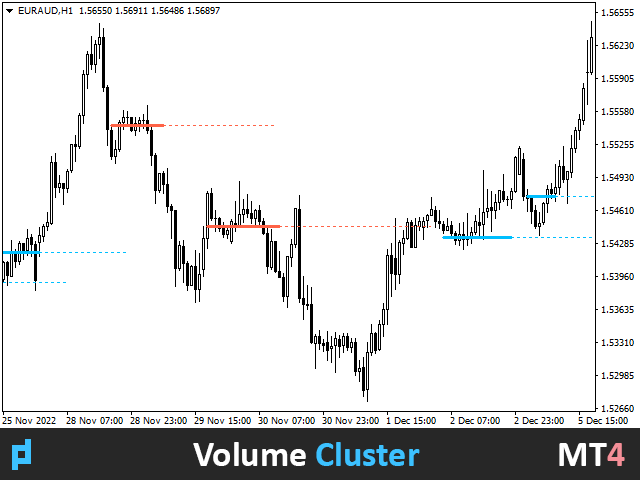
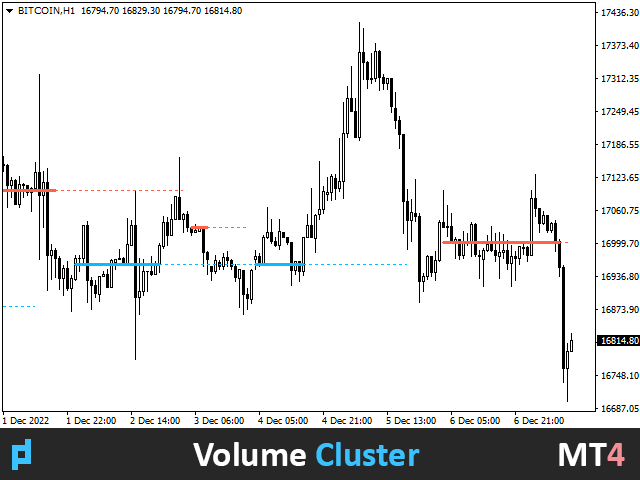
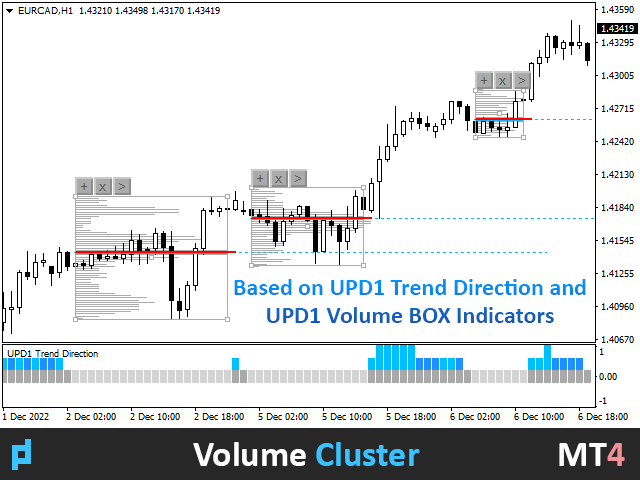
The algorithm finds the zones of reduced volatility based on the UPD1 Trend Direction Indicator and builds the maximum horizontal volume based on the UPD1 Volume Box Indicator.

As a rule, a strong trend movement occurs when exiting accumulation. If the price has left the accumulation, then it can test its maximum horizontal volume (POC).

Smart alerts are available in the settings.


Input parameters.


Main Settings.

Bars Count – the number of history bars on which the indicator will work.

Timeframe Flat - choosing the timeframe on which the flat is being searched and the cluster is being built. By default, it is always the current one.

Data Source - the choice of the timeframe of quotations. Detects automatically (optimally).

Vertical Step - affects density and vertical accuracy.

Period - select the oscillator period.

Start Flat After Bar - how many bars should I ignore after the trend ends to start drawing a flat.

Minimal Flat Bars - minimum number of bars in the flat.

ID - indicator number. Choose a different ID in order to set the indicator on the chart several times. For example, with different periods of flat.


Visual Settings.

Cluster Width - POC/Cluster flat line thickness.

Cluster UP / DN Color - line color selection.

Extend Line Multiplier - continuation of the POC line, multiplier. Is equal to 2. The line is extended by the same number of candles multiplied by 2.

Extend Line Style - continuation line style. Dots. You can select a dashed line, etc.

Touch First Bar - stop the extension of the line at the first touch with the price. Disabled by default.

Draw Current Flat - display the POC of the flat until its completion.

Flat Color - POC flat line color.


Alert Settings.

Alert (1, 2, 3) - enable / disable notification settings.

1. Flat Start - alert when a gray cluster  line appears.

2. End of Flat (Probable) - alert when the cluster is over.

3. Touch Bar - alert when price touches the cluster line.

Repeat Signal - allow signals on adjacent bars.

Visual Alert Object - displaying signal icons.

Alert Work Time - specify the time period when the alert will be active.

Alert Pop Up - enable / disable alert popup.

Alert Push - enable / disable notification to phone.

Alert E-mail - enable / disable email notification.

Alert Sound - enable / disable sound notification.

Alert Sound Name - select sound alert file.


Reviews 24
Chapa
564
Chapa 2026.01.05 03:05 
 

Brilliant!! The author is providing for free what others charge for. A whole suite of volume based indicators. This one is sweet... like a gateway drug to the main course, Volume Box. Ahhh Vitaliy, I see what you did here. : )

18607983623
64
18607983623 2025.09.05 13:04 
 

怎么没有副图指标

Sokslegend
878
Sokslegend 2025.04.18 02:19 
 

This is a superb indicator if one knows how to use it.

Recommended products
Market Profile 3
Hussien Abdeltwab Hussien Ryad
3 (2)
Market Profile 3 MetaTrader 4 indicator  — is a classic Market Profile implementation that can show the price density over time, outlining the most important price levels, value area, and control value of a given trading session. This indicator can be attached to timeframes between M1 and D1 and will show the Market Profile for daily, weekly, monthly, or even intraday sessions. Lower timeframes offer higher precision. Higher timeframes are recommended for better visibility. It is also possible t
FREE
Hurst Buy and Sell Mt4
Victor Alfonso Molina Botello
Hurst Buy and Sell  This innovative indicator, inspired by xAI Grok intelligence, uses the Hurst exponent to identify the nature of the market and generate buy/sell signals. The EA for this indicator (Hurst Razer PRO EA MT5) is now available, you can see it by clicking here!  https://www.mql5.com/es/market/product/153441?source=Site+Profile+Seller  If you want more signals from the indicator, change the minimum number of bars between consecutive signals. The lower the value, the more signals it
FREE
Forex Market Profile and Vwap
Lorentzos Roussos
4.86 (7)
Volume Profile Indicator / Market Profile Indicator What this is not : FMP is not the classic letter-coded TPO display , does not display the overall chart data profile calculation , and , it does not segment the chart into periods and calculate them. What it does :  Most importantly ,the FMP indicator will process data that resides between the left edge of the user defined spectrum and the right edge of the user defined spectrum. User can define the spectrum by just pulling each end of the indi
FREE
MT Supply Demand
Issara Seeboonrueang
4 (4)
We provide indicators tailored to better meet your trading requirements.       >>  MT Magical  << MT Supply Demand : It is an indicator created to find supply and demand, which will be important support and resistance levels for the price.  Supply Zone   is a zone where the price has reached, it is often resisted. In other words, when the price reaches this zone, there will be more selling power to push the price back down. Demand Zone   is a zone where the price has reached, it is ofte
FREE
Zig Zag 123
Stephen Reynolds
Zig Zag 123 tells us when a reversal or continuation is more likely by looking at the shift in supply and demand. When this happens a signature pattern appears known as 123 (also known ABC) will often break out in direction of higher low or lower high. Stop loss and take profit levels have been added. There is a panel that shows the overall performance of your trades for if you was to use these stop loss and take profit levels.  We get alerted if a pattern 123 appears and also if the price re
FREE
Pips forex - is a ready trading system . This indicator shows with arrows on the chart when and in what direction you need to open an order. If the arrow is green, then we open a buy deal, and if the arrow is red, then we open a sell deal. Everything is very simple and quite effective. TakeProfit set 15-25 points. StopLoss set at the level of points. When the dots move, we immediately override the StopLoss. Recommended timeframe for trading M1 and M5. This is a scalping strategy and works best
Lisek Weis Wave
Darius Hans Lischka
5 (3)
This Weis Wave Volume indicator is a tool to help traders identify the current price trend.  Understanding volume can provide insight into a market's behavior to help you determine its overall health. The most important rule is this: volume precedes price. Typically, before a market price moves, volume comes into play. It has 2 main colors histogram which are green and red. – Green indicates an upward wave. The more the price increases, the bigger the green volume gets. – The red color shows a d
FREE
SX Supply Demand Zones accurately identifies and draws high-probability Supply and Demand zones using a sophisticated algorithm. Unlike traditional indicators that clutter your chart, this indicator is designed with a focus on performance and a clean user experience. New Unique Feature: Interactive Legend System What truly sets this indicator apart from everything else is the Interactive Control Legend. You have a professional dashboard directly on your chart that allows you to: Show/Hide: Ins
FREE
This indicator displays the historical bid and ask prices on the chart. This is an extremely useful tool for watching the spread rise and fall, as well as watching to see whether or not the bid and ask prices are converging or diverging. This tool will allow you to enter the market at just the right time. This indicator will help you stay out of the market when the spread begins to rise and help you get into the market as the spread begins to fall again. ON SALE FOR FREE, GET IT FREE FOR A LIMI
FREE
Simple QM Pattern
Suvashish Halder
4.5 (2)
Simple QM Pattern is a powerful and intuitive trading indicator designed to simplify the identification of the Quasimodo (QM) trading pattern. The QM pattern is widely recognized among traders for effectively signaling potential reversals by highlighting key market structures and price action formations. This indicator helps traders easily visualize the QM pattern directly on their charts, making it straightforward even for those who are new to pattern trading. Simple QM Pattern includes dynamic
FREE
Flat Reminder Overview Flat Reminder is a powerful technical analysis tool that identifies and highlights price consolidation zones on your chart. It detects when price action slows down and moves sideways, indicating potential reversal points, continuation setups, or key decision zones in the market. Key Features Consolidation Detection : Automatically identifies flat price zones where market momentum decreases Range Measurement : Calculates and displays the exact range of each consolidation in
FREE
Features: 1- Get OB/OS Levels from Golden MA Levels 2- Wait for Buy/Sell Start Level Cross 3- Optional: Should price cross Mid Level in earlier bars 4- Optional: Crossing bar High/Medium Volume 5- Optional: MA Stacked to check up/down trend for current TF 6- Optional: NRTR higher timeframes aligned Check Detailed blog post explained: https://www.mql5.com/en/blogs/post/758457 Levels with Buffers available here: Golden MA Levels Indicator: https://www.mql5.com/en/market/product/119515 Note: Arr
FREE
BoxInside MT4
Evgeny Shevtsov
4.83 (6)
This indicator calculates the volume profile and places labels that correspond to the VAH, VAL and POC levels, for each candle individually. Indicator operation features The indicator works on the timeframes from M5 to MN, but it uses the history data of smaller periods: M1 - for periods from M5 to H1, M5 - for the H4 period, M30 - for the D1 period, H4 - for the W1 period, D1 - for the MN period. The color and location of the VAL, VAH and POC labels on the current candle are considered to be c
FREE
The   Volume Weighted ATR indicator   is a helpful tool for measuring market activity. It is based on the idea of the Volume-Weighted ATR. Combining these two elements helps identify potential turning points or breakout opportunities. The indicator for the classification of the activity of the market uses the moving average and its multiples. Accordingly, where the VWATR bar is located (relative to the moving average), it is labelled as ultra-low, low, average, high, very high or ultra high. Th
FREE
High Low Open Close MT4
Alexandre Borela
4.81 (21)
If you like this project, leave a 5 star review. This indicator draws the open, high, low and closing prices for the specified period and it can be adjusted for a specific timezone. These are important levels looked by many institutional and professional traders and can be useful for you to know the places where they might be more active. The available periods are: Previous Day. Previous Week. Previous Month. Previous Quarter. Previous year. Or: Current Day. Current Week. Current Month. Current
FREE
The indicator analyzes the change in the minimum and maximum prices of the previous bars fixing the entrance of the big players. If the change (delta) increases, a signal is displayed on the graph in the form of an arrow. At the same time, virtual trade on history is carried out. In the free version, virtual trade is performed without refills in case of a repeat of the signal. The results of virtual trading in the form of losses / losses, profitability, drawdown and transaction lines are display
FREE
Cumulative Delta MT4
Evgeny Shevtsov
4.86 (29)
The indicator analyzes the volume scale and splits it into two components - seller volumes and buyer volumes, and also calculates the delta and cumulative delta. The indicator does not flicker or redraw, its calculation and plotting are performed fairly quickly, while using the data from the smaller (relative to the current) periods. The indicator operation modes can be switched using the Mode input variable: Buy - display only the buyer volumes. Sell - display only the seller volumes. BuySell -
FREE
TrendXpert Indicator
Samuel Ayienda Omanga
TrendXpert Indicator v1.02 – Master the Trend, Trade with Precision Overview TrendXpert v1.02 is a precision tool built for serious traders who want to stay on the right side of the market. Designed specifically for the 4H, 1H, and 30M timeframes, it helps you identify high-probability trend conditions and delivers timely, clean trade signals—without clutter or confusion. What’s New in v1.02 Enhanced Trend Detection : Improved internal logic ensures even greater accuracy in trend labeling and
FREE
The Multi-Timeframe ATR is an enhanced version of the standard ATR indicator for MetaTrader 4 that allows traders to view volatility from any timeframe directly on their current chart. Unlike the default ATR, which only plots data from the active chart timeframe, this version lets you select a higher or lower timeframe (for example, display the Daily ATR while analysing a 15-minute chart ). How It Works The indicator retrieves ATR values from the timeframe you specify — such as H1, H4, or D1 —
FREE
PZ Penta O MT4
PZ TRADING SLU
2.33 (3)
The Penta-O is a 6-point retracement harmonacci pattern which usually precedes big market movements. Penta-O patterns can expand and repaint quite a bit. To make things easier this indicator implements a twist: it waits for a donchian breakout in the right direction before signaling the trade. The end result is an otherwise repainting indicator with a very reliable trading signal. The donchian breakout period is entered as an input. [ Installation Guide | Update Guide | Troubleshooting | FAQ | A
FREE
The ProfileVolumesMarket indicator calculates tick volume on each price level in a selected range. Volume is vital when determining strength and therefore significance of price levels. The calculation range is set by a trader by means of moving two vertical lines. Thus the indicator allows to track important levels on different steps of a symbol price formation. A histogram of volume profile can be displayed on the chart (or removed from the chart) if you press "ON" ("OFF") button. When you chan
Pips Hunter PRO MT4
Rodrigo Arana Garcia
Pips Hunter PRO has been developed over several years and is an improved version of its predecessor. This powerful indicator analyzes the market and price history to generate buy and sell entries. For the calculation of these entries it uses different indicators that work together as well as a complex statistical logarithm that filters out less favorable entries and eliminates them / MT5 version . Features No repainting This indicator does not change its values when new data arrives No lag T
FREE
SMA Indicator
Nitu Brijesh Yadav
Arrow Indicator (Buy/Sell Alerts) – Simple Yet Powerful Tool!             Product Version: 1.01           Indicator Type: Trend Reversal Signals           Timeframes Supported: All (Recommended: H1, H4, D1)           Key Features: Buy Signal: Green upward arrow () appears below the candle  Sell Signal : Red downward arrow () appears above the candle Accurate Trend Reversal Detection – Based on tried and tested SMA strategy. ️ Clean Chart View – Minimalist, non-i
FREE
BoxProfile MT4
Evgeny Shevtsov
4.92 (12)
The indicator displays volume profiles based on the nesting principle. Profiles periods are pre-set so that each subsequent profile has a length twice as long as the length of the previous profile. In addition to profiles, the indicator displays volume clusters sorted by color, depending on the volume they contain. Indicator operation features The indicator works on typical timeframes from M5 to MN, but for calculations uses historical data from smaller timeframes: M1 - for timeframes from M5
FREE
Investment Castle Volatility Index MT4
Ahmed Alaaeldin Abdulrahman Ahmed Elherzawi
3.67 (3)
Investment Castle Volatility Index has the following features: 1. This indicator shows the volumes of the current symbol and the market volatility. 2. This indicator is built-in in the Investment Castle EA which works as volatility index for the EA dynamic distance and opposite start. 3. Parameters available for optimization for each pairs. 4. Works with any chart.
FREE
Moving Average Convergence Divergence (MACD) combined with Traders Dynamic Index (TDI) Input parameters: signal mode: true if you want to plug it into STAT (Signal Tester and Trader) arrow shift: distance between TDI line to arrow on chart middle band: use middle band (middle bolinger band) signal filter price line: use 50 price line signal filter RSI period RSI price method volatility period moving average RSI period moving average signal period moving average method use MACD indicator fast MAC
FREE
AQ XFifteen
HIT HYPERTECH INNOVATIONS LTD
4 (7)
Χ15 indicator is a MetaTrader 4 tool that allows you to BUILD & BACKTEST ON REAL TIME your own strategies quickly, easily and efficiently. It contains 15 of the most popular technical analysis indicators that you can use, each one in a different way. Choose the indicators that you want to use, select how you will use them and you will see on the chart BUY (green) and SELL (red) arrows implementing your strategy. Choose Take Profit and Stop Loss and you will see the results of your strategy with
FREE
Colored Candle Time
Saeed Hatam Mahmoudi
Candle Time (MT4) The Candle Time indicator shows the remaining time for the current candle on the active chart timeframe. It adapts automatically to the chart period and updates on every tick. This is a charting utility; it does not provide trading signals and does not guarantee any profit. Main functions Display the time remaining for the current candle on any timeframe (M1 to MN). Color-coded state: green when price is above the open (up), gray when unchanged, and red when below the open (do
FREE
Deep Insight Candles is an indicator that brings an entirely new perspective to the price chart. It focuses on revealing hidden structures in market movements, uncovering buyer and seller pressure, thus helping traders to better identify key levels, dynamics, and potential reversals. The indicator conveys deeper market insights, allowing traders to make decisions based on a more accurate perception of market sentiment and pressure at specific price levels. This innovative approach transforms the
VWap Bands EForex
Veridiana Adorno Kendrick
VWAP Bands Metatrader 4 Forex Indicator The VWAP Bands Metatrader 4 Forex indicator is a quite similar to the Bollinger bands, but it deploys volume weighted average as the core value of the bands. There is an option of using the tick volume or real volume for calculation when using the VWAP Bands Metatrader 5 custom forex indicator, especially when the forex broker displays symbol alongside real volume. Similarly, you can decide to have deviations calculated with the sample correction or not.
Buyers of this product also purchase
Gann Made Easy
Oleg Rodin
4.83 (157)
Gann Made Easy is a professional and easy to use Forex trading system which is based on the best principles of trading using the theory of W.D. Gann. The indicator provides accurate BUY and SELL signals including Stop Loss and Take Profit levels. You can trade even on the go using PUSH notifications. PLEASE CONTACT ME AFTER PURCHASE TO GET TRADING  INSTRUCTIONS AND GREAT EXTRA INDICATORS   FOR FREE! Probably you already heard about the Gann trading methods before. Usually the Gann theory is a ve
Scalper Inside PRO
Alexey Minkov
4.74 (69)
An exclusive indicator that utilizes an innovative algorithm to swiftly and accurately determine the market trend. The indicator automatically calculates opening, closing, and profit levels, providing detailed trading statistics. With these features, you can choose the most appropriate trading instrument for the current market conditions. Additionally, you can easily integrate your own arrow indicators into Scalper Inside Pro to quickly evaluate their statistics and profitability. Scalper Inside
The " Dynamic Scalper System " indicator is designed for the scalping method of trading within trend waves. Tested on major currency pairs and gold, compatibility with other trading instruments is possible. Provides signals for short-term opening of positions along the trend with additional price movement support. The principle of the indicator. Large arrows determine the trend direction. An algorithm for generating signals for scalping in the form of small arrows operates within trend waves.
Atomic Analyst
Issam Kassas
5 (3)
First of all Its worth emphasizing here that this Trading Indicator is   Non-Repainting , Non Redrawing and Non Lagging Indicator   Indicator, Which makes it ideal from both manual and robot trading.  User manual: settings, inputs and strategy . The Atomic Analyst  is a PA Price Action Indicator that uses Strength and Momentum of the price to find a better edge in the market. Equipped with Advanced filters which help remove noises and false signals, and Increase Trading Potential. Using Multiple
M1 Sniper
Oleg Rodin
5 (19)
M1 SNIPER is an easy to use trading indicator system. It is an arrow indicator which is designed for M1 time frame. The indicator can be used as a standalone system for scalping on M1 time frame and it can be used as a part of your existing trading system. Though this trading system was designed specifically for trading on M1, it still can be used with other time frames too. Originally I designed this method for trading XAUUSD and BTCUSD. But I find this method helpful in trading other markets a
Trend Lines PRO
Roman Podpora
5 (1)
TREND LINES PRO    helps understand where the market is truly changing direction. The indicator shows real trend reversals and points where major players re-enter. You see   BOS lines   Trend changes and key levels on higher timeframes — without complex settings or unnecessary noise. Signals don't repaint and remain on the chart after the bar closes. VERSION MT 5     -     Reveals its maximum potential when paired with the   RFI LEVELS PRO  indicator What the indicator shows: Real shifts   tren
Dynamic Forex28 Navigator
Bernhard Schweigert
4.43 (7)
Specials Discount now. The Next Generation Forex Trading Tool. Dynamic Forex28 Navigator is the evolution of our long-time, popular indicators, combining the power of three into one: Advanced Currency Strength28 Indicator (695 reviews) + Advanced Currency IMPULSE with ALERT (520 reviews) + CS28 Combo Signals (recent Bonus) Details about the indicator  https://www.mql5.com/en/blogs/post/758844 What Does The Next-Generation Strength Indicator Offer? Everything you loved about the originals, now
Volatility Trend System - a trading system that gives signals for entries. The volatility system gives linear and point signals in the direction of the trend, as well as signals to exit it, without redrawing and delays. The trend indicator monitors the direction of the medium-term trend, shows the direction and its change. The signal indicator is based on changes in volatility and shows market entries. The indicator is equipped with several types of alerts. Can be applied to various trading ins
First of all Its worth emphasizing here that this Trading Tool is Non-Repainting Non-Redrawing and Non-Lagging Indicator Which makes it ideal for professional trading . [Online course] ,   and   [manual] The Smart Price Action Concepts Indicator is a very powerful tool for both new and experienced traders . It packs more than 20 useful indicators into one combining advanced trading ideas like Inner Circle Trader Analysis and Smart Money Concepts Trading Strategies . This indicator focuses on Sm
Technical indicator that structures charts and identifies cyclical price movements. Can work on any charts. Several types of alerts. There are additional arrows on the chart itself. Without redrawing on history, works on closing a candle. Recommended TF from M5 and higher. Easy to use and configure parameters. When using 2 indicators with different parameters, you can use without other indicators. Has 2 input parameters Cyclicality and Signal duration These 2 parameters work with the processin
Trend indicator AI
Ramil Minniakhmetov
4.49 (84)
Trend Ai indicator is great tool that will enhance a trader’s market analysis by combining trend identification with actionable entry points and reversal alerts.  This indicator empowers users to navigate the complexities of the forex market with confidence and precision Beyond the primary signals, Trend Ai indicator identifies secondary entry points that arise during pullbacks or retracements, enabling traders to capitalize on price corrections within the established trend. Important Advantage
Scalper Vault
Oleg Rodin
5 (36)
Scalper Vault is a professional scalping system which provides you with everything you need for successful scalping. This indicator is a complete trading system which can be used by forex and binary options traders. The recommended time frame is M5. The system provides you with accurate arrow signals in the direction of the trend. It also provides you with top and bottom signals and Gann market levels. The indicator provides all types of alerts including PUSH notifications. PLEASE CONTACT ME AFT
GOLD Impulse with Alert
Bernhard Schweigert
4.67 (12)
This indicator is a super combination of our 2 products  Advanced Currency IMPULSE with ALERT  and  Currency Strength Exotics . It works for all time frames and shows graphically impulse of strength or weakness for the 8 main currencies plus one Symbol! This Indicator is specialized to show currency strength acceleration for any symbols like Gold, Exotic Pairs, Commodities, Indexes or Futures. Is first of its kind, any symbol can be added to the 9th line to show  true currency strength accelerat
New Update of Smart Trend Trading System MT5 For  2026 Market: If You Buy this Indicator you will Get my Professional   Trade Manager + EA  for   FREE . First of all Its worth emphasizing here that this Trading System is   Non-Repainting   , Non Redrawing and Non Lagging Indicator   Which makes it ideal from both manual and robot trading .  [Online course] ,   [manual]   and   [download presets] . The Smart Trend Trading System MT5 is a comprehensive trading solution tailored for   new   and   e
Advanced Supply Demand
Bernhard Schweigert
4.91 (299)
Trading Special – 40% OFF Best Solution for any Newbie or Expert Trader! This indicator is a unique, high quality and affordable trading tool because we have incorporated a number of proprietary features and a new formula. With this update, you will be able to show double timeframe zones. You will not only be able to show a higher TF but to show both, the chart TF, PLUS the higher TF: SHOWING NESTED ZONES. All Supply Demand traders will love it. :) Important Information Revealed Maximize the pot
The Super Arrow Indicator provides non-repainting buy and sell signals with exceptional accuracy. Key Features No repainting – confirmed signals remain fixed Clear visual arrows: green for buy, red for sell Real-time alerts via pop-up, sound, and optional email Clean chart view with no unnecessary clutter Works on all markets: Forex, gold, oil, indices, crypto Adjustable Parameters TimeFrame Default: "current time frame" Function: Sets the time frame for indicator calculation Options: Can be set
CRT Multi-Timeframe Market Structure & Liquidity Sweep Indicator Non-Repainting | Multi-Asset | MT5 Version Available MT5 Version:   https://www.mql5.com/en/market/product/162075 Full User Guide — explains what each feature does and why:   https://www.mql5.com/en/blogs/post/767525 Quick Start User Guide  — explains how to configure and in what order:  https://www.mql5.com/en/blogs/post/767540 Indicator Overview CRT Ghost Candle HTF Fractal is a complete institutional-grade market structure too
Auto Optimized Parabolic RSI: Advanced 3D Momentum Engine Most retail indicators fail because they rely on static inputs that break the moment market volatility shifts. Auto Optimized Parabolic RSI solves the problem of "indicator decay" by continuously recalculating its own mathematical edge, bringing institutional-grade quantitative adaptation directly to your MT5 terminal. The Core Advantage: Custom In-Memory 3D Optimization   Standard auto-optimizers often freeze the MT5 platform because the
Scalping Entry Points - is a manual trading system that can adjust to price movements and give signals to open trades without redrawing. The indicator determines the direction of the trend by the central level of support and resistance. The dot indicator provides signals for entries and exits.  Suitable for manual intraday trading, scalping and binary options. Works on all time frames and trading instruments. The indicator gives several types of alerts. How to use the product The blue line det
FX Volume
Daniel Stein
4.63 (38)
FX Volume: Experience Genuine Market Sentiment from a Broker’s Perspective Quick Overview Looking to elevate your trading approach? FX Volume provides real-time insights into how retail traders and brokers are positioned—long before delayed reports like the COT. Whether you’re aiming for consistent gains or simply want a deeper edge in the markets, FX Volume helps you spot major imbalances, confirm breakouts, and refine your risk management. Get started now and see how genuine volume data can
Trading Special – 40% OFF Best Solution for any Newbie or Expert Trader! This dashboard software is working on 28 currency pairs plus one. It is based on 2 of our main indicators (Advanced Currency Strength 28 and Advanced Currency Impulse). It gives a great overview of the entire Forex market plus Gold or 1 indices. It shows Advanced Currency Strength values, currency speed of movement and signals for 28 Forex pairs in all (9) timeframes. Imagine how your trading will improve when you can watch
Super Reversal Indicator with Alert Overview Super Reversal Indicator with Alert is a multi timeframe trading tool designed to identify high probability market reversal opportunities using a combination of stochastic momentum, supply and demand zones, and price rejection signals. The indicator helps traders detect potential turning points in the market with clear visual signals and real time alerts. Key Features Multi Timeframe Stochastic Analysis Uses stochastic oscillator from a higher timefra
Meravith
Ivan Stefanov
5 (3)
Market makers' tool. Meravith will: Analyze all timeframes and display the current trend in force. Highlight liquidity zones (volume equilibrium) where bullish and bearish volumes are equal. Display all liquidity levels across different timeframes directly on your chart. Generate and present text-based market analysis for your reference. Calculate targets, support levels, and stop-loss points based on the current trend. Compute the risk/reward ratio for your trades. Determine position size accor
Market Maker Reversal Scanner
Siyasanga Stephen Mabokela
Market Maker Reversal Scanner — Professional Watchlist Builder for Reversal Traders (MT4/MT5) If you trade reversals, your biggest enemy isn’t entries — it’s watchlist selection . Most traders waste hours scrolling charts and end up forcing trades on “meh” instruments. Market Maker Reversal Scanner solves that by doing one job extremely well: It scans your symbols and highlights the instruments that are “in play” for reversal conditions — so you can focus on the best setups during your session i
Early reversals made easy A personal implementation of Order Blocks, a simple yet effective position trading strategy. The trader should enter the market or look for trades in the direction of the last order block, if the price range has not been breached in the opposite direction of the breakout. Open blocks are not drawn for clarity. [ Installation Guide | Update Guide | Troubleshooting | FAQ | All Products ] A bullish open block is the first bullish bar after a fresh market low A bearish ope
RFI levels PRO
Roman Podpora
5 (1)
The indicator accurately shows the reversal points and price return zones where the   Major players . You see where new trends are forming and make decisions with maximum precision, maintaining control over every trade. VERSION MT5     -     Reveals its maximum potential when combined with the   TREND LINES PRO   indicator What the indicator shows: Reversal structures and reversal levels with activation at the beginning of a new trend. Display of   TAKE PROFIT   and   STOP LOSS   levels with mi
Pips Generator
Oleg Rodin
4.6 (10)
Apollo Pips Generator  is a channel based indicator which provides entry signals in the direction of the trend. The indicator provides multiple entry points so you can always find a trading opportunity to profit on. The tool also provides you with clear exit signals in a form of stars. ALL SIGNALS DO NOT REPAINT! The indicator can be used with any forex pair and time frame. The indicator provides all types of alerts including PUSH notifications. PLEASE CONTACT ME AFTER PURCHASE TO GET TRADING IN
TrendLine PRO MT4
Evgenii Aksenov
4.83 (167)
The Trend Line PRO indicator is an independent trading strategy. It shows the trend change, the entry point to the transaction, as well as automatically calculates three levels of Take Profit and Stop Loss protection. Trend Line PRO is perfect for all Meta Trader symbols: currencies, metals, cryptocurrencies, stocks and indices. The indicator is used in trading on real accounts, which confirms the reliability of the strategy. Robots using   Trend Line PRO   and real Signals can be found here:   
CyberZingFx Volume Plus
Afsal Meerankutty
4.94 (17)
Advanced version of CyberZingFx Volume Plus, the ultimate MT4 indicator for traders seeking highly accurate buy and sell signals. With an additional strategy and price action dot signals that enhances its effectiveness, this indicator offers a superior trading experience for professionals and beginners alike. The CyberZingFx Volume Plus Advanced version combines the power of volume analysis and historical price data with an additional strategy, resulting in even more precise and reliable signals
Support Resistance screnner
STE S.S.COMPANY
4.95 (37)
Support And Resistance Screener  Breakthrough unique Solution With All Important levels analyzer and Markets Structures Feature Built Inside One Tool! Our indicator has been developed by traders for traders and with one Indicator you will find all Imporant market levels with one click. LIMITED TIME OFFER : Support and Resistance Screener Indicator is available for only 50 $ and lifetime. ( Original price 125$ )  (offer extended) The available tools ( Features ) in our Indicator are :  1. HH-LL
More from author
UPD1 Volume BOX
Vitaliy Kuznetsov
4.94 (16)
The indicator displays the horizontal volume profile in the specified area (BOX) and the maximum volume (POC). Product Features. 1. You can use ticks or just price. 2. Adaptive grid spacing (M1-MN). 3. Adaptive high volume (median) search step depending on box size. 4. Automatic chameleon color for box lines and buttons. 5. Multiple boxes, easy to create and delete. 6. 70% volume area (enable in settings). 7. There is an alert for touching the maximum horizontal volume line (POC). 8. VWAP. 9. C
UPD1 Profile Levels MT5
Vitaliy Kuznetsov
5 (4)
The indicator finds the levels of the maximum and minimum price volume (market profile) on the working histogram for the specified number of bars.  Composite profile . The height of the histogram is fully automatic and adapts to any instrument and timeframe. The author's algorithm is used and does not repeat well-known analogues. The height of the two histograms is approximately equal to the average height of the candle. Smart alert will help you to inform about the price concerning the volume l
UPD1 Trend Direction
Vitaliy Kuznetsov
4.63 (8)
This indicator is used to display the places of the flat and trend. The construction is based on an oscillator. It is used as an additional filter, both for trading on a regular chart and for binary options. Flat places are used in the UPD1 Volume Cluster indicator for trading according to the concept of smart money The built-in alert signals the places of the greatest overbought/oversold. Input parameters. Main Settings. Bars Count - indicate the number of bars on which the trend direction w
FREE
UPD1 Volume Footer
Vitaliy Kuznetsov
4.85 (13)
The indicator shows the vertical volume. In the settings there are 2 coefficients for determining high and extreme volume and 1 for determining low volume. A similar algorithm is also used in the UDP1 Volume Pixel indicator . When the specified volume is detected, the histogram is painted in the appropriate color. The width of the histogram is selected automatically, depending on the scale. As a rule, the price reacts to the maximum and minimum volume. But it is necessary to use confirmation si
FREE
The indicator builds a three-period semaphore and reversal pattern 123 from the extremum. The signal comes at the opening of the second candle. This pattern can be traded in different ways (test point 3, breakout and others). Exit from the channel or breakout of the trendline is the main trigger for finding an entry point. Icons are colored according to Fibonacci levels. Yellow icons indicate a test of a level at which the signal is amplified. Using the multi-currency dashboard, you can track w
UPD1 Rsi Dots Dashboard
Vitaliy Kuznetsov
5 (2)
The indicator shows signals based on the terminal RSI oscillator on the chart. It is possible to filter out repeated signals. Here the oscillator is used to search for a reverse signal. It is recommended as an entry point in swing strategies and trading from levels. A multi-currency dashboard is available. With it, you can easily switch between charts. In product discussions, you can suggest an algorithm in which you can embed a dashboard. Input parameters. Main Settings. Bars Count – the n
FREE
The indicator shows   round levels   on the chart. They are also called   psychological , banking, or levels of major players. At these levels, there is a real fight between bulls and bears, the accumulation of many orders, which leads to increased volatility. The indicator   automatically   adjusts to any instrument and timeframe. When the   level 80   is broken through and then tested, we   buy. When   level 20   is broken through and then tested, we   sell. The target is 00. Attention. Due to
FREE
The meaning of this indicator is to   find Murray levels on all timeframes   and combine them into   combo levels , including signal levels based on strong Murray levels (+2, +1, 8, 4, 0, -1, -2). The lower the timeframe, the more chances you have to see the combo level immediately. It will be highlighted in color. When you hover over any number, a hint will pop up to which timeframe the level belongs to. But you will always see the current timeframe as the leftmost one. A  smart alert  will he
UPD1 Profile Levels
Vitaliy Kuznetsov
5 (6)
The indicator finds the levels of the maximum and minimum price volume (market profile) on the working histogram for the specified number of bars.  Composite profile . The height of the histogram is fully automatic and adapts to any instrument and timeframe. The author's algorithm is used and does not repeat well-known analogues. The height of the two histograms is approximately equal to the average height of the candle. Smart alert will help you to inform about the price concerning the volume
UPD1 Fibo Levels
Vitaliy Kuznetsov
5 (3)
The indicator analyzes the specified number of candles and plots Fibonacci levels based on the high-low. Since the levels are rearranging, we are interested in the right side of the range. The price magnetizes the levels and reacts to the touch. Use this tool to find a trend entry point after a correction. If on the left we see that the levels have risen perfectly, then we can assume that we have found the end of the movement at the extreme point. All lines are drawn through buffers or objects (
FREE
UPD1 Watermark MT4
Vitaliy Kuznetsov
5 (2)
The indicator shows any text and any image on the chart, and can also output the information requested by macros. There are three text blocks and one block for images. Available font selection, size, color, indentation and positioning. If you want to brand your screenshots or display the necessary information on a graph, then UPD1 Watermark will be a very useful tool. Description of settings. Text Settings (3 blocks). Text 1, 2, 3 – enter the text and, or a macro. Font Name – write the font n
FREE
The indicator shows a signal on the chart when the second candlestick is inside the first candlestick, i.e. has not gone beyond its limits. This candlestick pattern is called the Inside Bar. This pattern is not as popular as Pin Bar or Engulfing, but it is sometimes used by some traders. There is a possibility to filter by trend (2 moving averages) and by reversal (RSI and Bollinger Bands). Multicurrency panel is available. With its help you can easily switch between charts. Trading patterns:
An indicator that displays the Engulfing candlestick pattern. In the settings, you can specify the type of engulfing (body, shadow and combination). It is possible to filter by trend (2 moving averages) and by reversal (RSI and Bollinger Bands). This is a very popular price action pattern. A multi-currency dashboard is available. With it, you can easily switch between charts. Trading Patterns: Retest by trend. False breakout. Order Block. Other. EURUSD, GBPUSD, XAUUSD, ... M15, M30, H1. Inpu
UPD1 Pivot Levels
Vitaliy Kuznetsov
5 (2)
The indicator shows on the chart the classic pivot levels calculated on the basis of the previous day . You can choose from what hour to calculate the formula. Trade on reversal levels in a flat. In a trending market, use them as a target. Combine with your strategies for successful trading. The levels are drawn using   buffers and displayed on the entire available quote   history. Input parameters. Start Hour - Choose from what hour to start building levels. 00 - Default. Show Mid Pivots - M
FREE
UPD1 Impulse Channel
Vitaliy Kuznetsov
5 (8)
The channel indicator is trending and does not repaint. It creates an ATR price channel with the opposite volatility border. The indicator has proven itself well in the strategy of trading on impulse levels and fake breakout. The entry point should be looked for on the correction to the indicator line, and the take profit should be set on the opposite border. Blog-Link -   Retest and Fake Breakout with UPD1 . Input parameters. Bars Count - history to display. ATR - average true range period.
FREE
UPD1 Volume TimeFrame POC
Vitaliy Kuznetsov
4.4 (5)
The indicator display the maximum horizontal volume on the selected timeframe. Based on the UPD1 Volume Box indicator . The lines can be connected or separated. In the settings, you can enable smart touch alert. Such an indicator will be useful for those who trade according to the market profile and the concept of smart money. Input parameters. Main Settings. Bars Count - indicate the number of bars on which the TF POC will be drawn. Data Source - the time frame from which the ticks will be u
FREE
UPD1 D Levels
Vitaliy Kuznetsov
5 (3)
Levels indicator based on the previous day. Mathematical formula determines entry and exit levels.  Trading recommendations. Levels are traded at the beginning of the European session when volatility appears. In case of insufficient volatility use half of take profit to exit. If the price reversed at half take profit, then on the reversal look for a target also at the level of half take profit. If the price bounced from the entry level, then in the opposite direction the price can reach the se
FREE
The Average True Range ( ATR ) is a measure of market volatility over a specified number of days. You should not expect a big continuation move when the price has reached the end of the range. The market is considered to have run out of fuel. If the price has not reached the edge, it still has a range. The indicator formula allows you to calculate High-Low levels both in aggregate and individually. You can also use these levels as support/resistance and target. Input parameters. Start Day - f
FREE
UPD1 Murrey Math Levels
Vitaliy Kuznetsov
5 (7)
Murray's mathematical levels are based on observations by Gann and his theory of the squareness of prices. According to Gann, the price moves in 1/8 of the range. These 1/8 allow us to get different resistance and support levels for a given chart, which have their own characteristics. After a breakout of -2 or +2 levels, or with a decrease in volatility, they are rebuilt. You can choose which period to display (current or entire history). All lines are drawn through buffers. Blog-Link -   Murrey
FREE
UPD1 X00 Levels
Vitaliy Kuznetsov
5 (10)
The indicator shows   round levels   on the chart. They are also called   psychological , banking, or levels of major players. At these levels, there is a real fight between bulls and bears, the accumulation of many orders, which leads to increased volatility. The indicator   automatically   adjusts to any instrument and timeframe. When the   level 80   is broken through and then tested, we   buy. When   level 20   is broken through and then tested, we   sell. The target is 00. Attention. Due t
FREE
UPD1 Impulse Level
Vitaliy Kuznetsov
5 (7)
The indicator finds impulse waves on the chart. Analyzes the breakdown of the fractal channel and builds impulse levels . In addition, it finds the alleged places of false breakouts and liquidity grabs . In the settings, you can enable a multi-currency dashboard and select any tools and timeframes. Notification Choose between the current schedule or the entire list. There are separate impulse and false breakdown signals. Blog-Link -  Retest and Fake Breakout with UPD1 . Trade Patterns: + Retes
UPD1 Impulse Candle
Vitaliy Kuznetsov
5 (1)
The indicator searches for impulse candles and displays them on the chart. It includes a shadow filter. It also finds breakout levels of Bollinger Bands. You can enable multi-currency dashboard in the settings. Alerting choose between the current chart or the entire list. Blog-Link -  Retest and Fake Breakout with UPD1 Trading patterns: Trend retest. False Breakout. Others. EURUSD, GBPUSD, XAUUSD, ... M15, M30, H1. Input parameters. Basic. Bars Count - the number of history bars on which th
UPD1 Volume Pixel
Vitaliy Kuznetsov
5 (3)
The indicator finds the low, high, extreme volume based on the specified coefficients and paints them in the specified colors. This replaces the standard volume drawing function in the metatrader terminal. Bars can also be painted in the color of the volume. On bars with extreme volume, the maximum horizontal volume (cluster/POC) is determined. Depending on its location (pushing, neutral, stopping), the cluster also has its own color. If the cluster is in the shadow, and the bar has an extreme
UPD1 Pin Bar Dashboard
Vitaliy Kuznetsov
5 (3)
An indicator that displays the Pin Bar candlestick pattern. With the help of coefficient settings, the ratio of shadow, body and size is easily adjusted. It is possible to filter by trend (2 moving averages) and by reversal (RSI and Bollinger Bands). This is the most popular price action pattern. A multi-currency dashboard is available. With it, you can easily switch between charts. Trading Patterns: Retest by trend. False breakout. Other. EURUSD, GBPUSD, XAUUSD, ... M15, M30, H1. Input para
The indicator searches for and displays large shadows on the chart automatically based on volatility. Shadows are additionally filtered by the wave size. The algorithm analyzes the fractal breakdown by the shadow in the specified range and displays the level. In the settings, you can enable a multi-currency dashboard. The alert is selected between the current schedule or the entire dashboard sheet. Signals for large shadows and those that have broken through the fractal level can be turned on s
The indicator displays the "Rails" pattern on the chart. This pattern consists of two multidirectional candles with identical bodies and small shadows. If on the current timeframe the pattern "Rails", then on the x2 timeframe it will look like a Pin Bar (Doji). This indicator was created to automatically find the pattern in the most efficient way with logically simple settings that you can easily change. There is an option to filter by trend (2 moving averages) and reversal (RSI and Bollinger B
Trading panel with preset orders and automatic lot calculation for the MT4 terminal. Attention, the Trading Panel does not work in the strategy tester (only trailing stop testing). Manual, Description, Download Light Demo. Successful traders are distinguished by self-discipline and competent money management. If you use a fixed lot, then you are at risk. After all, there are different distances on different timeframes and one unprofitable transaction can cover several profitable ones. If you use
The meaning of this indicator is to   find Murray levels on all timeframes   and combine them into   combo levels , including signal levels based on strong Murray levels (+2, +1, 8, 4, 0, -1, -2). The lower the timeframe, the more chances you have to see the combo level immediately. It will be highlighted in color. When you hover over any number, a hint will pop up to which timeframe the level belongs to. But you will always see the current timeframe as the leftmost one. A  smart alert  will hel
The indicator builds a three-period semaphore and reversal pattern 123 from the extremum. The signal comes at the opening of the second candle. This pattern can be traded in different ways (test point 3, breakout and others). Exit from the channel or breakout of the trendline is the main trigger for finding an entry point. Icons are colored according to Fibonacci levels. Yellow icons indicate a test of a level at which the signal is amplified. Using the multi-currency dashboard, you can track w
Filter:
Chapa
564
Chapa 2026.01.05 03:05 
 

Brilliant!! The author is providing for free what others charge for. A whole suite of volume based indicators. This one is sweet... like a gateway drug to the main course, Volume Box. Ahhh Vitaliy, I see what you did here. : )

Vitaliy Kuznetsov
44785
Reply from developer Vitaliy Kuznetsov 2026.01.05 09:38
Thank you for the high rating
18607983623
64
18607983623 2025.09.05 13:04 
 

怎么没有副图指标

Vitaliy Kuznetsov
44785
Reply from developer Vitaliy Kuznetsov 2025.09.05 19:02
感谢您的高度评价
Sokslegend
878
Sokslegend 2025.04.18 02:19 
 

This is a superb indicator if one knows how to use it.

Vitaliy Kuznetsov
44785
Reply from developer Vitaliy Kuznetsov 2025.04.18 05:04
Thank you for the high rating
nnminh
20
nnminh 2025.02.25 15:03 
 

I like it, have for MT5 platform?

Vitaliy Kuznetsov
44785
Reply from developer Vitaliy Kuznetsov 2025.02.25 18:18
Thank you for your high rating. There is no product on MT5
popcorn57
26
popcorn57 2025.02.17 14:09 
 

Trés bon indicateur, fiable, bon travail. Merci

Vitaliy Kuznetsov
44785
Reply from developer Vitaliy Kuznetsov 2025.02.17 19:10
Merci de votre appréciation
xlxAxlx
1493
xlxAxlx 2024.11.15 16:49 
 

User didn't leave any comment to the rating

Vitaliy Kuznetsov
44785
Reply from developer Vitaliy Kuznetsov 2024.11.21 06:52
Thank you for the high rating
Miketrader2
243
Miketrader2 2024.07.22 01:06 
 

Nice set of tools for analysing volume. Thank you for your job

Vitaliy Kuznetsov
44785
Reply from developer Vitaliy Kuznetsov 2024.07.22 09:02
Thank you for the high rating
jenaustria
259
jenaustria 2024.05.18 09:51 
 

User didn't leave any comment to the rating

Vitaliy Kuznetsov
44785
Reply from developer Vitaliy Kuznetsov 2024.05.18 12:16
Thank you for the high rating
rovinades
431
rovinades 2024.05.17 12:43 
 

User didn't leave any comment to the rating

Vitaliy Kuznetsov
44785
Reply from developer Vitaliy Kuznetsov 2024.05.17 13:11
Thank you for the high rating
Calix Fujimoto
467
Calix Fujimoto 2024.05.08 09:47 
 

User didn't leave any comment to the rating

Vitaliy Kuznetsov
44785
Reply from developer Vitaliy Kuznetsov 2024.05.08 13:01
Thank you for the high rating
_Striker_
150
_Striker_ 2024.05.03 13:06 
 

Это гениально. Еще ни разу не встречал чтобы подобную идею упаковали в индикатор. Да еще и в свободный доступ. Спасибо большое. Успехов Вам.

Vitaliy Kuznetsov
44785
Reply from developer Vitaliy Kuznetsov 2024.05.03 17:30
Спасибо за высокую оценку
Karlfx4
21
Karlfx4 2023.11.04 10:04 
 

The indicator is exactly what I was looking for it shows hidden distribution and accumulation on a chart, Going see how it performs in real time

Vitaliy Kuznetsov
44785
Reply from developer Vitaliy Kuznetsov 2023.11.04 10:51
Thank you for the high rating
Eric Raygoza
183
Eric Raygoza 2023.10.01 09:27 
 

I think this is a very good indicator, have just started using it, Thank you Vitaly.

Vitaliy Kuznetsov
44785
Reply from developer Vitaliy Kuznetsov 2023.10.01 09:35
Thank you for the high rating
topline8000
1144
topline8000 2023.08.13 10:54 
 

it's ok good

Vitaliy Kuznetsov
44785
Reply from developer Vitaliy Kuznetsov 2023.08.13 13:37
Ok
Suvashish Halder
163241
Suvashish Halder 2023.08.13 05:33 
 

It would be great if you can add 2 Buttons for the Chart. One Button show/hides Cluster Line and another Increase or Decrease Bars(input way) to Scan.

Vitaliy Kuznetsov
44785
Reply from developer Vitaliy Kuznetsov 2023.08.13 09:29
Thanks for the feedback, I'll think about it.
paddock
367
paddock 2023.05.22 12:05 
 

excellent, easy to follow but I agree with Martian Brown. Then it would be 10 stars :)

Vitaliy Kuznetsov
44785
Reply from developer Vitaliy Kuznetsov 2023.05.22 12:17
Thank you for the high rating. I 'll think about a new alert
yalewang
1120
yalewang 2023.05.03 11:31 
 

i can not understand

Vitaliy Kuznetsov
44785
Reply from developer Vitaliy Kuznetsov 2023.05.03 11:50
It's a pity that you made an assessment of the volume cluster indicator only because you didn't understand it
Edgar Dario Ortigoza Vera
458
Edgar Dario Ortigoza Vera 2023.03.27 00:20 
 

User didn't leave any comment to the rating

Vitaliy Kuznetsov
44785
Reply from developer Vitaliy Kuznetsov 2023.03.27 08:29
Gracias por la retroalimentación
emir2018
348
emir2018 2023.03.21 10:05 
 

super

Vitaliy Kuznetsov
44785
Reply from developer Vitaliy Kuznetsov 2023.03.21 10:24
Thanks
Martin Brown
803
Martin Brown 2023.01.26 11:51 
 

There should be an option to receive an alert when the "flat" bar first appears and is gray. But this indicator is still without a doubt marvelous.

Vitaliy Kuznetsov
44785
Reply from developer Vitaliy Kuznetsov 2023.01.26 13:00
Thanks for the rating
12
Reply to review