Multi Timeframe Candles

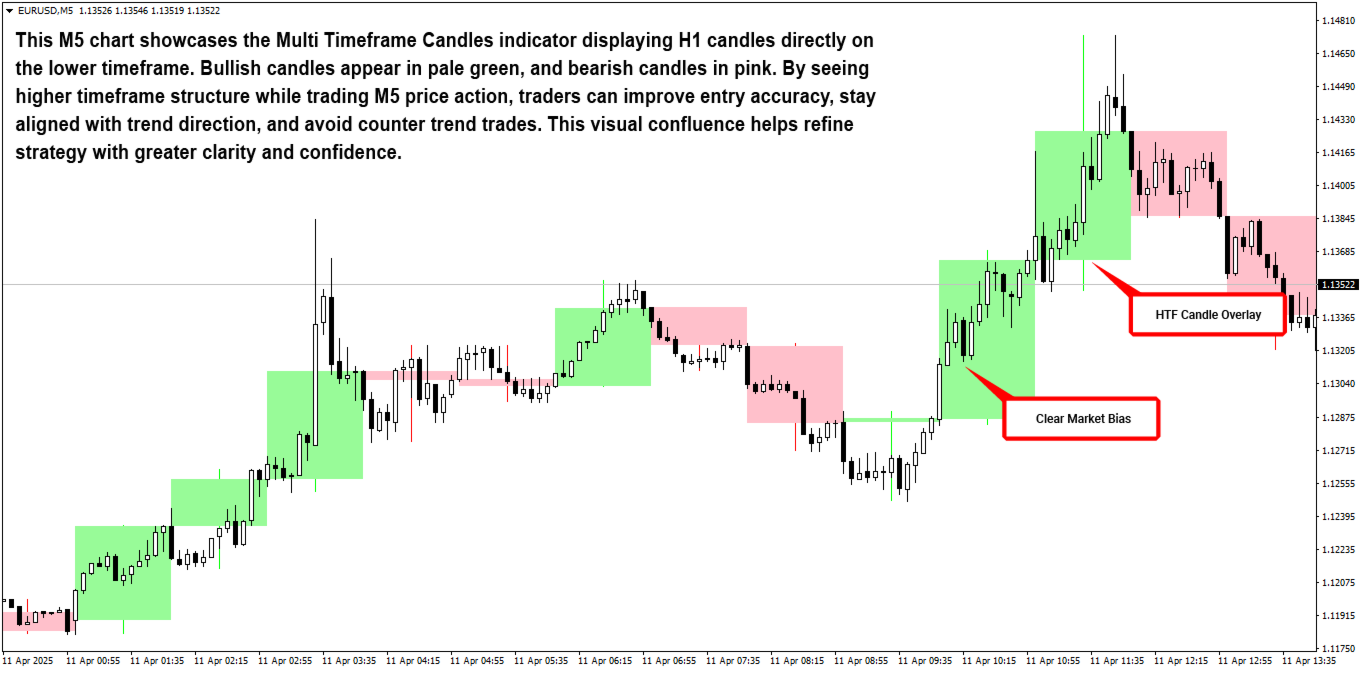
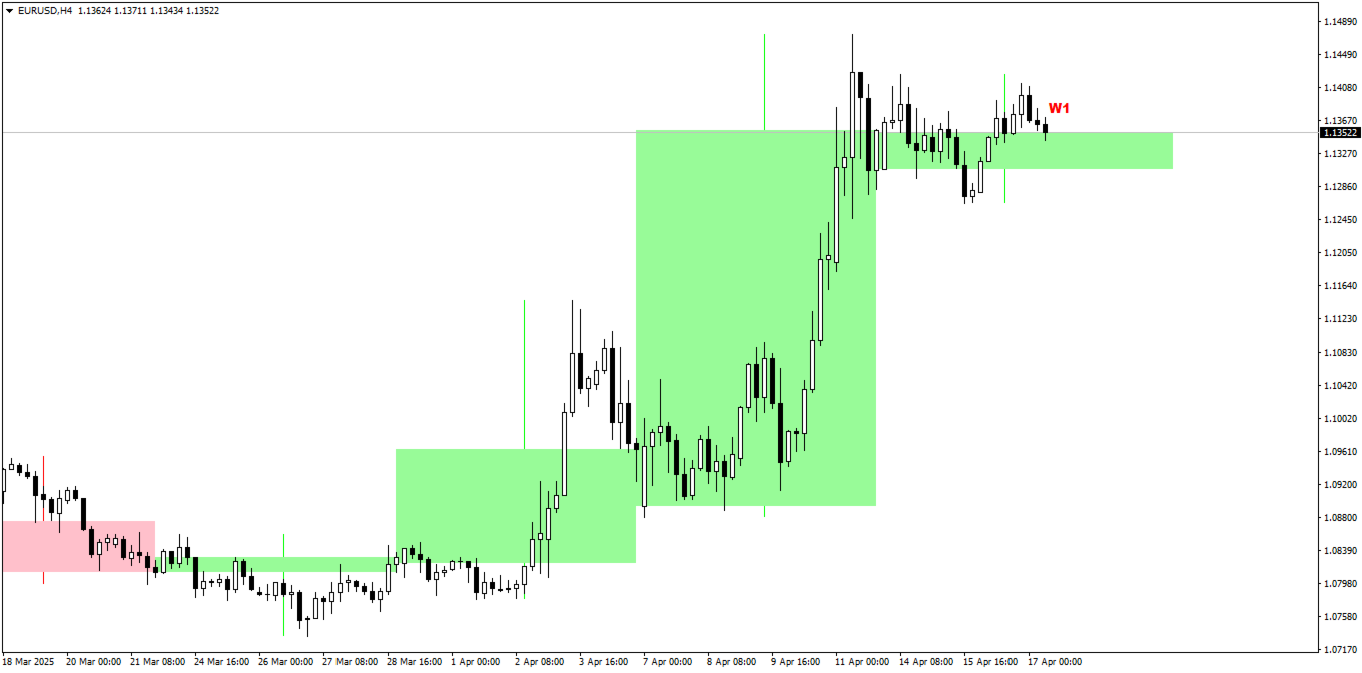
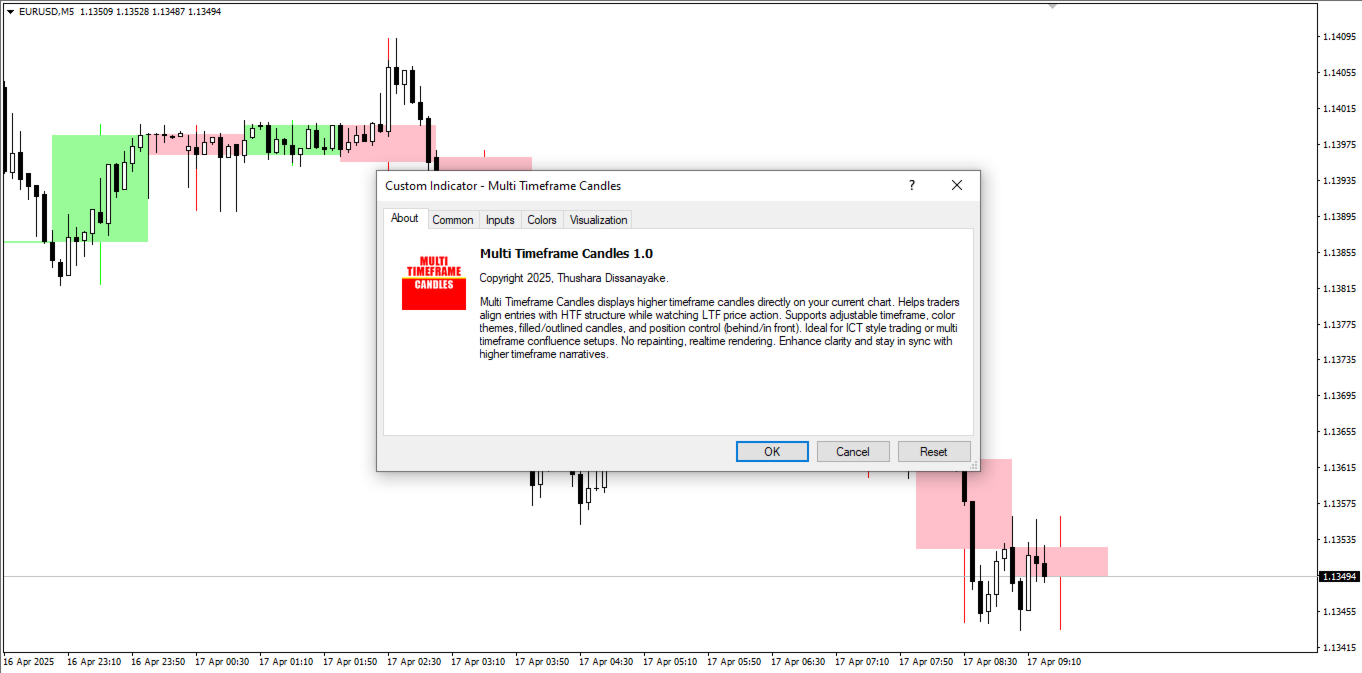
The Multi Timeframe Candles indicator is a powerful visualization tool designed to help traders align their lower timeframe analysis with higher timeframe structure. By plotting candles from a selected higher timeframe (H1, H4, D1, etc.) directly on your current chart, this indicator gives you a clearer perspective of the overall market narrative without switching charts.

Who Needs This Indicator?

This tool is ideal for:
  • Smart Money Concept (SMC) / ICT Traders who rely on higher timeframe bias while executing trades on lower timeframes.
  • Scalpers and Intraday Traders looking to stay in sync with daily or sessional momentum.
  • Swing Traders who want a quick glance at HTF structure while refining entries on smaller charts.

Whether you're trading price action, supply and demand, or trend-following systems, this indicator ensures your entries are backed by the strength of the higher timeframe.

Strategy Improvement

Multi Timeframe Candles helps improve:
  • Directional Bias Confirmation – Stay aligned with the dominant trend or market structure.
  • Refined Entries – Identify optimal entry zones (e.g., inside a bullish daily candle on a 5M chart).
  • Fakeout Filtering – Avoid traps by trading only in the direction of the HTF candle.
  • HTF Liquidity Awareness – Spot potential wicks and reaction zones from higher timeframes.

Key Features:

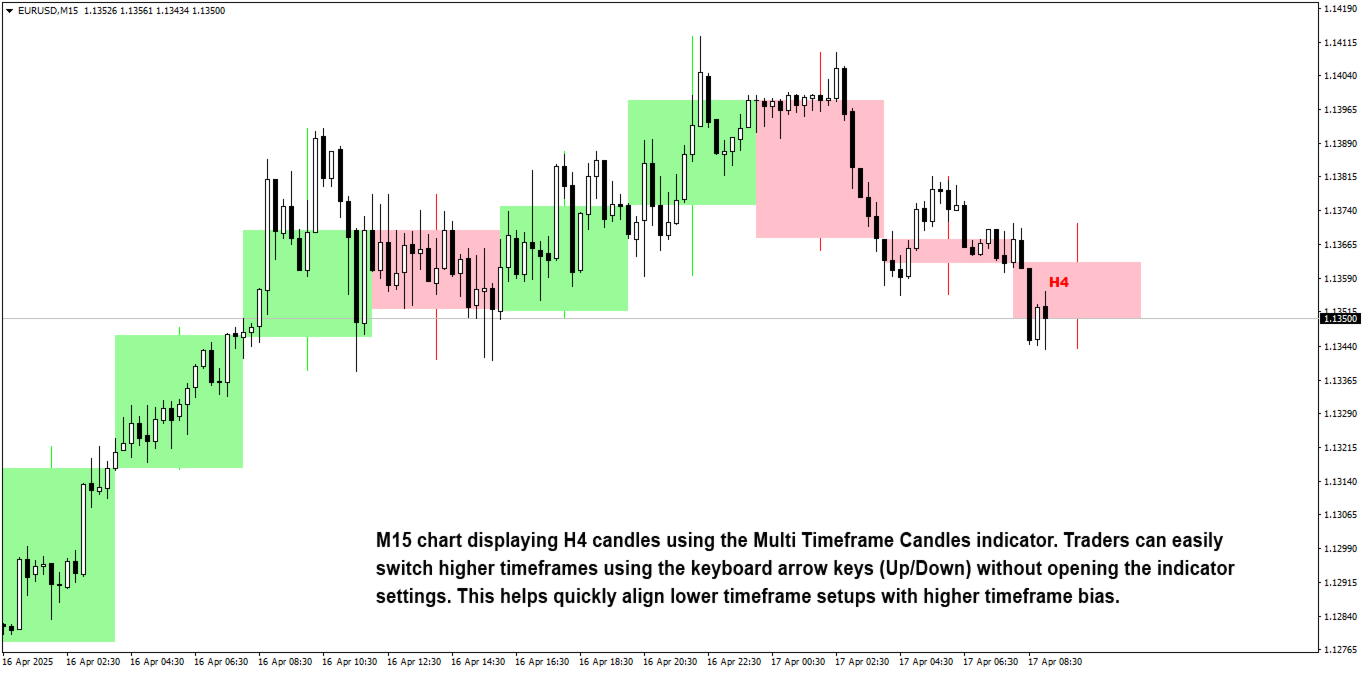
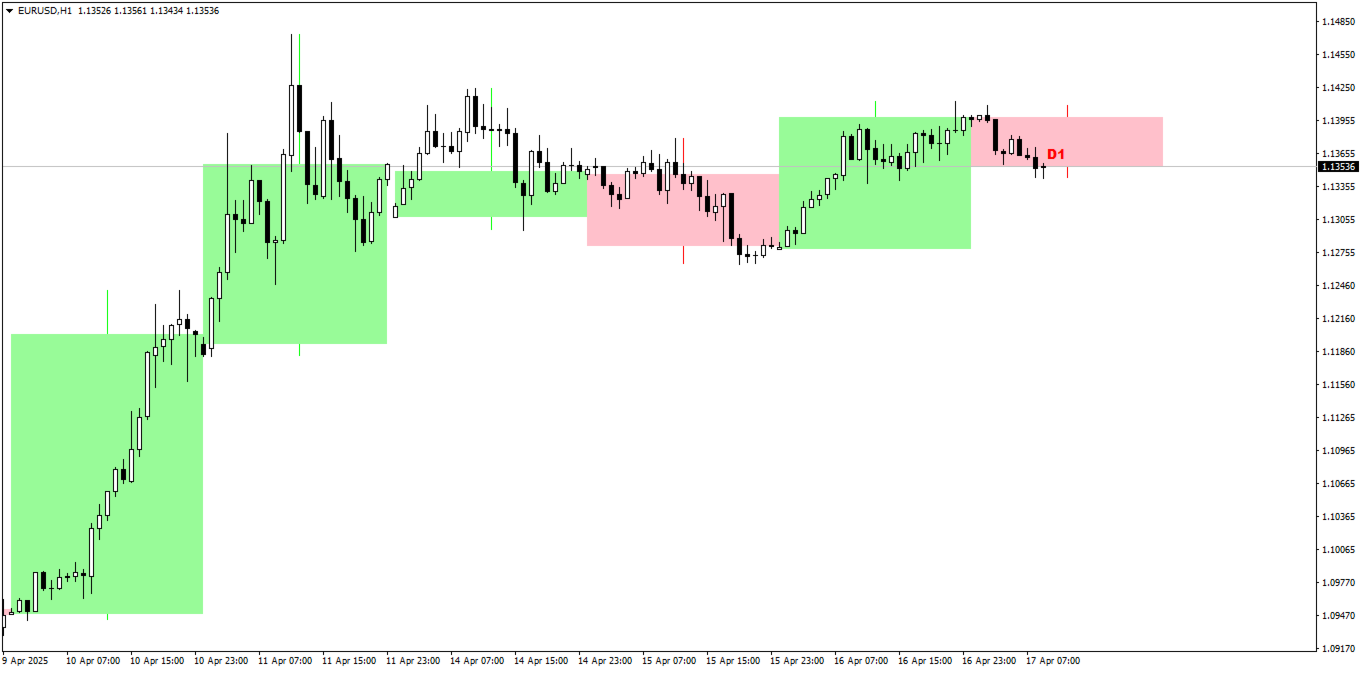
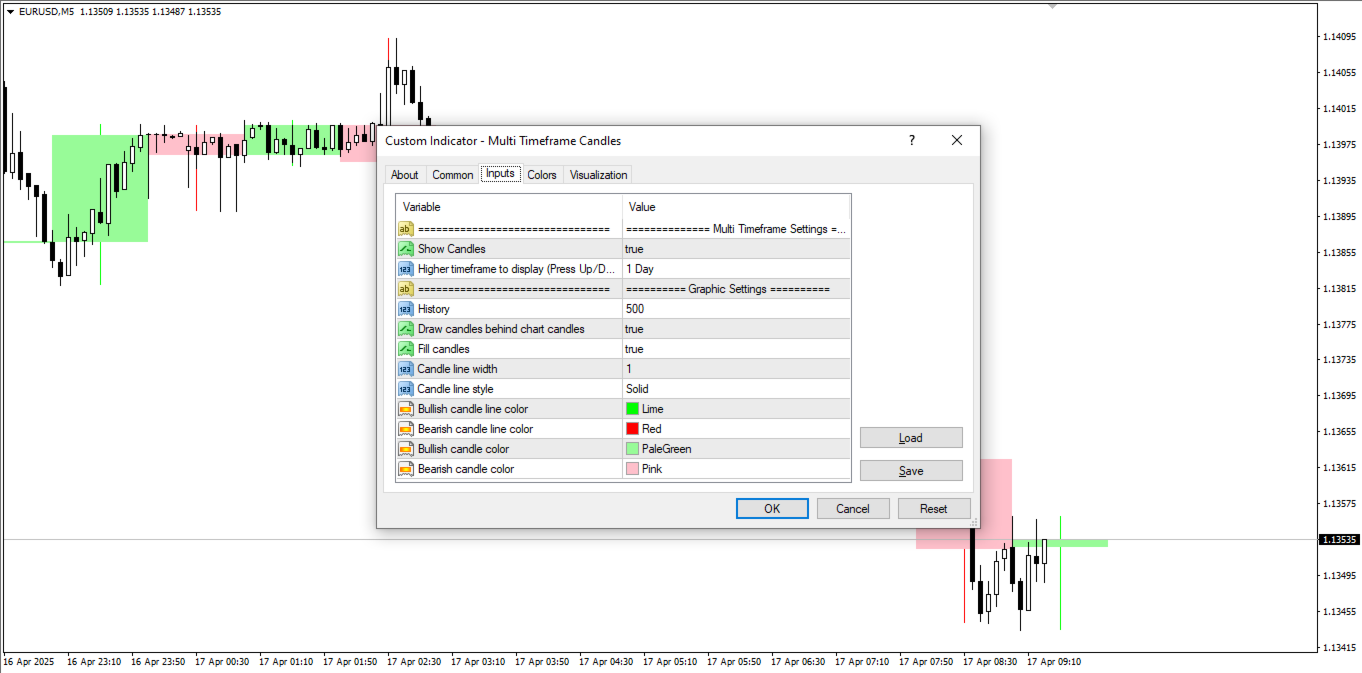
  • Choose any higher timeframe to overlay.
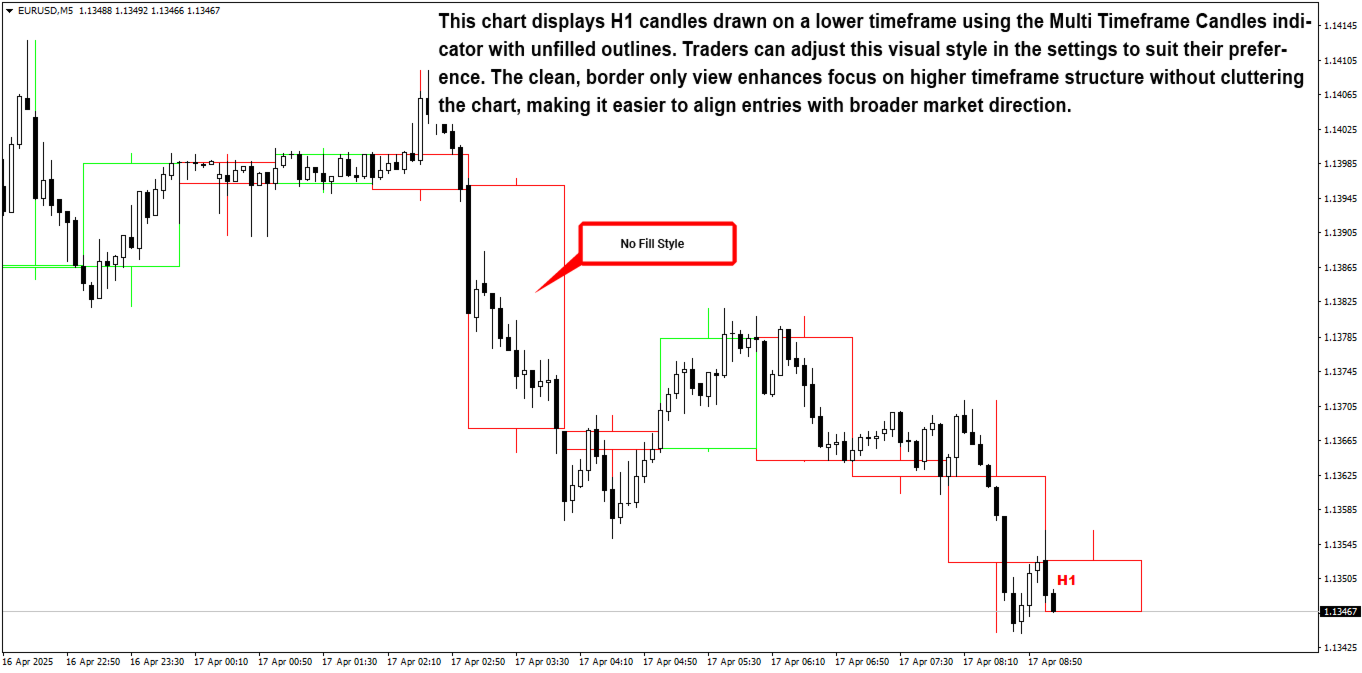
  • Customize candle colors, borders, and fill settings.
  • Display MTF candles behind or in front of your regular candles.
  • No repainting – all candles are calculated in real time.

Trade with confluence. Trade with confidence. The Multi Timeframe Candles indicator gives you the bigger picture, right where you need it.


Recommended products
MySNR - Precision Support & Resistance Line Indicator Discounted   Price   $50  !!     Secure your lifetime access   now   before it switches to   subscription-only ! Tired of drawing levels manually or guessing where the price will react inside a thick, messy zone? Now you can save time and trade with absolute confidence using the MySNR Indicator . Unlike traditional tools that plot broad and ambiguous zones, MySNR is engineered to automatically plot exact, pinpoint Support and Resistance lines
CRT Candle Range Theory HTF MT4.   Ultimate CRT Indicator: Advanced ICT Concepts and Malaysian SnR Trading System Discounted   Price   $50  !!     Secure your lifetime access   now   before it switches to   subscription-only ! Master the Market Maker's Footprints with the Most Advanced Candle Range Theory Indicator Unlock the true power of   Smart Money Concepts (SMC)   and trade precisely like the institutions with the   Ultimate CRT Indicator . Built exclusively for serious traders, this indic
Auto Fibo Pro m
DMITRII GRIDASOV
"Auto FIBO Pro"   Crypto_Forex  indicator  - is great auxiliary tool in trading! Indicator automatically calculate and place on chart Fibo levels and local trend lines (red color). Fibonacci levels indicate key areas where price can reverse. Most important levels are 23.6%, 38.2%, 50% and 61.8%. You can use it   for reversal scalping  or for zone grid trading. There are plenty of opportunities to  improve your current system using Auto FIBO Pro indicator as well. It has Info Spread Swap Displa
Daily Candle Predictor is an indicator that predicts the closing price of a candle. The indicator is primarily intended for use on D1 charts. This indicator is suitable for both traditional forex trading and binary options trading. The indicator can be used as a standalone trading system, or it can act as an addition to your existing trading system. This indicator analyzes the current candle, calculating certain strength factors inside the body of the candle itself, as well as the parameters of
Sniper Trend Fusion
Ilham Hijrah Saputra
Sniper Trend Fusion This indicator is a powerful all-in-one trading tool designed to simplify chart analysis and improve decision-making. It combines multiple proven techniques into a single system, helping traders identify trend direction, volatility, key price levels, and market structure without clutter. Instead of switching between multiple indicators, everything you need is integrated into one smooth and efficient interface. Key Advantages All-in-One System Combines trend, volatility, sup
FREE
PZ Support Resistance
PZ TRADING SLU
3.33 (3)
Unlock key market insights with automated support and resistance lines Tired of plotting support and resistance lines? This is a multi-timeframe indicator that detects and plots supports and resistance lines in the chart with the same precision as a human eye would. As price levels are tested over time and its importance increases, the lines become thicker and darker, making price leves easy to glance and evaluate. [ Installation Guide | Update Guide | Troubleshooting | FAQ | All Products ] Boos
VR Cub
Vladimir Pastushak
VR Cub is an indicator for getting high-quality entry points. The indicator was developed to facilitate mathematical calculations and simplify the search for entry points into a position. The trading strategy for which the indicator was written has been proving its effectiveness for many years. The simplicity of the trading strategy is its great advantage, which allows even novice traders to successfully trade with it. VR Cub calculates position opening points and Take Profit and Stop Loss targe
The SMC Venom Model BPR indicator is a professional tool for traders working within the Smart Money (SMC) concept. It automatically identifies two key patterns on the price chart: FVG (Fair Value Gap) is a combination of three candles, in which there is a gap between the first and third candles. It forms a zone between levels where there is no volume support, which often leads to a price correction. BPR (Balanced Price Range) is a combination of two FVG patterns that form a “bridge” - a zone of
The Morning Star PRT indicator uses the morning flat breakout principle. The indicator displays morning flat levels and shows possible targets. An additional Fibonacci level has been added to the indicator, as well as sound alerts about the intersection of both target levels specified in the settings and the night flat level. The Morning Star PRT indicator builds a night flat channel at the end of the night, as well as two Fibonacci price levels up and down. These levels can be considered both
In the stock market technical analysis, support and resistance is a concept that the movement of the price of a security will tend to stop and reverse at certain predetermined price levels. Support and resistance levels can be identified on any timeframe. However, the most significant ones are found on the higher time frames, such as daily, weekly, and monthly. This indicator using the weekly OHLC data to identify the relevant levels. This is a support and resistance indicator and providing majo
Super Reversal Pattern
Parfait Mujinga Ndalika
Super Reversal Pattern Indicator Unlock the power of advanced pattern recognition with our Super Reversal Pattern Indicator. Designed for traders seeking precision and reliability, this indicator identifies one of the most effective reversal patterns in technical analysis, offering a significant edge in your trading strategy. Key Features: Non-Repainting Accuracy: Enjoy the confidence of non-repainting technology. Once a Super Reversal Pattern is detected, it remains static, providing consiste
The Th3Eng PipFinite indicator is based on a very excellent analysis of the right trend direction with perfect custom algorithms. It show the true direction and the best point to start trading. With StopLoss point and Three Take Profit points. Also it show the right pivot of the price and small points to order to replace the dynamic support and resistance channel, Which surrounds the price. And Finally it draws a very helpful Box on the left side on the chart includes (take profits and Stop loss
Awesome Oscillator by Bill Williams with the ability to fine-tune and replace the averaging algorithms of the indicator, which significantly expands the possibilities of using this oscillator in algorithmic trading and brings it closer in its properties to such an indicator as the MACD. To reduce price noise, the final indicator is processed with an additional Smooth averaging. The indicator has the ability to give alerts, send mail messages and push signals when the direction of movement of th
RSI Speed mp
DMITRII GRIDASOV
Crypto_Forex   Indicator "RSI SPEED" for MT4 - great predictive tool , No Repaint. The calculation of this indicator is  based on equations from physics . RSI SPEED is the  1st derivative of RSI  itself. RSI SPEED is   good for scalping entries   into the direction of main trend. Use it   in combination   with suitable   trend indicator , for example HTF MA (as on pictures). RSI SPEED indicator shows how fast RSI itself changes its direction   - it is very sensitive . It is recommended to use RS
This is an MTF indicator of support and resistance levels based on Advanced ZigZag Dynamic and/or Extended Fractals indicator extremums with price labels (can be disabled). More higher TFs can be selected for MTF mode. By default, the levels are generated based on ZigZag indicator dots. Fractals indicator dots can also be used together with ZigZag or instead of it. In order to simplify the use and save CPU time, calculation is performed once per each bar at its opening. Parameters: ForcedTF - ch
Daily Pivots Multi Indicator Daily Pivots Multi is an exclusive indicator to draw your pivots levels and much more. Most indicators draw daily pivots for the day. Daily Pivots Multi is able to draw levels for different days. The indicator can do the calculation for unlimited number of days backward. It means that you can draw the levels for today but also for the past days. This is very useful if you want to study a strategy with Pivots levels over a period of time. Another problem is that e
Trend Ray
Andriy Sydoruk
The indicator shows the potential trend direction by cyclical-wave dependence. Thus, all the rays of the intersection will be optimal rays, in the direction of which the price is expected to move, taking into account the indicator period. Rays can be used as a direction for potential market movement. But we must not forget that the approach must be comprehensive, the indicator signals require additional information to enter the market.
Crypto_Forex Indicator  " Morning  Star  pattern" for MT4. Indicator "Morning Star pattern" is a very powerful indicator for Price Action trading:   No repaint, No delay. Indicator   detects bullish Morning Star patterns on chart:  Blue arrow signal on chart (see pictures). With P C, Mobile & Email alerts. Also its brother - bearish  " Evening Star pattern" indicator is available (follow the link below). Indicator  " Morning Star pattern" is excellent to   combine with Support/Resistance Levels
Noize Absorption Index MT4
Ekaterina Saltykova
5 (1)
Noize Absorption Index - is the manual trading system that measures the difference of pressure between bears forces and bulls forces. Green line - is a noize free index that showing curent situation. Zero value of index shows totally choppy/flat market.Values above zero level shows how powerfull bullish wave is and values below zero measures bearish forces.Up arrow appears on bearish market when it's ready to reverse, dn arrow appears on weak bullish market, as a result of reverse expectation. S
CityScape summarizes prices into an easy to read pattern that oscillates between 0 and 1. Repetition of CityScape pattern may indicate that the price pattern will also be repeated. CityScape pattern can be used as a quick reference to predict what the price may do by looking for a similar CityScape Pattern in the recent past. Cross currency pairs and cross timescale pattern comparisons may also provide insight into what the price will do. Inputs Local Max period: Controls the width of the CityS
TWO PAIRS SQUARE HEDGE METER INDICATOR Try this brilliant 2 pairs square indicator It draws a square wave of the relation between your two inputs symbols when square wave indicates -1 then it is very great opportunity to SELL pair1 and BUY Pair2 when square wave indicates +1 then it is very great opportunity to BUY pair1 and SELL Pair2 the inputs are : 2 pairs of symbols         then index value : i use 20 for M30 charts ( you can try other values : 40/50 for M15 , : 30 for M30 , : 10 for H1 ,
Trendiness Index
Libertas LLC
5 (3)
"The trend is your friend" is one of the best known sayings in investing, because capturing large trendy price movements can be extremely profitable. However, trading with the trend is often easier said than done, because many indicators are based on price reversals not trends. These aren't very effective at identifying trendy periods, or predicting whether trends will continue. We developed the Trendiness Index to help address this problem by indicating the strength and direction of price trend
The indicator displays the data of the Stochastic oscillator from a higher timeframe on the chart. The main and signal lines are displayed in a separate window. The stepped response is not smoothed. The indicator is useful for practicing "manual" forex trading strategies, which use the data from several screens with different timeframes of a single symbol. The indicator uses the settings that are identical to the standard ones, and a drop-down list for selecting the timeframe. Indicator Paramet
Gold Bricks FX USES THE TREND WAVE INDICATOR AND IT CAN IDENTIFY THE BEGINNING AND THE END OF A NEW WAVE TREND MOVEMENT. AS AN OSCILLATOR, THE INDICATOR IDENTIFIES THE OVERBOUGHT AND OVERSOLD ZONES. IT WORKS GREAT TO CATCH THE SHORT TERM PRICE REVERSALS AND USES A MARTINGALE STRATEGY TO CLOSE ALL TRADES IN PROFIT. USE DEFAULT SETTINGS ON H1 OR HIGHER TIME FRAME ON ANY PAIR FOR MORE ACCURATE TRADES WHY THIS EA : Smart entries calculated by 4 great strategies The EA can be run on even a $300
FreqoMaster
Stanislav Korotky
The main idea of this indicator is rates analysis and prediction by Fourier transform. The indicator decomposes exchange rates into main harmonics and calculates their product in future. The indicator shows 2 price marks in history, depicting price range in the past, and 2 price marks in future with price movement forecast. Buy or sell decision and take profit size are displayed in a text label in the indicator window. The indicator uses another indicator as an engine for calculations - FreqoMet
Trade with Gann on your side!! MASTER CIRCLE 360 CIRCLE CHART, originally created by Gann admitted that this is “The Mother of all charts”. It is one of the last studies that this great trader left for us. The numeric tab le is apparently quite simple like all the tables and is based on square numbers, the SQUARE OF 12 and is by evolution, one of the most important square numbers. Here we can find CYCLE, PRICE AND TIME thanks to angles and grades, to show past and future support and resistance.
For sure, this indicator has become very popular amongst traders. Through coding this indicator will give you the most accurate levels possible for your trading analysis. We have also added in the ability for you to receive alerts when the price breaks above or below a Support or Resistance lines! HOW TO USE The red rectangles represent your resistance/supply zone. The green rectangles represent your support/demand zone.  BONUS FEATURES We coded this indicator with the ability to switch between
PZ Harmonacci Patterns
PZ TRADING SLU
3.17 (6)
Trade smarter, not harder: Empower your trading with Harmonacci Patterns This is arguably the most complete harmonic price formation auto-recognition indicator you can find for the MetaTrader Platform. It detects 19 different patterns, takes fibonacci projections as seriously as you do, displays the Potential Reversal Zone (PRZ) and finds suitable stop-loss and take-profit levels. [ Installation Guide | Update Guide | Troubleshooting | FAQ | All Products  ] It detects 19 different harmonic pric
Intraday Levels shows intraday levels grid for intraday trading Shows a grid for the day levels, gives you a guide to know the trend and to measure intraday trades (stop-loss and take-profit). Parameters are: Levels Mode: Basic mode: Shows highest, lowest and middle levels. Advanced mode: Shows highest, lowest, middle and intermediate levels. Fibonacci mode: Shows session Fibonacci retracements levels. Momentum mode: Shows delayed Advanced levels to identify momentum. Smooth Period (Momentum m
Phase Analytics Pro: Advanced Cyclic Market Analyzer Phase Analytics Pro is a sophisticated technical tool designed for traders who prioritize mathematical precision over lag-heavy traditional indicators. Based on the principles of digital signal processing, this indicator decomposes price action into phase and quadrature components to identify the dominant market cycle. How it works: The algorithm calculates the instantaneous phase of the market, allowing it to distinguish between trending and
Buyers of this product also purchase
Neuro Poseidon MT4
Daria Rezueva
4.94 (32)
Neuro Poseidon is a new indicator by Daria Rezueva. It combines precise trading signals with adaptive TP/SL levels - creating best possible trades as a result! Message me and get  Neuro Poseidon Assistant  as a gift to automize your trading process! What makes it stand out? 1. Proven profitability on all assets and timeframes 2. Only confirmed BUY and SELL signals present on the chart 3. Adaptive TP & SL levels generated by the software for each trade 4. Easy to understand - suitable for all
Gann Made Easy
Oleg Rodin
4.84 (165)
Gann Made Easy is a professional and easy to use Forex trading system which is based on the best principles of trading using the theory of W.D. Gann. The indicator provides accurate BUY and SELL signals including Stop Loss and Take Profit levels. You can trade even on the go using PUSH notifications. PLEASE CONTACT ME AFTER PURCHASE TO GET TRADING  INSTRUCTIONS AND GREAT EXTRA INDICATORS   FOR FREE! Probably you already heard about the Gann trading methods before. Usually the Gann theory is a ve
M1 Sniper
Oleg Rodin
5 (24)
M1 SNIPER is an easy to use trading indicator system. It is an arrow indicator which is designed for M1 time frame. The indicator can be used as a standalone system for scalping on M1 time frame and it can be used as a part of your existing trading system. Though this trading system was designed specifically for trading on M1, it still can be used with other time frames too. Originally I designed this method for trading XAUUSD and BTCUSD. But I find this method helpful in trading other markets a
Dynamic Forex28 Navigator
Bernhard Schweigert
4.43 (7)
Specials Discount now. The Next Generation Forex Trading Tool. Dynamic Forex28 Navigator is the evolution of our long-time, popular indicators, combining the power of three into one: Advanced Currency Strength28 Indicator (695 reviews) + Advanced Currency IMPULSE with ALERT (520 reviews) + CS28 Combo Signals (recent Bonus) Details about the indicator  https://www.mql5.com/en/blogs/post/758844 What Does The Next-Generation Strength Indicator Offer? Everything you loved about the originals, now
Enigmera
Ivan Stefanov
5 (8)
ENIGMERA: The core of the market (This is a manual indicator and contains features that may not supported by the MetaTrader current testing environment) Introduction This indicator and trading system is a remarkable approach to the financial markets . ENIGMERA uses the fractal cycles to accurately calculate support and resistance levels. It shows the authentic accumulation phase and gives direction and targets.  A system that works whether we are in a trend or a correction.   How It Works Most
Trend Catcher ind
Ramil Minniakhmetov
5 (2)
TREND CATCHER INDICATOR Trend Catcher Indicator analyzes market price movements, using a combination of the author’s proprietary and customized adaptive trend-analysis indicators.  It identifies the true market direction by filtering out short-term noise and focusing on underlying momentum strength, volatility expansion, and price structure behavior.  It also uses a combination of smoothing and trend-filtering customized indicators such as moving averages, RSI, and volatility filters.   Real ope
This indicator is an indicator for automatic wave analysis that is perfect for practical trading! Case... Note:   I am not used to the Western name for wave classification. Influenced by the naming habit of Chaos Theory (Chanzhongshuochan), I named the basic wave as   pen   , the secondary wave band as   segment   , and the segment with trend direction   as main trend segment   (this naming method will be used in future notes, let me tell you in advance), but the algorithm is not closely relat
KT Alpha Hunter Arrows MT4
KEENBASE SOFTWARE SOLUTIONS
Most arrow indicators give you a signal and leave you to figure out the rest. KT Alpha Hunter Arrows gives you the full trading plan. Every signal arrow prints with a full plan already drawn: entry line, stop-loss, four take-profit levels, and a live edge verdict telling you whether this symbol and time-frame is worth trading right now. An included Trade Manager EA handles the execution after you enter, so discipline stays intact when the market gets loud. Non-repaint. Closed-bar signals only. B
Scalper Inside PRO
Alexey Minkov
4.74 (68)
Scalper Inside PRO Scalper Inside PRO is an intraday trend and scalping indicator for MetaTrader 4 that uses an exclusive algorithm to quickly detect market direction and key target levels. It automatically calculates entry, exit and multiple profit targets, and shows detailed performance statistics so you can see how different instruments and strategies performed. This helps you choose the most suitable trading instruments for the current market conditions. Additionally, you can easily integrat
Neo Wave PRO
Nikolay Raykov
5 (1)
Price & Time Market Structure Indicator A professional market structure tool that analyzes waves through both price and time — not price alone. Main Description NeoWave PRO is a professional market structure indicator for MetaTrader 4 designed for traders who want to move beyond traditional one-dimensional wave tools such as ZigZag, swing indicators, and basic high/low systems. Most wave indicators analyze only one thing: Price. But a real market wave is not only a price movement. A true wave de
PRO Renko System
Oleg Rodin
5 (30)
PRO Renko System is a highly accurate trading system specially designed for trading RENKO charts. The ARROWS and Trend Indicators DO NOT REPAINT! The system effectively neutralizes so called market noise giving you access to accurate reversal signals. The indicator is very easy to use and has only one parameter responsible for signal generation. You can easily adapt the tool to any trading instrument of your choice and the size of the renko bar. I am always ready to provide extra support to help
Genesis Matrix Pro is a professional multi-timeframe trend detection indicator designed to help traders identify high-quality market alignment with clarity and structure. It combines 12 different technical indicators into one visual alignment matrix, allowing traders to quickly see when market conditions are bullish, bearish, or neutral. A signal is generated only when the selected strategies are aligned, helping reduce noise and improve decision-making. PLEASE CONTACT ME AFTER PURCHASE TO GET
Current event:  https://c.mql5.com/1/326/A2SR2025_NoMusic.gif A. What is A2SR ?   * It's a leading technical indicator (no repaint, no lagging). -- Guidance : -- at   https://www.mql5.com/en/blogs/post/734748/page4#comment_16532516 -- and  https://www.mql5.com/en/users/yohana/blog A2SR has a special technique in determining the levels of Support ( demand ) and Resistance ( supply ) . Unlike the ordinary way that we seen on the net, A2SR has a original concept in determining actual SR levels.
PZ Trend Trading
PZ TRADING SLU
4.8 (5)
Capture every opportunity: your go-to indicator for profitable trend trading Trend Trading is an indicator designed to profit as much as possible from trends taking place in the market, by timing pullbacks and breakouts. It finds trading opportunities by analyzing what the price is doing during established trends. [ Installation Guide | Update Guide | Troubleshooting | FAQ | All Products ] Trade financial markets with confidence and efficiency Profit from established trends without getting whips
Advanced Supply Demand
Bernhard Schweigert
4.91 (300)
Trading Special – 40% OFF Best Solution for any Newbie or Expert Trader! This indicator is a unique, high quality and affordable trading tool because we have incorporated a number of proprietary features and a new formula. With this update, you will be able to show double timeframe zones. You will not only be able to show a higher TF but to show both, the chart TF, PLUS the higher TF: SHOWING NESTED ZONES. All Supply Demand traders will love it. :) Important Information Revealed Maximize the pot
IQ FX Gann Levels a precision trading indicator based on W.D. Gann’s square root methods . It plots real-time, non-repainting support and resistance levels to help traders confidently spot intraday and scalping opportunities with high accuracy. William Delbert Gann (W.D. Gann) was an exceptional market analyst, whose trading technique was based on a complex blend of mathematics, geometry, astrology, and ancient mathematics which proved to be extremely accurate. Setup & Guide:  Download  MT5 Ver
Scalper Vault
Oleg Rodin
5 (37)
Scalper Vault is a professional scalping system which provides you with everything you need for successful scalping. This indicator is a complete trading system which can be used by forex and binary options traders. The recommended time frame is M5. The system provides you with accurate arrow signals in the direction of the trend. It also provides you with top and bottom signals and Gann market levels. The indicator provides all types of alerts including PUSH notifications. PLEASE CONTACT ME AFT
PZ Swing Trading
PZ TRADING SLU
5 (3)
Protect against whipsaws: revolutionize your swing trading approach Swing Trading is the first indicator designed to detect swings in the direction of the trend and possible reversal swings. It uses the baseline swing trading approach, widely described in trading literature. The indicator studies several price and time vectors to track the aggregate trend direction and detects situations in which the market is oversold or overbought and ready to correct. [ Installation Guide | Update Guide | Tro
The " Dynamic Scalper System " indicator is designed for the scalping method of trading within trend waves. Tested on major currency pairs and gold, compatibility with other trading instruments is possible. Provides signals for short-term opening of positions along the trend with additional price movement support. The principle of the indicator. Large arrows determine the trend direction. An algorithm for generating signals for scalping in the form of small arrows operates within trend waves.
M30/H1/H4 Swing Version Available Want to catch the big moves that M5/M15 can't reach? Gold Signal Swing Pro (M30/H1/H4) is now available. Target $20-$80+ per trade. https://www.mql5.com/en/market/product/177643 KURAMA GOLD SIGNAL PRO (MT4) — Complete XAUUSD Trading System with 7-Layer Filter, Auto TP/SL, and Quality Scoring NON-REPAINTING. NON-REDRAWING. NON-LAGGING. Every signal is permanent. What you see is what you get. BONUS: Buy the lifetime li
PZ 123 Pattern
PZ TRADING SLU
1 (1)
Unlock powerful breakout opportunities The 123 Pattern is one of the most popular, powerful and flexible chart patterns. The pattern is made up of three price points: a bottom, a peak or valley, and a Fibonacci retracement between 38.2% and 71.8%. A pattern is considered valid when the price breaks beyond the last peak or valley, moment at which the indicator plots an arrow, rises an alert, and the trade can be placed. [ Installation Guide | Update Guide | Troubleshooting | FAQ | All Products  ]
MonsterDash Harmonic Indicator is a harmonic pattern dashboard. It recognizes all major patterns. MonsterDash is a dashboard that displays all detected patterns for all symbols and (almost) all timeframes in sortable and scrollable format. Users can add their own user defined patterns . MonsterDash can open and update charts with the pattern found. Settings MonsterDash's default settings are good enough most of the time. Feel free to fine tune them to your needs. The color settings are for thos
Apollo SR Master is a Support/Resistance indicator with special features which make trading with Support/Resistance zones easier and more reliable. The indicator calculates Support/Resistance zones in real-time without any time lag by detecting local price tops and bottoms. Then to confirm the newly formed SR area, the indicator shows special signal which signalizes that the SR zone can be taken into consideration and used as an actual SELL or BUY signal. In this case the strength of the SR zone
The Seismograph Marketquake Detector . No matter way you trade, you definitely want to avoid entry in the low liquidity market. - The seismograph will help you the right time to enter the market before market rally. However, even though you have made sure to entry at market times that should be busy, the fact is that many people are often trapped in markets with low liquidity. After several hours of waiting, the market suddenly became busy, but... it turned out that many people were now in the
Trading Special –40% OFF Best Solution for any Newbie or Expert Trader! This Indicator is a unique, high quality and affordable trading tool because we have incorporated a number of proprietary features and a new formula. With only ONE chart you can read Currency Strength for 28 Forex pairs! Imagine how your trading will improve because you are able to pinpoint the exact trigger point of a new trend or scalping opportunity? User manual: click here That's the first one, the original! Don't buy a
Introduction to Fractal Pattern Scanner Fractal Indicator refers to the technical indicator that makes use of the fractal geometry found in the financial market. Fractal Pattern Scanner is the advanced Fractal Indicator that brings the latest trading technology after the extensive research and development work in the fractal geometry in the financial market. The most important feature in Fractal Pattern Scanner is the ability to measure the turning point probability as well as the trend probabi
Auto Optimized Parabolic RSI: Advanced 3D Momentum Engine Most retail indicators fail because they rely on static inputs that break the moment market volatility shifts. Auto Optimized Parabolic RSI solves the problem of "indicator decay" by continuously recalculating its own mathematical edge, bringing institutional-grade quantitative adaptation directly to your MT5 terminal. The Core Advantage: Custom In-Memory 3D Optimization   Standard auto-optimizers often freeze the MT5 platform because the
Trend Lines PRO
Roman Podpora
5 (1)
TREND LINES PRO    helps understand where the market is truly changing direction. The indicator shows real trend reversals and points where major players re-enter. You see   BOS lines   Trend changes and key levels on higher timeframes — without complex settings or unnecessary noise. Signals don't repaint and remain on the chart after the bar closes. VERSION MT 5     -     Reveals its maximum potential when paired with the   RFI LEVELS PRO  indicator What the indicator shows: Real shifts   tren
The Propfolio Master Suite is the ultimate all-in-one analytical workstation for professional traders. Combining the power of the Beat The Market Maker (BTMM) methodology, Smart Money Concepts (SND/Liquidity), and Advanced Volume Profile, this suite replaces multiple different indicators with one optimized engine. Monitor up to 14 pairs simultaneously from a single chart, instantly identify market cycles, and seamlessly map institutional footprints with the click of a button. The Command Center
RFI levels PRO
Roman Podpora
5 (1)
The indicator accurately shows the reversal points and price return zones where the   Major players . You see where new trends are forming and make decisions with maximum precision, maintaining control over every trade. VERSION MT5     -     Reveals its maximum potential when combined with the   TREND LINES PRO   indicator What the indicator shows: Reversal structures and reversal levels with activation at the beginning of a new trend. Display of   TAKE PROFIT   and   STOP LOSS   levels with mi
More from author
Candle Power Pro
Thushara Dissanayake
4.5 (8)
The   Candle Power Pro   is a sophisticated trading tool designed to decode   real volume pressure, tick data imbalances, and institutional order flow dynamics   by measuring the   battle between bull ticks and bear ticks   in real time. This indicator transforms raw   volume data into actionable insights , helping traders identify   Smart Money movements, liquidity hunts, and hidden market psychology   behind each price candle. By analyzing   buyer/seller volume percentages, divergence pattern
The Donchian Time Sync Analyzer brings powerful multi-timeframe dimension to classic Donchian channel analysis, allowing traders to simultaneously monitor trend strength and potential reversal signals across five different chart periods. This advanced indicator calculates the highest highs and lowest lows across your selected timeframes, generating clear visual signals that help identify convergence of trend direction across multiple time horizons. By providing coordinated analysis from minute t
SMC Sessions MT5
Thushara Dissanayake
5 (2)
The SMC Sessions Indicator is a precision tool crafted for Smart Money traders who rely on ICT concepts, liquidity hunts, and session based strategies . It seamlessly maps out critical session based trading zones using the most proven and popular concepts used by institutional level traders. This all in one session indicator overlays your chart with the most effective and high probability range strategies, including: ICT Asian Range, London Breakout, New York Range, ICT London Open Killzone, ICT
Opening Range Breakouts MT5
Thushara Dissanayake
4.5 (4)
The Opening Range Breakouts Indicator is a session based trading tool designed for traders who follow institutional trading concepts, such as ICT (Inner Circle Trader), Smart Money Concepts (SMC), and volume or order flow based strategies. This indicator plots essential session opening ranges, allowing traders to identify potential liquidity sweeps, breakout zones, fakeouts, and key intraday levels across the major global Forex sessions. This strategy is rooted in the concept of the Opening Rang
Breakout Robot
Thushara Dissanayake
5 (3)
The Breakout Robot EA is a specialized trading tool designed to automate time session-based breakouts . The EA operates by drawing a price range box and high/low lines according to the specified input time parameters. When price breaks above the high or below the low of this defined range, the EA automatically executes trades. The system's core functionality focuses on the EURJPY Breakout between 22:00-02:00 GMT, while its flexible architecture allows adaptation to other time-based strategies li
Candle Volume Strength is an advanced volume analysis indicator that provides insights into the ongoing battle between buyers and sellers. It calculates and visualizes real time volume shifts, helping traders confirm breakouts, trends, retracements, and reversals with greater accuracy. Key Features: Volume Based Confirmation –   The indicator monitors tick volume changes and alerts when market power shifts between buyers and sellers. Trend and Breakout Validation –   By analyzing volume distri
The ICT NewYork Open Killzone Indicator is designed for traders who follow Smart Money Concepts (SMC) , ICT trading models , and liquidity based strategies in the Forex market . This tool marks the New York Open Killzone , spanning 11:00 to 14:00 GMT , a critical time when institutional volume often leads to major moves. The indicator highlights session ranges , market maker ranges , liquidity sweeps , FVG zones (Fair Value Gaps) , and breakout opportunities , providing a complete view of price
The London Session Breakout Strategy Indicator is designed for traders who follow ICT (Inner Circle Trader) and Smart Money Concepts (SMC) , focusing on session based liquidity hunts, killzones, and market maker behavior during the London session. This tool captures the highest and lowest price levels between 00:00 and 07:00 GMT , which is commonly identified as the London Killzone or market maker range . It helps traders identify potential breakout zones where institutional activity and volati
NewYork Range MT5
Thushara Dissanayake
The New York Range Indicator is a session based analysis tool developed for traders applying ICT (Inner Circle Trader) concepts, Smart Money trading, and institutional price action methods . Designed specifically for the New York session, this indicator captures the price range between 12:00 and 14:00 GMT , a critical period that overlaps with the London Close and New York Open . It identifies session highs and lows , detects Fair Value Gaps (FVGs) , and highlights potential liquidity sweep zone
Introducing the Bollinger Band Volume Breakout Detector , a powerful technical indicator designed to enhance the popular Bollinger Band Breakout Strategy . This indicator takes trend following to the next level by incorporating Volume Data, effectively minimizing false signals. By adhering to the principle of "volume confirms price," this tool allows traders to identify price breakouts accompanied by significant increases in volume, ensuring more accurate trading decisions. The indicator's custo
The   FVG Zone Indicator MT5   is a powerful tool designed to identify Fair Value Gaps (FVG) in the market, highlighting price imbalances between fair value and market price. This precise identification of gaps enables traders to spot potential market entry and exit points, significantly enhancing their ability to make informed trading decisions. With its intuitive and user-friendly interface, the FVG Zone Indicator automatically scans charts for Fair Value Gaps, marking these zones on the price
Fibo Scalper Pro
Thushara Dissanayake
2.33 (3)
The Fibo Scalper Pro Expert Advisor is a powerful tool designed to automate popular Fibonacci Trading Strategies . It simplifies the trading process by automatically drawing and adjusting Fibonacci levels on the chart. This feature provides convenience and accuracy for traders who utilize Fibonacci retracements and extensions in their analysis. One of the key features of the Fibo Scalper Pro is its customization facility. It allows professional traders to enable or disable each Fibonacci level
Candle GAP
Thushara Dissanayake
3 (1)
The Candle GAP indicator is an essential tool for traders utilizing Gap Trading Strategies as it automatically identifies candle gaps for each day of the week. A gap refers to a price level difference between the close and open of two consecutive days. This indicator recognizes four types of gap patterns: Common, Breakaway, Continuation, and Exhaustion. By incorporating this indicator into any chart, traders can validate their signals and enhance their trading decisions. One of the key features
FREE
Extract Candle Power
Thushara Dissanayake
5 (3)
Extract Candle Power is a real time volume extractor indicator that provides valuable insights into the behavior of sellers and buyers during each candle. By analyzing the volume data, traders can make more informed decisions about market trends and potential reversals, surpassing the capabilities of traditional Moving Average indicators. This powerful tool allows you to extract and analyze the sellers and buyers volume of the current candle, as well as compare it with the volume of previous can
Three MA Alert
Thushara Dissanayake
The Three MA Alert indicator is an essential tool for traders who rely on the Moving Averages Crossover Strategy . It simplifies your trading life by sending notifications to your mobile device, email, and displaying pop-up alerts with sound whenever there is a crossover of three moving averages. By following this widely used technique, you can ensure that you are always on the right side of the trend and avoid trading against the prevailing market direction. With the Three MA Alert indicator, y
Mr Fibonacci
Thushara Dissanayake
5 (1)
Introducing Mr. Fibonacci , an amazing indicator designed to simplify the process of drawing and adjusting Fibonacci levels on your chart. This indicator offers exceptional customization options for professional traders, allowing them to draw any Fibonacci level with precision. Additionally, it provides mobile notifications, email alerts, and pop-up alerts when price enters Fibonacci levels, ensuring you never miss potential trading opportunities. Using this indicator, you no longer have to cons
Two MA Crossover
Thushara Dissanayake
5 (3)
The Two MA Crossover is a powerful notification system designed specifically for traders who rely on the Moving Average Crossover Strategy . This fully automated indicator serves as a comprehensive alert system, ensuring that you never miss a crucial trading event. It sends notifications to your mobile device, email, and displays pop-up alerts with sound on your computer, all when it detects a moving average crossover based on your preferred parameters. One of its notable features is its compati
Pivot Bro
Thushara Dissanayake
5 (1)
The Pivot Bro technical indicator is a powerful tool designed to identify retracement areas using Pivot, Fibonacci, ATR, and ADR levels. It goes beyond that by also recognizing price action based reversal candlestick patterns . Additionally, the Currency Meter is a valuable companion for assessing the true strength of major currencies. By analyzing 28 currency pairs and displaying their strength on the chart with color changes, it enables traders to make informed decisions on entry and exit poin
ReversalPatterns
Thushara Dissanayake
This technical indicator automatically identifies and analyzes price action using a variety of Reversal Candlestick Patterns on the chart. It conveniently draws arrow signs along with the corresponding pattern names, making it easy to spot the latest reversal candlestick patterns. With this indicator, you can quickly identify and compare chart analysis with previously identified candle patterns. The indicator includes a range of implemented candlestick patterns, both simple and complex, such as
Reversal Alert Pro
Thushara Dissanayake
2.5 (2)
The Reversal Alert Pro indicator is a powerful tool designed to automatically detect reversal areas in the market. It offers convenient notifications sent directly to your mobile device and displays pop-up alerts with sound. By incorporating this indicator into your trading strategy, you can effectively filter trade positions. Furthermore, the indicator provides the option to utilize CCI, RSI, and Stochastic indicators to further refine the generated signals, enhancing its versatility and applic
Currency Strength 7
Thushara Dissanayake
The Currency Strength 7 technical indicator is a powerful tool designed to help traders gauge the strength of the seven most popular currencies. By analyzing the strength of AUD, USD, EUR, GBP, JPY, CHF, and CAD, this indicator provides valuable insights into currency dynamics. It represents currency strength on the chart using lines, allowing traders to quickly assess the relative strength of different currencies. One of the standout features of this indicator is its ability to draw an extended
BullsBears Action
Thushara Dissanayake
The BullsBears Action Expert Advisor is an advanced trading solution designed for traders who rely on volume based market analysis. Utilizing Bulls and Bears volume data, this EA automatically identifies potential trade opportunities based on market strength and executes Buy or Sell orders according to user defined parameters. It is fully customizable, allowing traders to fine tune their strategies with multiple filters, risk management options, and trade execution controls. This EA includes an
Crossover Action
Thushara Dissanayake
The Crossover Action Expert Advisor is an advanced tool designed to automate one of the most popular trading strategies, the M oving Average Crossover Strategy . With its intuitive interface and powerful features, this expert advisor takes the complexity out of manual trading and executes trades automatically based on moving average crossovers. One of the key features of this expert advisor is its proper risk management system, ensuring that trades are executed with appropriate lot sizes and max
CCI Action
Thushara Dissanayake
The CCI Action Expert Advisor is a powerful tool designed to automate the CCI (Commodity Channel Index) Strategy , allowing traders to capitalize on CCI level touches. With its user friendly settings and robust risk management system, this EA provides a reliable and efficient solution for traders looking to incorporate the CCI indicator into their trading approach. One of the key features of this Expert Advisor is its proper risk management system, which helps traders maintain control over their
News Robo
Thushara Dissanayake
2 (1)
The News Robo Expert Advisor is a powerful tool designed to assist news traders in opening pending orders with hidden stop loss during news releases. It offers several features that enhance your trading experience and protect your trades. One of the key features of News Robo is the hidden stop loss, which is ideal for news traders who prefer to conceal their stop loss from market maker brokers. The stop loss is automatically revealed once a profitable position is achieved, allowing you to secure
RSI Action
Thushara Dissanayake
3.67 (3)
The RSI Action Expert Advisor is a powerful tool that automates popular RSI (Relative Strength Index) strategies, allowing for efficient and accurate trading. By utilizing overbought and oversold levels, this EA identifies optimal entry points for buy and sell orders. It also offers various signal filtering options to enhance trading precision, including RSI reversal points, pending orders, major trend identification, and Moving Average Crossover signals. Additionally, it incorporates a modern
TPSL Driver
Thushara Dissanayake
Introducing the TPSL Driver Utility , a powerful tool designed to enhance your trading experience by automating Stop Loss and Take Profit management. This utility caters to every trader who desires seamless order management and advanced profit protection techniques. With the TPSL Driver Utility, you have the flexibility to choose between two modes of order management: Hidden and Visual. The Hidden mode allows you to hide the Take Profit and Stop Loss levels, providing a discreet approach to mana
Entry Point
Thushara Dissanayake
The   Entry Point   indicator is a   professional signal dashboard   that combines multiple technical indicators across up to three timeframes to produce a single   consolidated entry signal . Rather than juggling separate windows for Moving Averages, CCI, RSI, Stochastic, Bill Williams Accelerator, and volume analysis, traders can view all these readings in one   intuitive visual panel . The system analyzes each timeframe independently, then applies   weighted voting   based on your chosen prio
Entry Point Dashboard Ultimate
Thushara Dissanayake
4 (5)
Introducing the Entry Point Dashboard Ultimate , a powerful technical indicator designed to provide Buy/Sell notifications for 6 currency pairs. This indicator analyzes 5 moving averages, CCI, RSI, Stochastic, Bill Williams, and volume indicators across 3 different time frames to generate accurate signals. It offers unlimited customization options for professional traders, allowing them to tailor the indicator based on their experience and strategies. The Entry Point Dashboard Ultimate sends sig
Introducing the Fibo Channels Ultimate technical indicator, a powerful tool designed to revolutionize your Fibonacci trading strategy. With its advanced functionality, this indicator automatically draws all past Fibonacci channels on your chart, saving you time and effort. What sets the Fibo Channels Ultimate apart is its exceptional customization capabilities, allowing professional traders to draw any Fibonacci level they desire. This level of flexibility ensures that you can tailor the indicat
Filter:
No reviews
Reply to review