Candle Power Pro
- Indicators
-
Thushara Dissanayake
 I’ve always loved exploring new trading strategies, testing them with indicators, and automating them with expert advisors (EAs). Welcome to my world of Forex Trading Robots, Indicators, and Trading Tools, all specially built for the MetaTrader platform.
 - Version: 2.0
- Updated: 1 July 2026
- Activations: 5
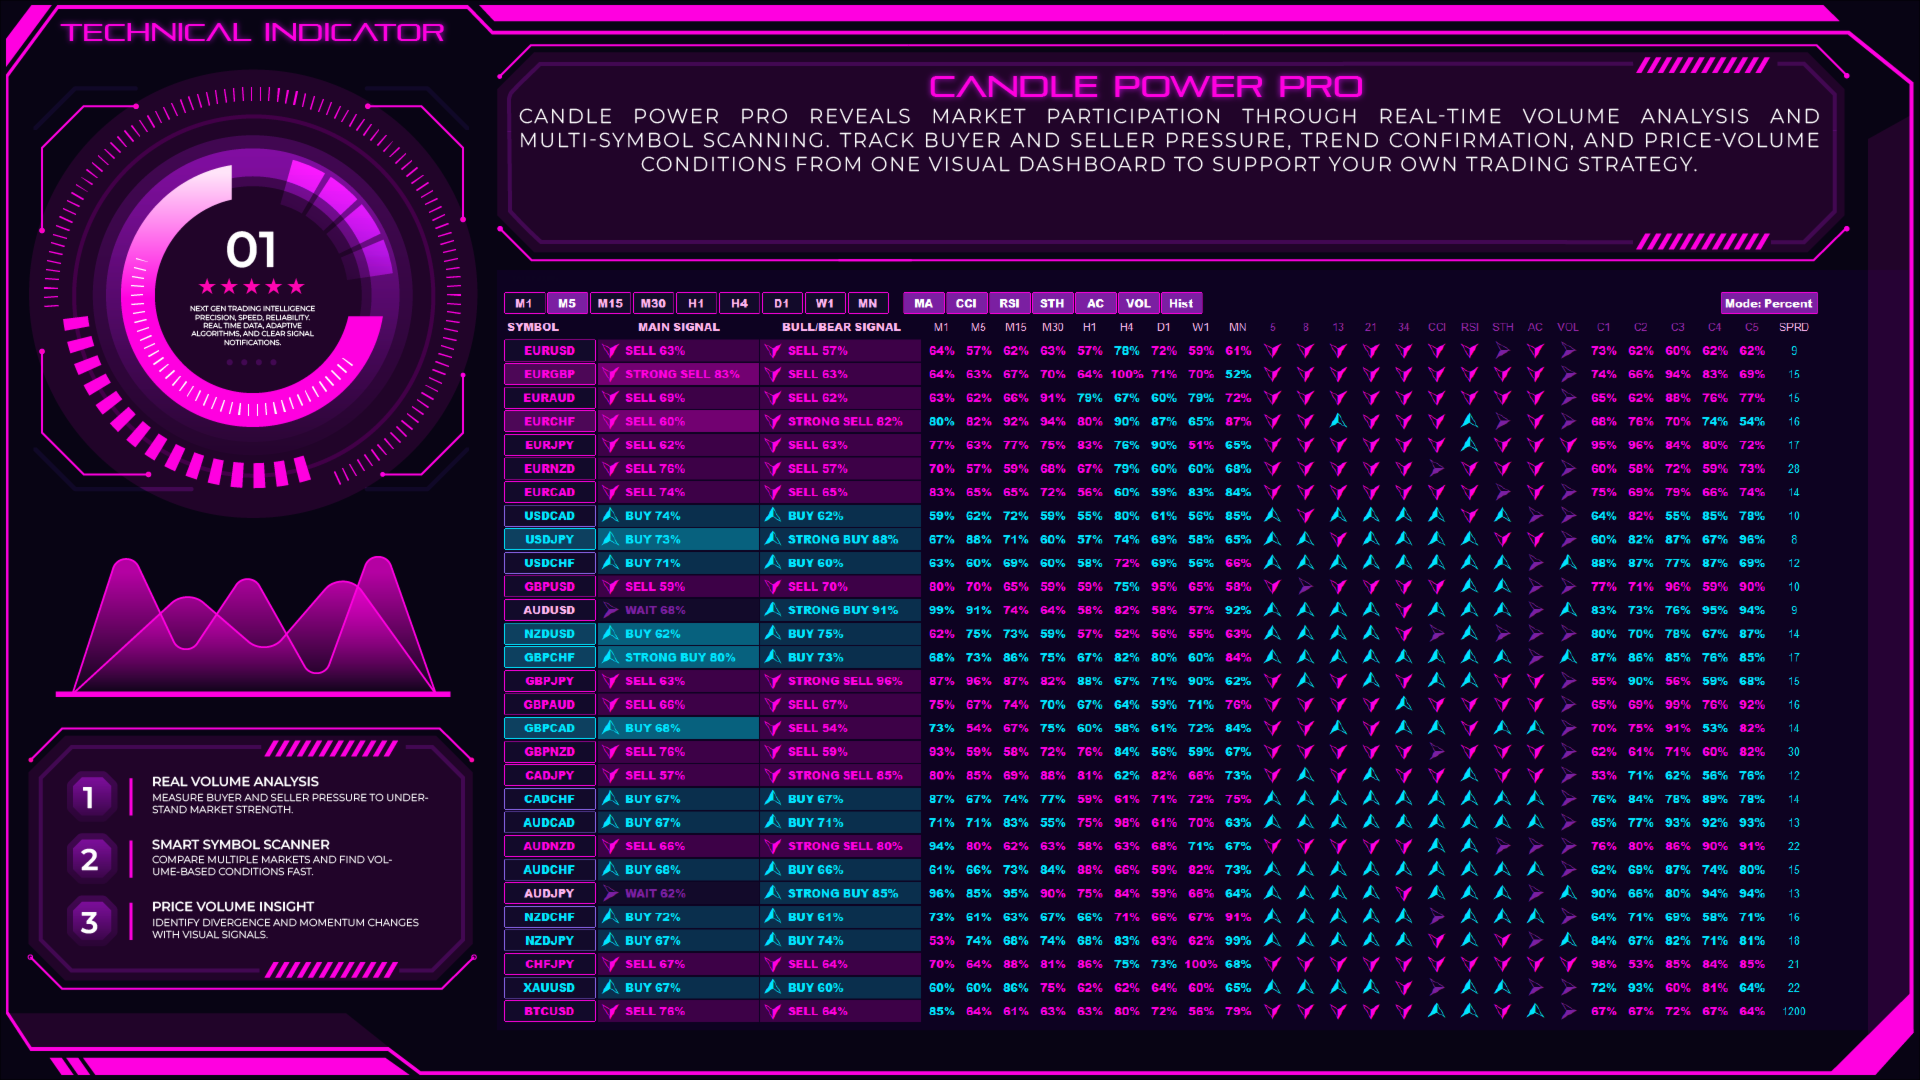
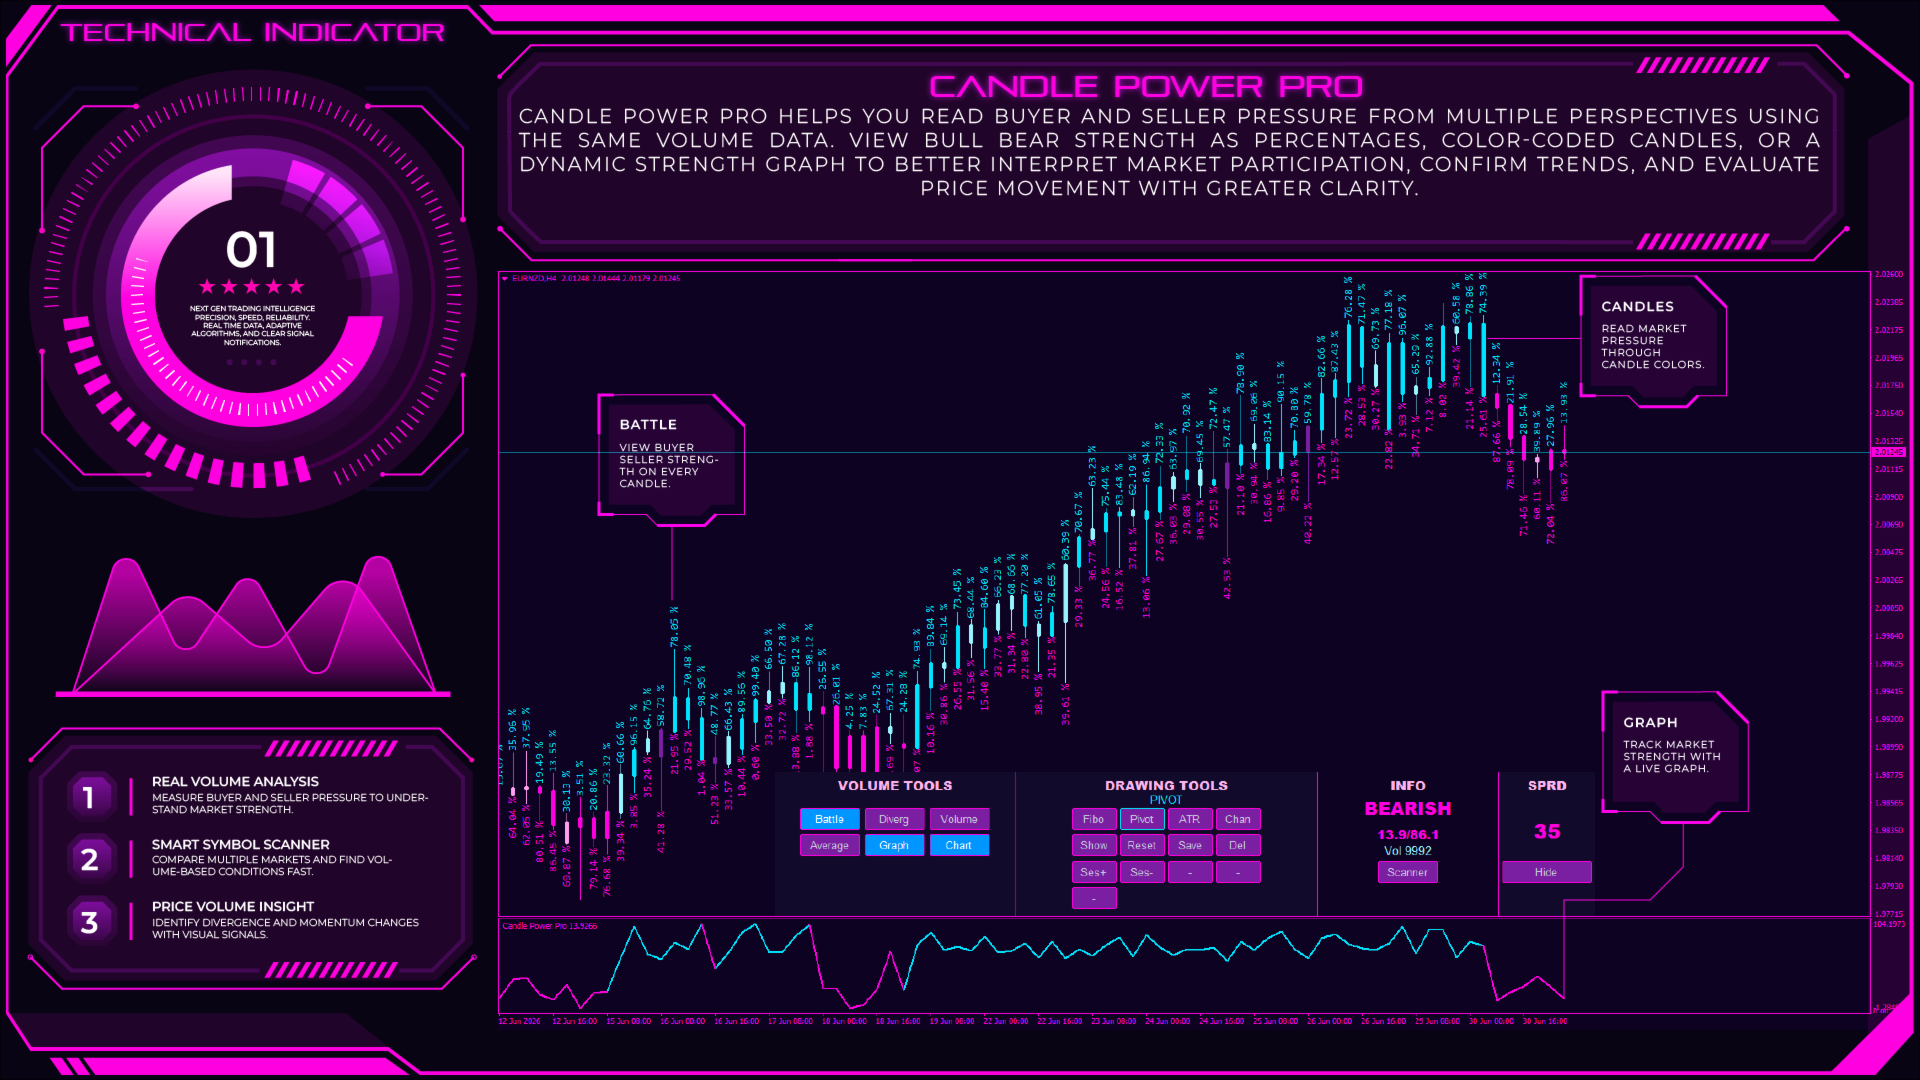
Candle Power Pro is a Volume Analysis Indicator designed to analyze real tick volume, bull/bear pressure, buyer and seller imbalances, and price-volume relationships directly from the chart. The indicator transforms candle volume activity into a visual market analysis system by displaying bull and bear volume percentages, volume dominance, divergence conditions, and trend confirmation signals. Designed for Forex traders, Gold traders, Index traders, Cryptocurrency traders, scalpers, day traders, swing traders, and traders following price action, SMC, and volume-based approaches, Candle Power Pro provides a complete workflow for studying market strength and participant activity. With a built-in Multi-Symbol Scanner, Single-Symbol Dashboard, multiple technical analysis tools, and customizable alerts, traders can monitor volume conditions, market momentum, and potential price movement areas from one interface.
Core Functionality
Candle Power Pro analyzes real-time tick volume data and evaluates the relationship between price movement and volume activity. Instead of looking only at candle direction, the indicator studies whether buying or selling pressure supports the current candle movement.
The indicator calculates the percentage balance between bullish and bearish tick activity and displays the result through a visual dashboard and chart-based tools.
The main analysis includes:
Buyer/Seller Imbalance Analysis
The indicator highlights situations where candle direction and volume pressure do not match.
Examples:
- Strong bullish tick activity during bearish candles
- Strong bearish tick activity during bullish candles
These conditions can help traders observe possible volume absorption, market pressure changes, or areas requiring additional analysis.
Volume-Price Divergence Analysis
Candle Power Pro compares price movement with volume behavior to highlight possible divergence conditions.
Examples:
- Price making new highs while bullish volume strength decreases
- Price making new lows while bearish volume pressure weakens
This helps traders analyze potential momentum exhaustion and changing market conditions.
Trend Confirmation
When price direction and volume pressure align, the indicator provides additional confirmation information for trend analysis.
Traders can compare:
- Price direction
- Bull/bear volume ratio
- Trend strength
- Technical indicator conditions
to build a broader market view.
Dashboard System
Candle Power Pro includes two operating modes:
Multi-Symbol Scanner Mode
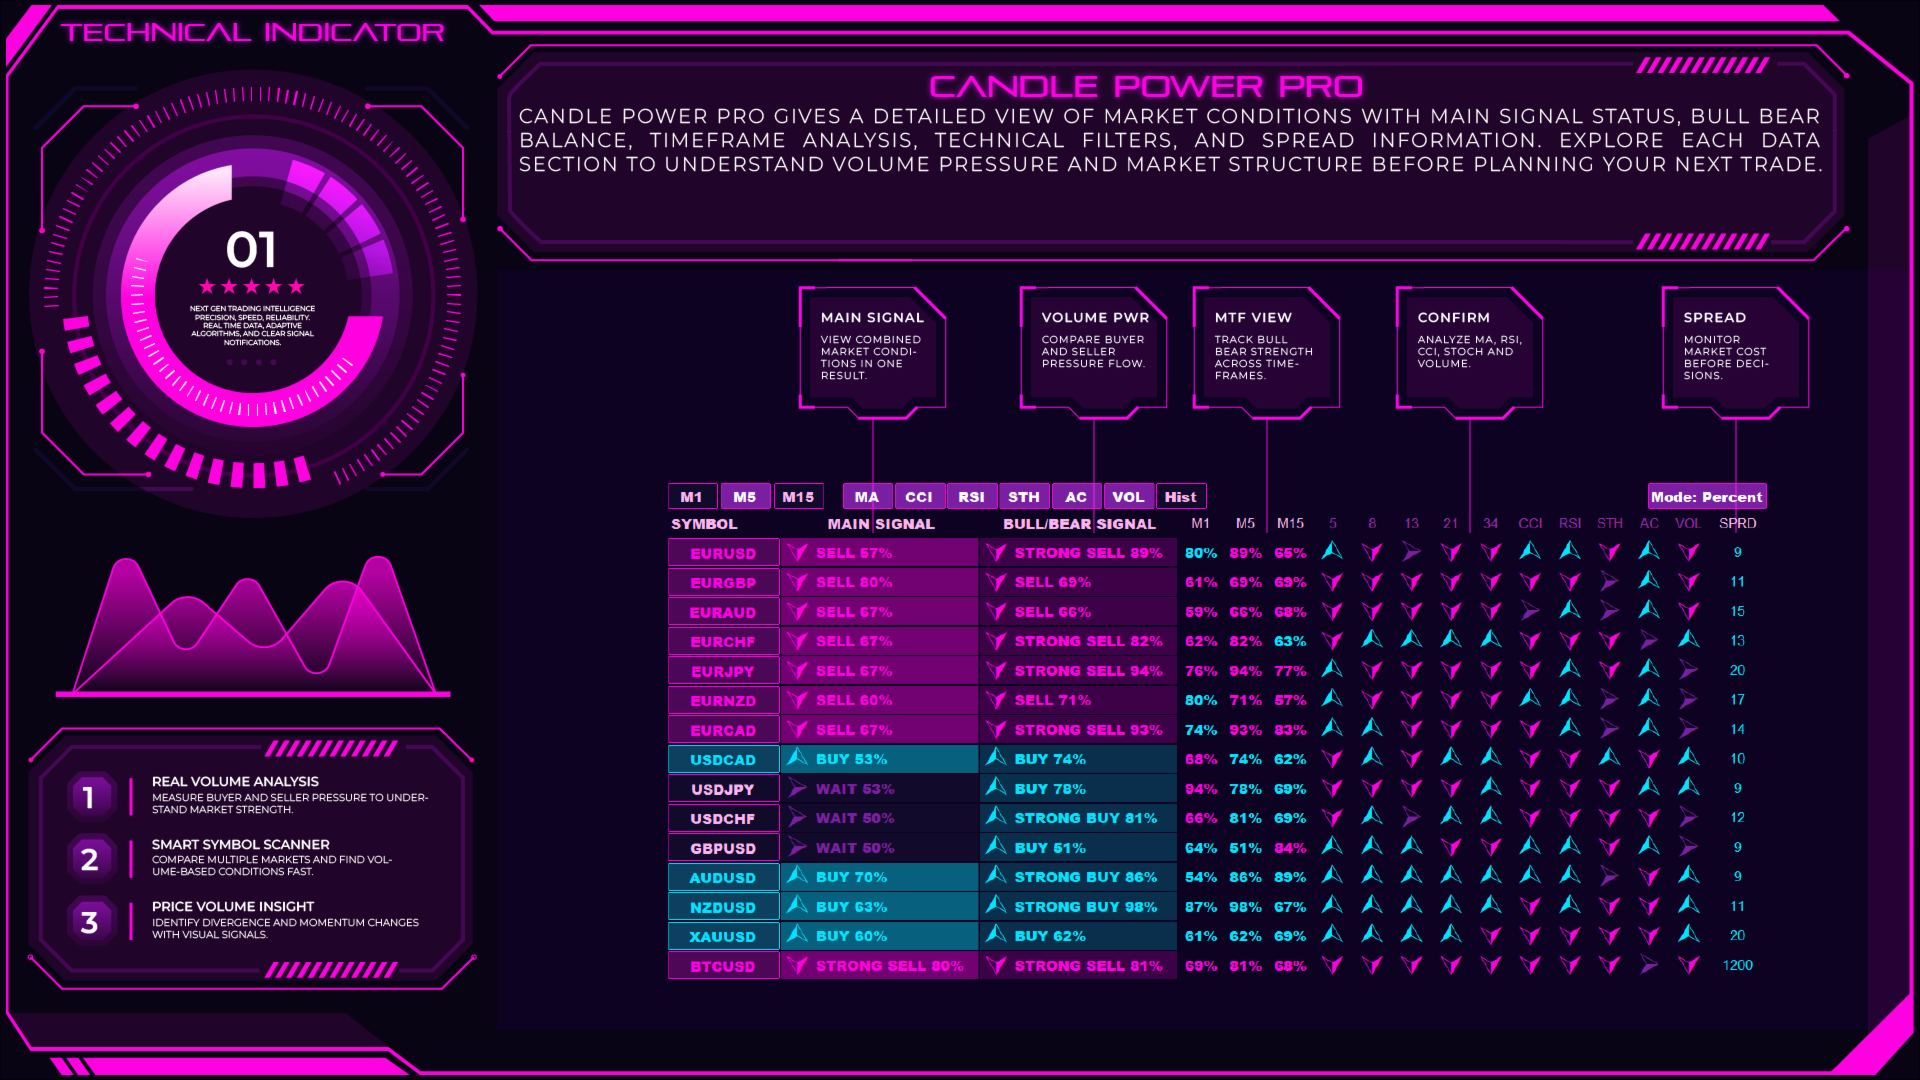
The scanner monitors multiple symbols and displays volume-based market conditions in a single dashboard. Traders can compare instruments and quickly identify symbols showing stronger bullish or bearish volume dominance.
The dashboard can display:
- Bull/Bear percentage
- Volume dominance
- Signal direction
- Technical indicator confirmation
- Market condition overview
Single-Symbol Dashboard Mode
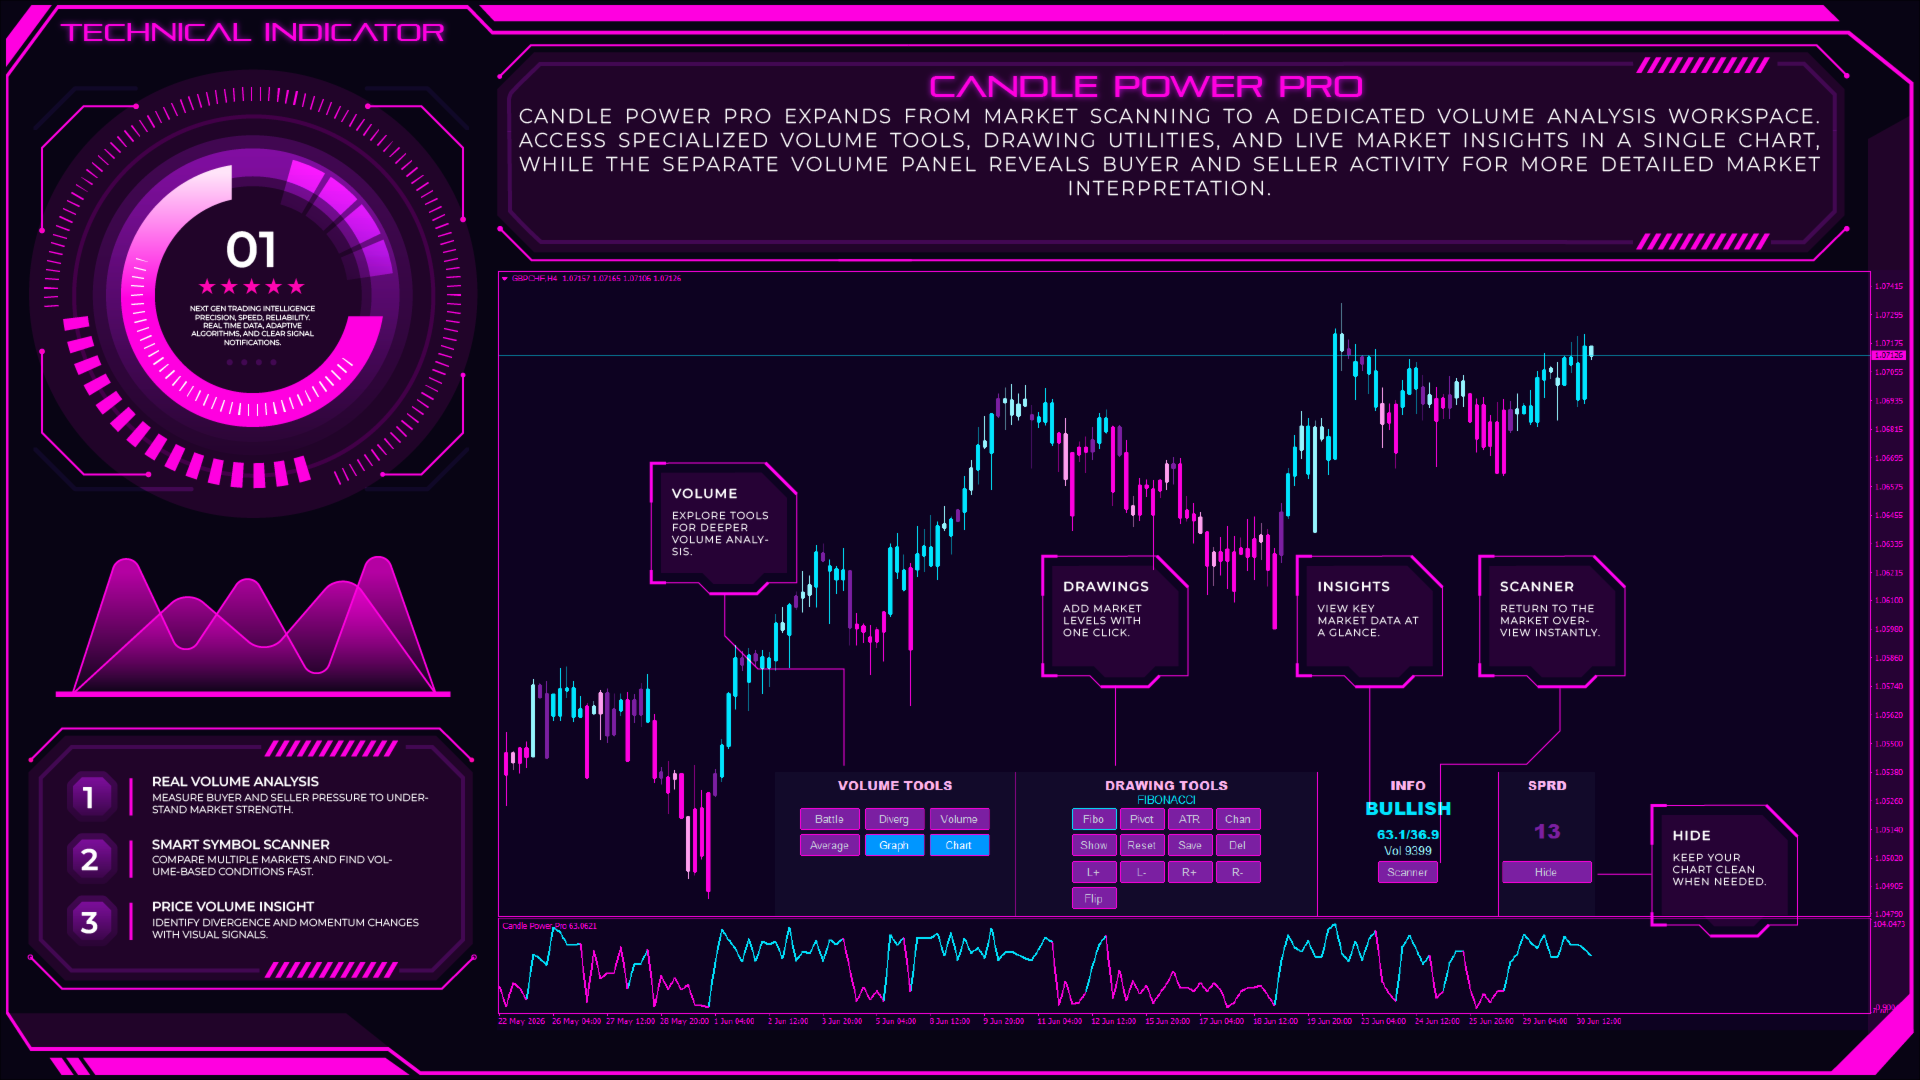
When a symbol is selected, the indicator can open the chart with Candle Power Pro loaded and provide detailed volume analysis tools directly on the chart.
This allows traders to move from market scanning to detailed analysis without manually changing charts.
Key Features
- Real Volume Tick Analysis: Measures bullish and bearish tick volume activity inside candles.
- Buyer/Seller Imbalance Detection: Highlights differences between candle movement and underlying volume pressure.
- Volume-Price Divergence Detection: Displays divergence conditions where price and volume behavior disagree.
- Trend Confirmation Analysis: Helps evaluate whether volume supports current market direction.
- Colored Candles: Customizable candle coloring based on bull/bear volume dominance.
- Divergence Arrows: Marks possible divergence areas when volume behavior differs from price movement.
- Multi-Symbol Scanner Dashboard: Compare volume conditions across multiple trading instruments.
- Single-Symbol Analysis Dashboard:Provides detailed chart analysis after selecting a symbol.
- Multi-Indicator Confirmation System
Includes additional analysis from:- Moving Average trend strength
- CCI
- RSI
- Stochastic
- Momentum
- Spread information
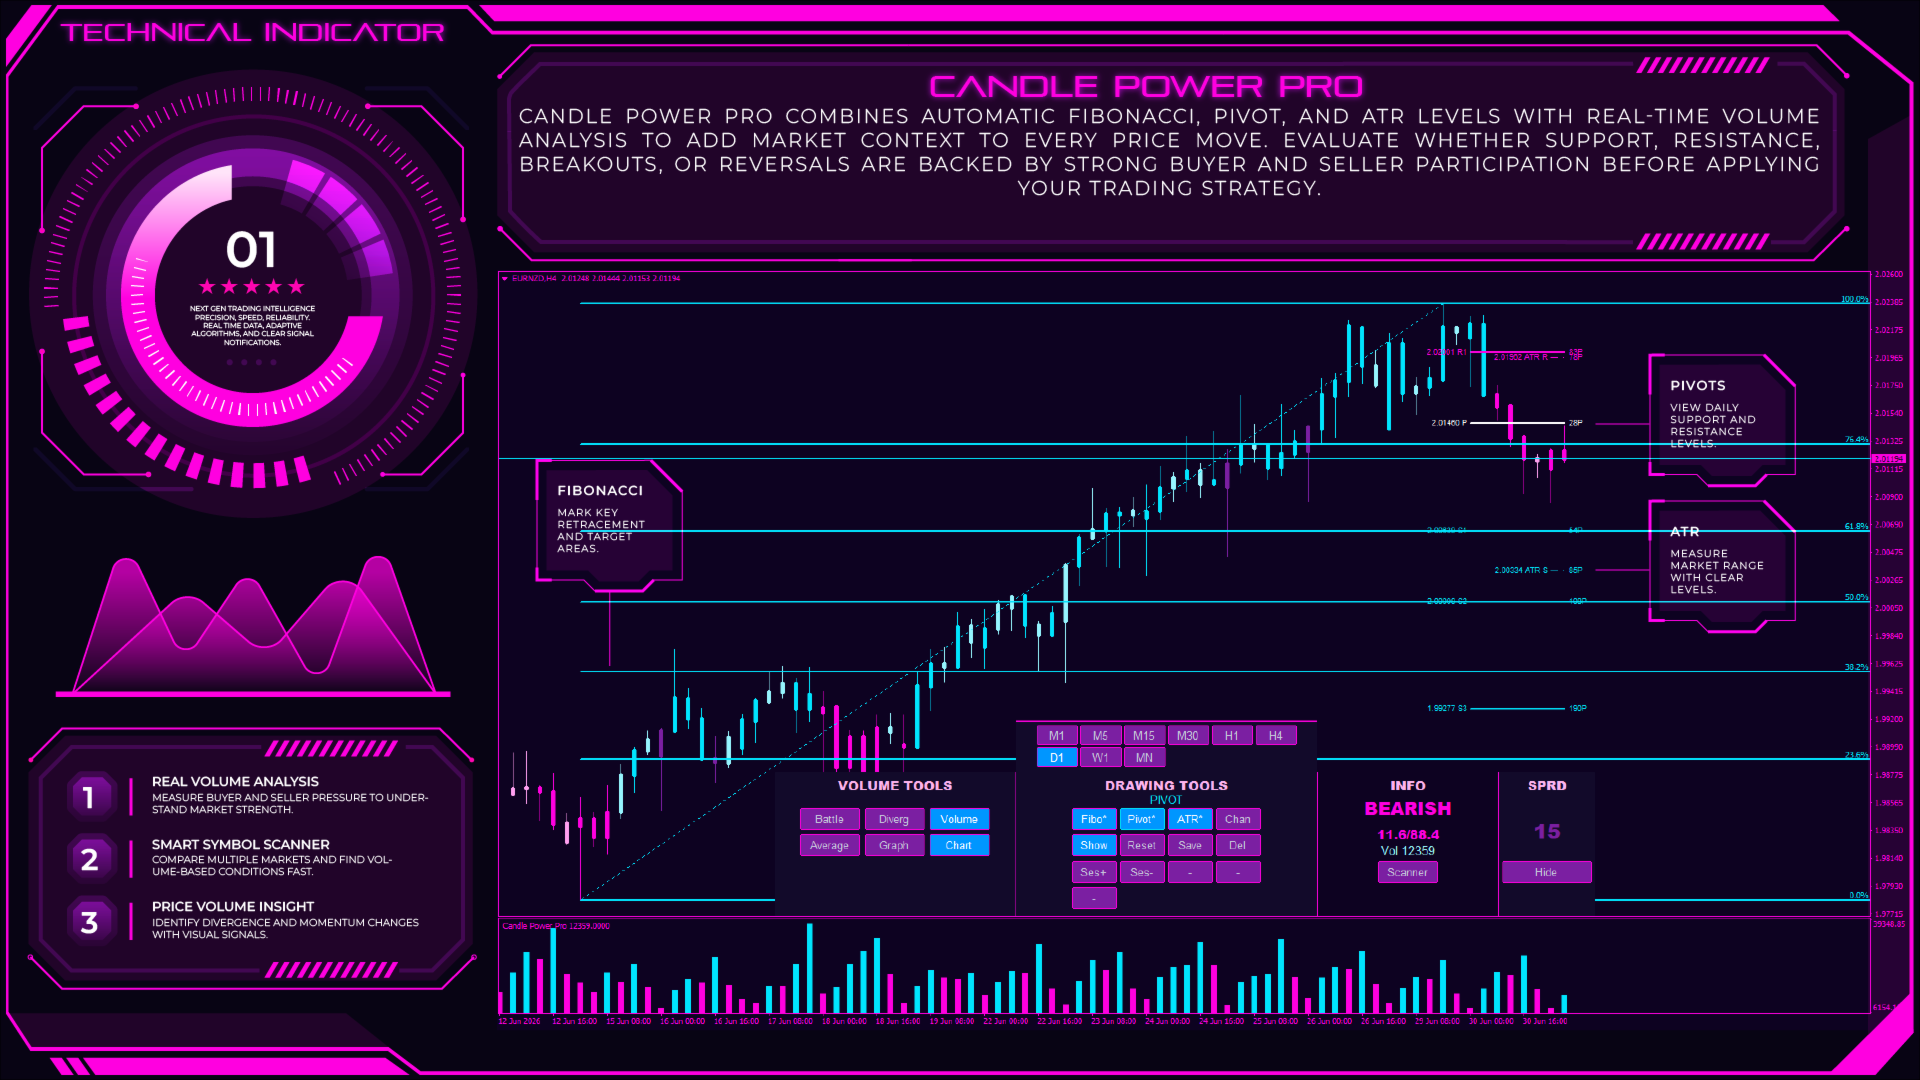
- Integrated Trading Tools
Includes additional chart tools such as:- Automatic Fibonacci
- Pivot Levels
- ATR Analysis
- Trend Channel
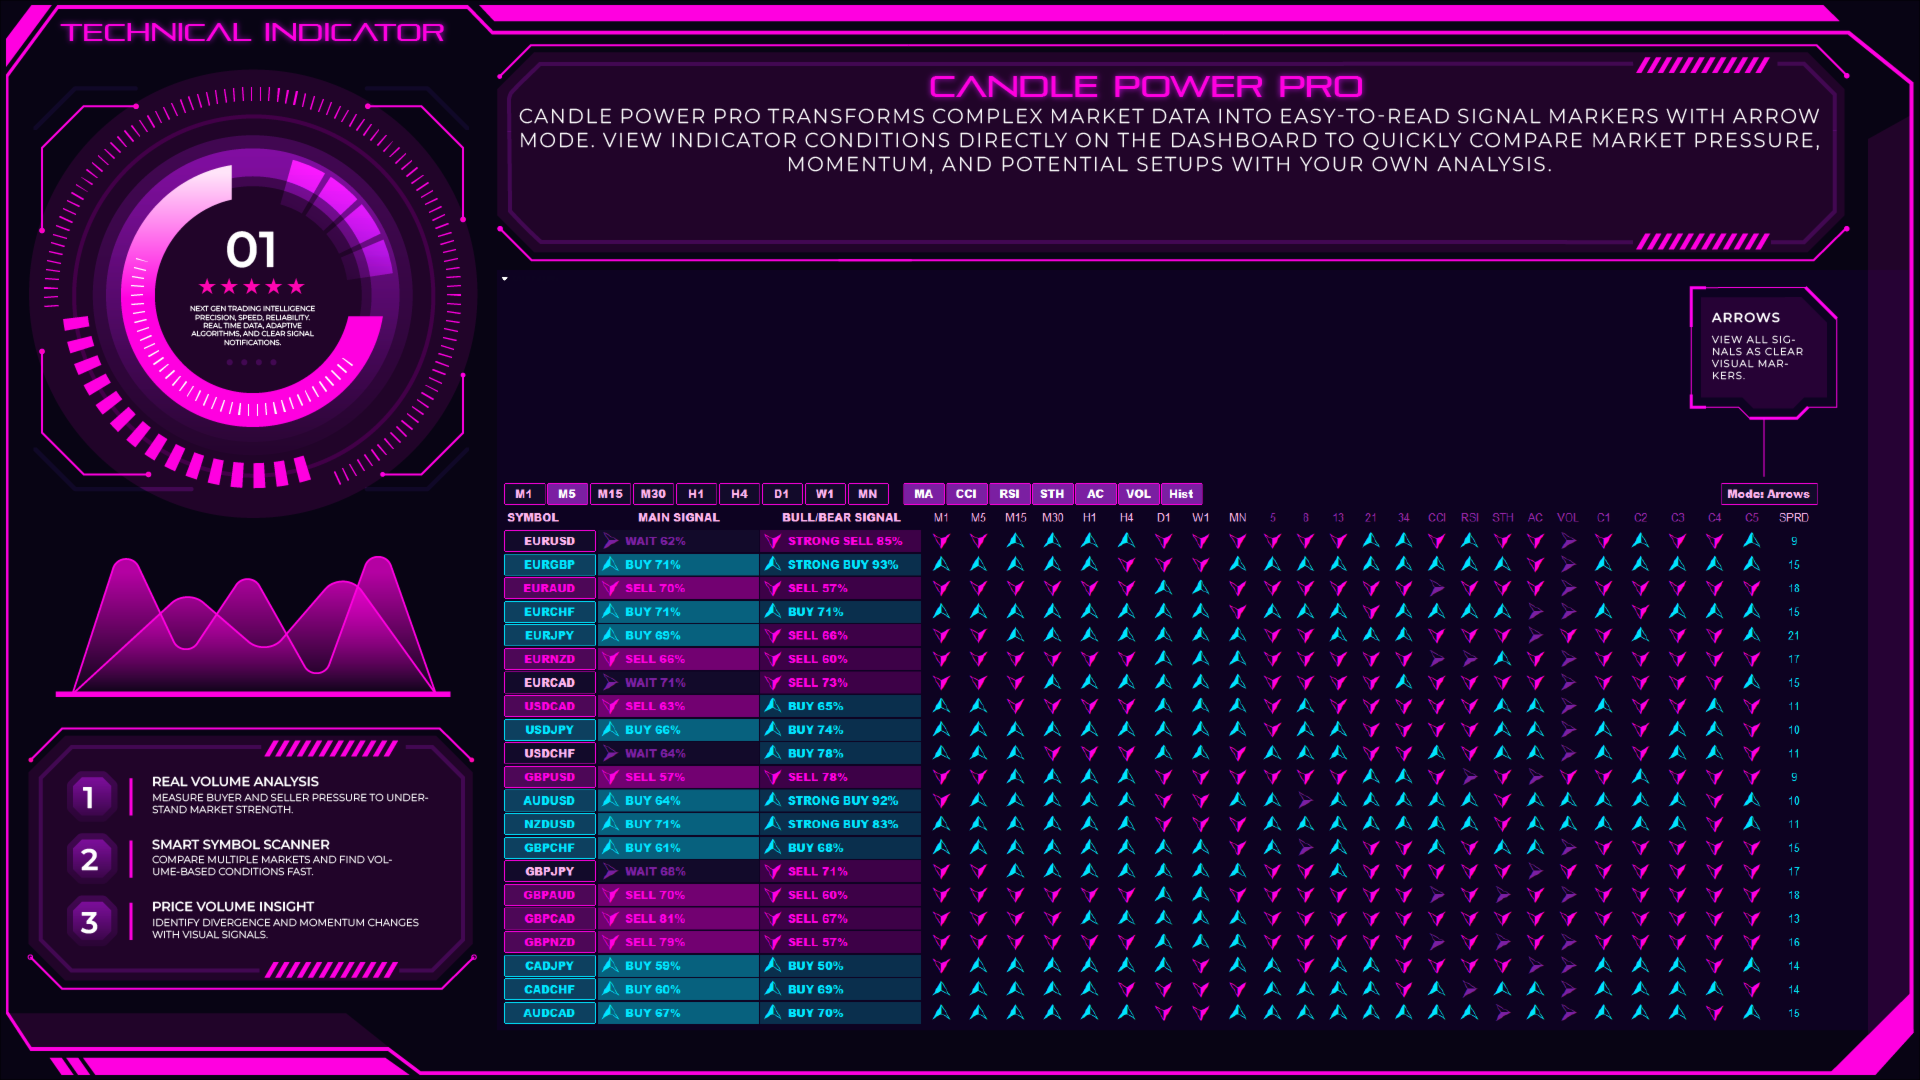
- Signal Classification
Displays market conditions using:- BUY
- SELL
- STRONGLY BUY
- STRONGLY SELL
- WAIT
- Customizable Alerts
Supports:- Popup alerts
- Mobile notifications
- Email alerts
- Volume Filters
Optional filters for:- Minimum volume conditions
- Volume spikes
- Bull/Bear ratio thresholds
- Power shifts
- Custom Dashboard Themes: Multiple dashboard themes and visual customization options.
Practical Trading Application
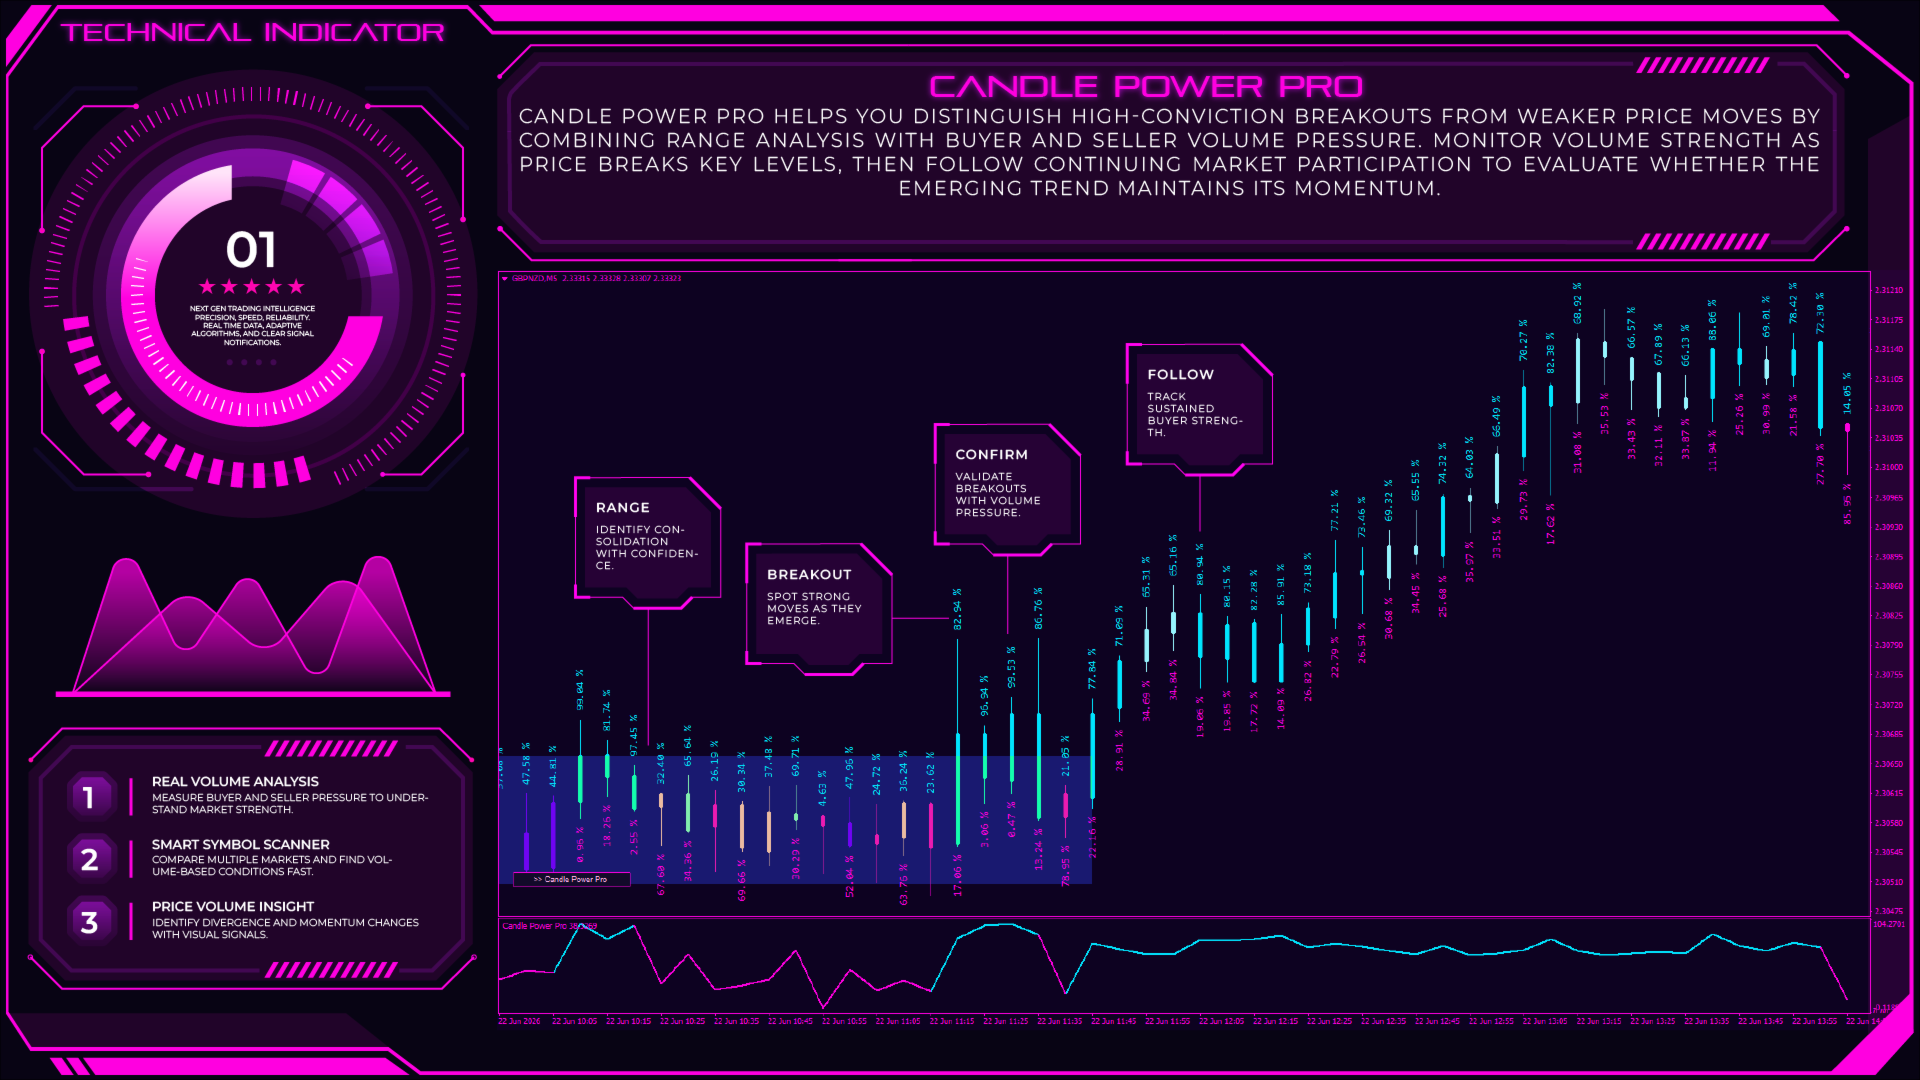
Candle Power Pro can be used with different trading approaches including price action trading, trend following, breakout trading, reversal analysis, scalping, and swing trading.
For price action traders, volume analysis can provide additional context when studying support and resistance levels. A breakout accompanied by stronger volume activity may provide different information compared with a breakout that occurs with weaker participation.
For trend traders, Candle Power Pro can be used as a confirmation tool. When price direction and volume pressure move together, traders can evaluate whether market activity supports the current trend structure.
For breakout traders, the indicator can help analyze whether price movement is supported by increasing market participation or whether volume conditions suggest caution.
For reversal analysis, divergence conditions can highlight situations where price movement and volume strength are not moving together. These areas may require additional confirmation using other technical analysis methods.
For Smart Money Concept (SMC) and institutional-style traders, volume behavior can be studied alongside concepts such as liquidity areas, market structure, Fair Value Gaps, and session-based analysis.
The indicator can also support London and New York session analysis, where volume activity often changes during major market periods.
Ideal For
Candle Power Pro is suitable for:
- Forex Traders analyzing volume and price relationships.
- Gold Traders (XAUUSD) studying momentum and market pressure.
- Crypto Traders monitoring volatile market conditions.
- Index Traders analyzing strong directional movement.
- Scalpers watching short-term volume changes.
- Day Traders scanning intraday opportunities.
- Swing Traders studying larger market structure.
- Price Action Traders combining candles with volume analysis.
- SMC Traders analyzing liquidity and participant behavior.
- Trend Traders confirming directional movement.
- Breakout Traders evaluating volume-supported moves.
- Systematic Traders using dashboard-based market scanning.
Optimal Configuration
Candle Power Pro can be customized for different markets and trading styles.
For scalping, traders may use lower timeframes such as M1, M5, and M15 to monitor short-term volume changes and momentum shifts.
For day trading, timeframes such as M15, M30, and H1 can provide a balance between intraday movement and market structure.
For swing trading, H1, H4, and D1 charts can be used to analyze broader volume trends and price behavior.
The Multi-Symbol Scanner allows traders to monitor multiple instruments including:
- Forex pairs
- XAUUSD Gold
- Cryptocurrency markets
- Index CFDs
The dashboard can be customized with different display modes, themes, alert settings, and calculation filters.
Traders can adjust:
- Bull/Bear thresholds
- Volume filters
- Alert confirmations
- Dashboard settings
- Technical indicator options
according to their preferred analysis workflow.
Final Notes
Candle Power Pro is a volume-based market analysis tool designed to visualize candle strength, volume pressure, and price-volume relationships. It does not predict future price movements or guarantee trading results. Instead, it provides traders with additional information about market participation and momentum conditions.
By combining real tick volume analysis, multi-symbol scanning, technical confirmation tools, and chart-based visualization, Candle Power Pro helps traders organize volume-based analysis into a structured trading workflow.
Traders should combine indicator information with their own market analysis, proper risk management, and suitable trading practices. Testing different settings and instruments can help determine the configuration that matches each trader's approach.


The best indicator I’ve found, and the only reason I still use MT4.