ImpulseMap MT5
- Indicators
-
Thushara Dissanayake
 I’ve always loved exploring new trading strategies, testing them with indicators, and automating them with expert advisors (EAs). Welcome to my world of Forex Trading Robots, Indicators, and Trading Tools, all specially built for the MetaTrader platform.
 - Version: 1.0
- Activations: 5
Core Functionality
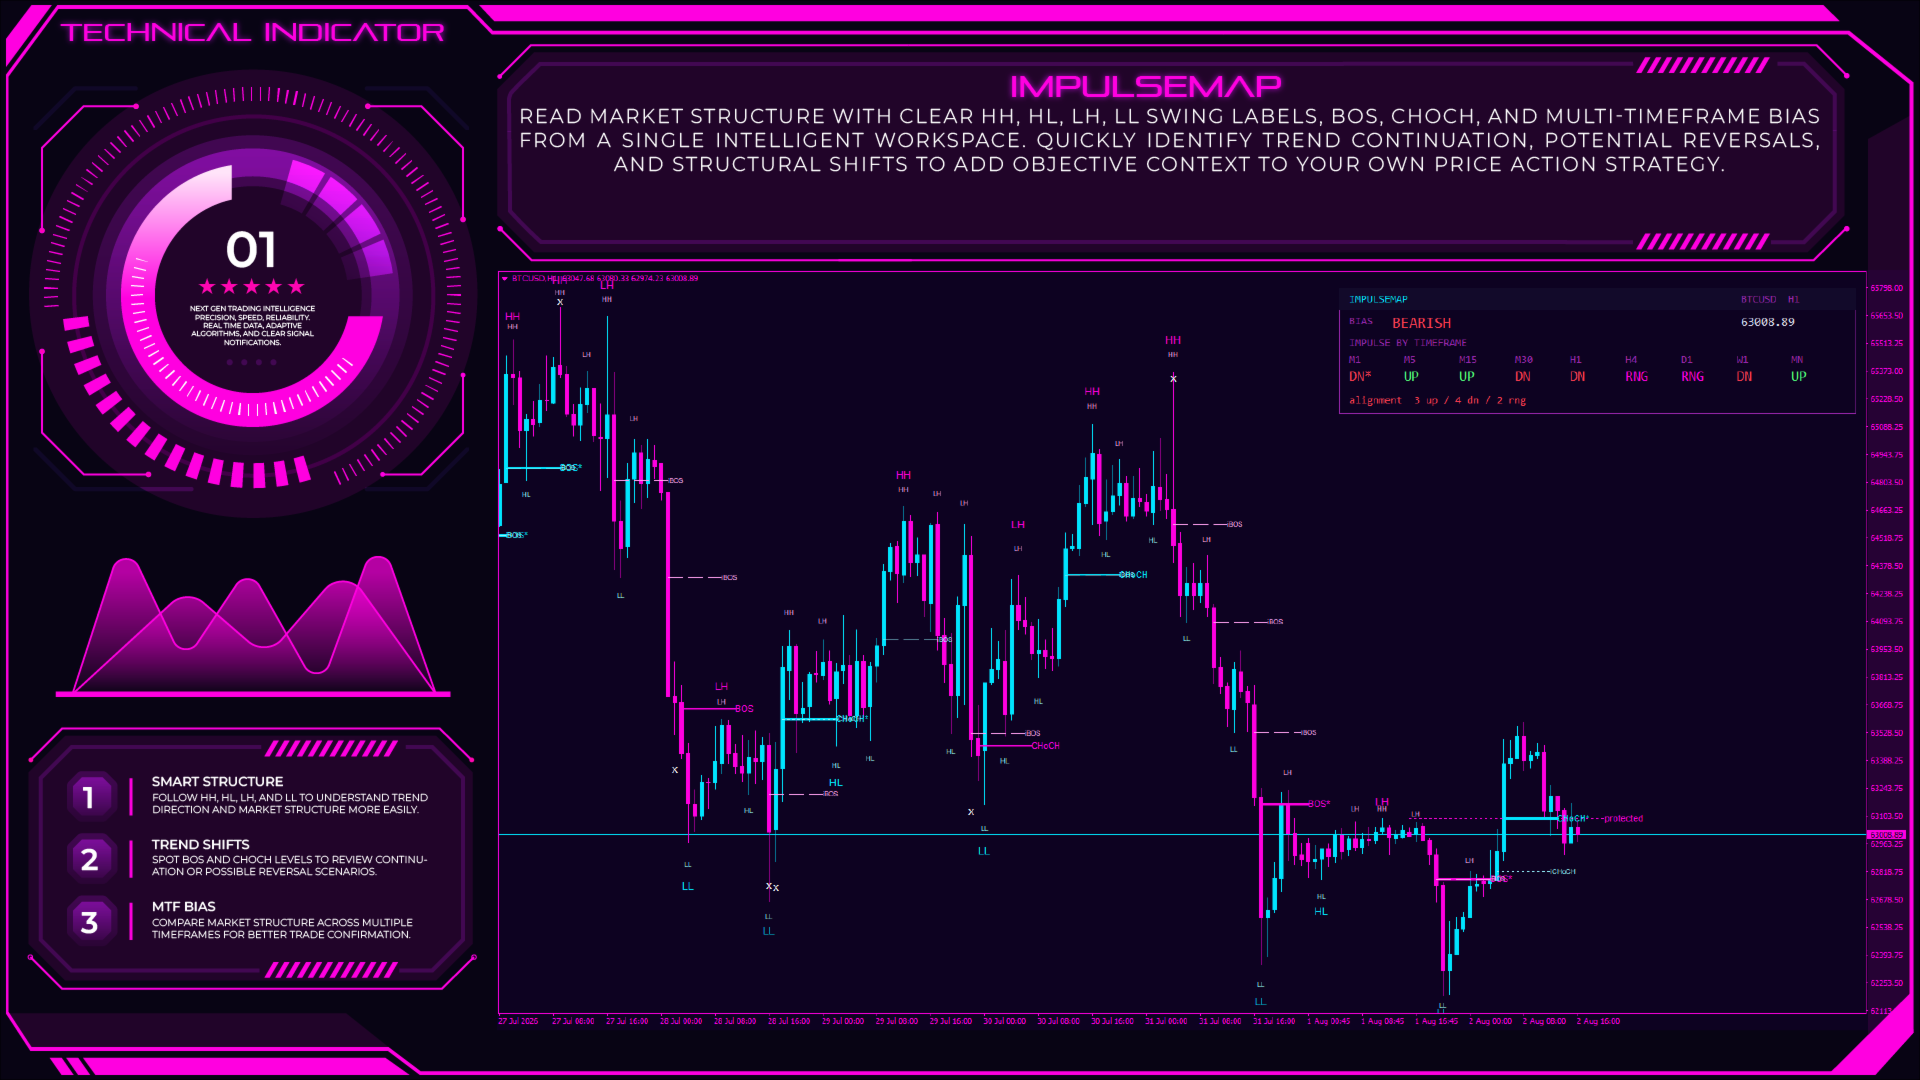
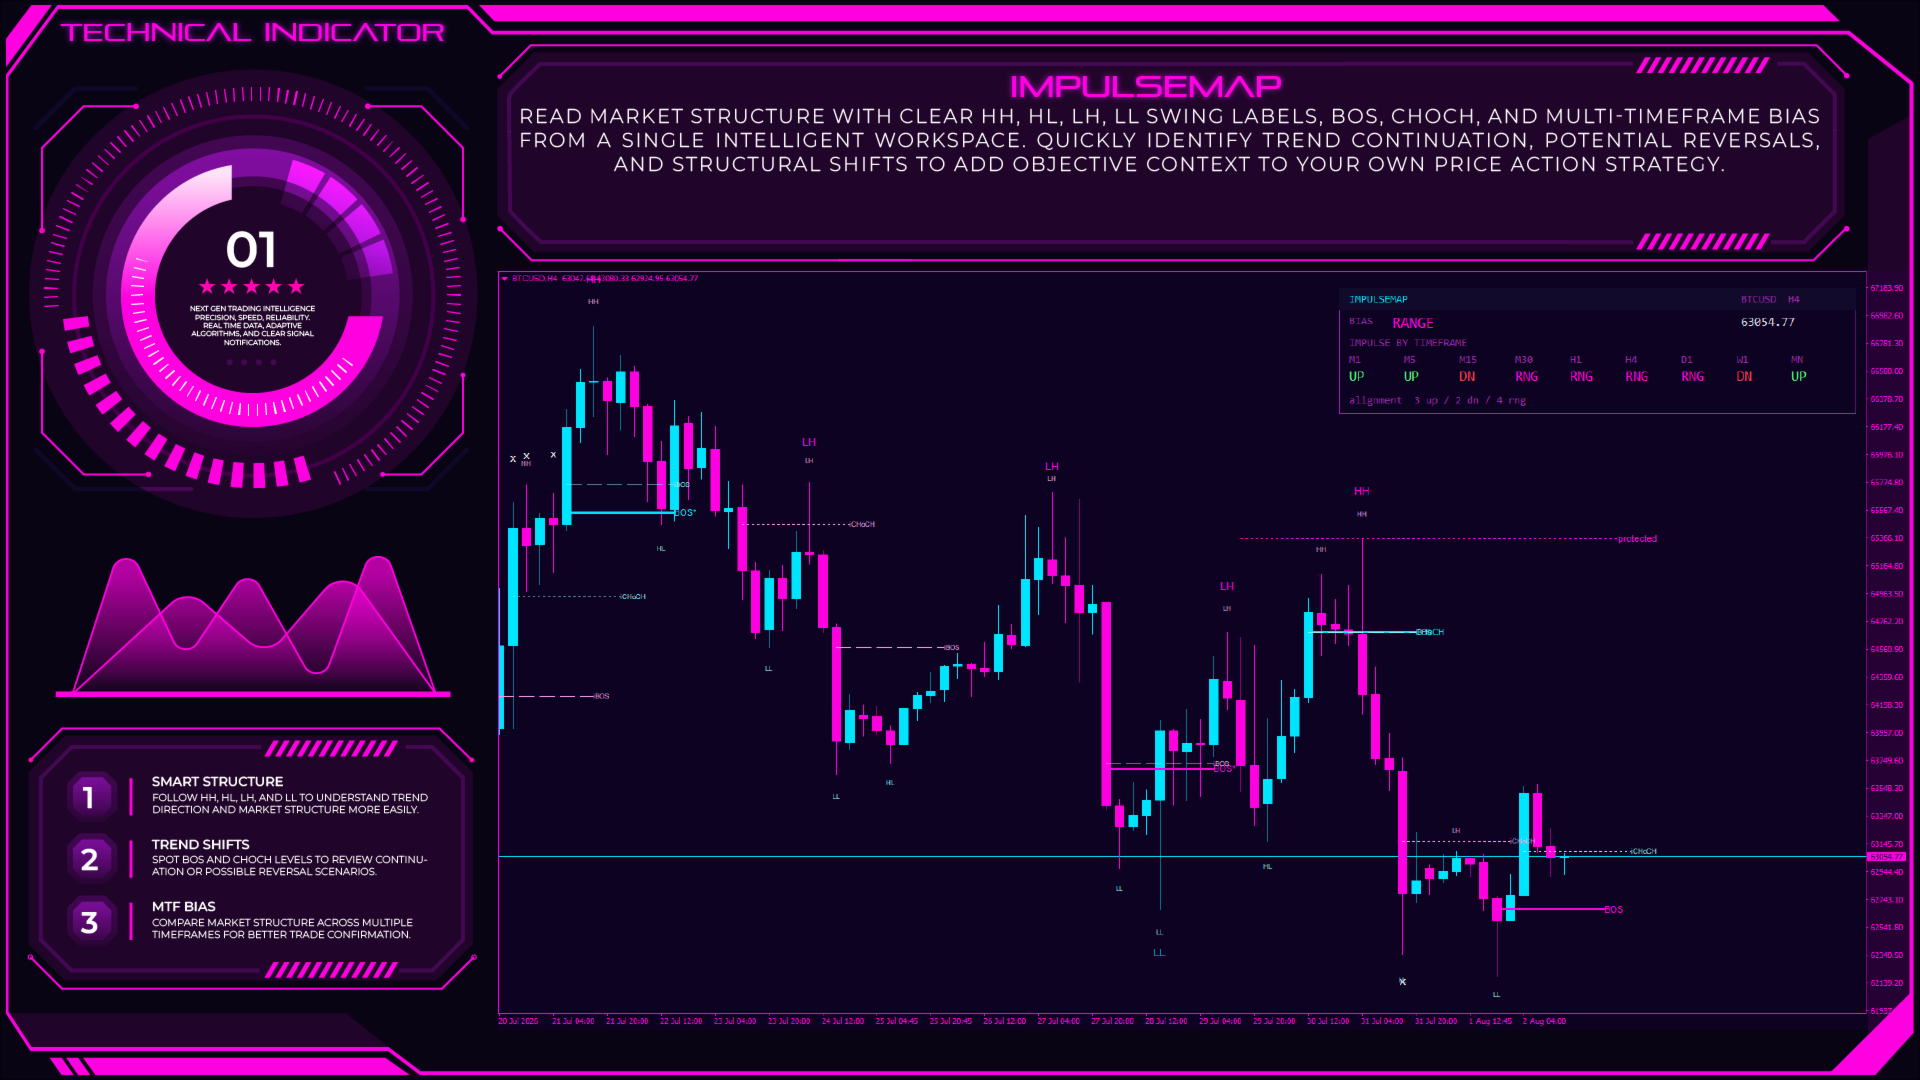
ImpulseMap continuously scans price action to identify confirmed fractal swing highs and swing lows, automatically classifying each new swing as a Higher High (HH), Higher Low (HL), Lower High (LH), or Lower Low (LL). These swing relationships form the foundation of market structure analysis and provide an objective framework for understanding whether the market is trending, consolidating, or beginning to reverse.
Using these confirmed swing points, the indicator automatically detects Breaks of Structure (BOS) and Changes of Character (CHoCH). A BOS is identified when price breaks beyond a significant swing in the direction of the existing trend, while a CHoCH highlights the first meaningful structural break against the prevailing trend, helping traders recognize potential changes in market direction. Strong displacement breaks are additionally highlighted, making significant structural shifts easier to identify during live market analysis.
ImpulseMap also separates major market structure from internal market structure. The major structure follows larger swing movements that define the primary trend, while the internal structure tracks smaller price swings within each leg. This dual-layer approach allows traders to study both long-term trend development and shorter-term structural changes without cluttering the chart.
To improve the quality of structural analysis, the indicator automatically detects Liquidity Sweeps, identifying situations where price briefly breaks beyond an important swing before quickly returning back into the previous range. This helps distinguish genuine structural breaks from stop-run events that often occur before market reversals.
A Protected Swing level is automatically maintained as the current structural invalidation point, providing a clear visual reference for the active trend. As new confirmed swings develop, the protected level updates automatically, allowing traders to monitor structural integrity without manually redrawing swing levels.
ImpulseMap also includes a Multi-Timeframe Structure Panel that analyzes multiple chart periods simultaneously. The panel displays the current directional bias for each selected timeframe together with an overall alignment score, making it easier to compare lower timeframe price action with higher timeframe market structure before evaluating trading opportunities.
To support different trading methodologies, traders can choose how structural breaks are confirmed using wick breaks, candle close confirmation, or candle close with an ATR buffer. This flexibility allows the indicator to adapt to both aggressive and conservative approaches to market structure analysis.
Every market structure object includes an optional educational tooltip explaining what it represents and how it is commonly interpreted within Price Action and Smart Money Concepts analysis. Combined with configurable popup, sound, mobile push, and email alerts, ImpulseMap provides a comprehensive market structure workspace for studying trend development across any symbol or timeframe.
Key Features
- Automatic Market Structure Detection – Identifies and labels Higher Highs (HH), Higher Lows (HL), Lower Highs (LH), and Lower Lows (LL) as confirmed swing points develop.
- Break of Structure (BOS) & Change of Character (CHoCH) – Automatically detects major structural breaks and potential trend reversals, with enhanced marking for strong displacement breaks.
- Dual Structure Analysis – Separates major swing structure from internal market structure, allowing traders to monitor both long-term trend direction and shorter-term price movements.
- Liquidity Sweep Detection – Recognizes stop-run events where price briefly breaks a swing level before reclaiming it, helping distinguish false breakouts from genuine structural changes.
- Protected Swing Levels – Automatically plots the current structural invalidation level, providing a clear reference for monitoring trend continuation or failure.
- Multi-Timeframe Structure Panel – Displays the directional bias for multiple timeframes together with an overall alignment score, helping traders compare higher and lower timeframe market structure.
- Flexible Break Confirmation – Choose between wick, candle close, or ATR-buffer confirmation when validating structural breaks.
- Educational Tooltips – Every BOS, CHoCH, swing label, and structural object includes an optional explanation to help traders understand its purpose and interpretation.
- Smart Alerts – Receive popup, sound, mobile push, and email notifications for BOS, CHoCH, liquidity sweeps, internal structure breaks, and multi-timeframe bias changes.
- Fully Customizable Interface – Personalize colors, sensitivity, dashboard appearance, chart theming, and choose from 22 built-in dashboard themes to suit your preferred workspace.
Practical Trading Application
ImpulseMap is designed for traders who use Market Structure, Price Action, Smart Money Concepts (SMC), and ICT trading concepts to analyse financial markets.
Many traders begin their analysis by identifying the sequence of Higher Highs, Higher Lows, Lower Highs, and Lower Lows. ImpulseMap performs this process automatically, making it easier to recognize whether the market is trending, consolidating, or beginning to reverse without manually marking every swing.
For trend-following strategies, Break of Structure (BOS) can help confirm that the existing trend remains intact, while Change of Character (CHoCH) may highlight the first indication that market sentiment is changing. Viewing these events together with the protected swing level provides additional context when evaluating trend strength.
Traders using Smart Money Concepts (SMC) or ICT methodologies can combine market structure, liquidity sweeps, and multi-timeframe bias to build a clearer understanding of market behaviour. Internal structure offers an earlier view of developing momentum, while major structure helps maintain focus on the broader trend.
For scalping and day trading, the internal structure layer can help monitor short-term market changes on lower timeframes. Swing traders can focus on major structural shifts and higher timeframe alignment to study longer-term market development.
The integrated Multi-Timeframe Structure Panel allows traders to compare trend direction across multiple timeframes from a single chart, making it easier to evaluate whether lower timeframe movements are aligned with the broader market structure.
Whether analysing Forex, Gold (XAUUSD), Indices, Cryptocurrencies, Stocks, or other CFD markets, ImpulseMap provides a structured and objective framework for reading price action, identifying trend changes, and understanding market structure across any timeframe.
Ideal For
ImpulseMap is designed for traders who use Market Structure, Price Action, and Smart Money Concepts (SMC) to analyse financial markets.
This indicator is suitable for:
- Forex Traders studying trend development and structural changes.
- Gold (XAUUSD) Traders analysing price action and liquidity.
- Index Traders trading US30, NAS100, GER40, and other CFD indices.
- Cryptocurrency Traders monitoring market structure across volatile digital assets.
- Scalpers following internal market structure on lower timeframes.
- Day Traders combining market structure with multi-timeframe confirmation.
- Swing Traders analysing major trend continuation and reversal patterns.
- Price Action Traders using objective swing analysis instead of manually marking structure.
- Smart Money Concepts (SMC) and ICT Traders studying BOS, CHoCH, Liquidity Sweeps, and multi-timeframe bias.
- Discretionary Traders seeking a structured and visual approach to trend analysis across multiple markets.
Optimal Configuration
ImpulseMap works on all MetaTrader timeframes from M1 to MN and supports Forex, Gold (XAUUSD), Indices, Cryptocurrencies, Stocks, Commodities, and other CFD markets.
- Scalping: M1, M5, M15 using Internal Market Structure for short-term trend changes.
- Day Trading: M15, M30, H1 using BOS, CHoCH, and Multi-Timeframe Structure for market confirmation.
- Swing Trading: H4, D1, and W1 focusing on Major Market Structure, protected swings, and higher timeframe trend alignment.
The indicator can be customized by selecting the preferred break confirmation method (wick, candle close, or ATR confirmation), adjusting structure sensitivity, enabling or disabling internal structure, choosing the displayed timeframes, configuring alerts, and selecting from 22 dashboard themes. Optional chart-surface theming can also be enabled to create a consistent visual workspace.
Final Notes
ImpulseMap is a Market Structure Indicator that automatically maps Higher Highs, Higher Lows, Lower Highs, Lower Lows, Breaks of Structure (BOS), Changes of Character (CHoCH), Liquidity Sweeps, and Multi-Timeframe Trend Analysis into a clear visual framework. By combining objective swing analysis with educational explanations and flexible customization, it helps traders study market behaviour without manually drawing structure on every chart.
The indicator does not predict future price movements or guarantee trading results. Instead, it provides a structured approach to market analysis, trend confirmation, and price action interpretation, and is intended to be used alongside sound trading plans, independent analysis, and appropriate risk management.