ORB Seeker

4

Special price to limit availability and maintain scarcity of the product! 

Only $599!

After purchase contact me to get the bonus ORB Seeker EA and personal optimized set files.


Catch clean session breakouts with confidence!

ORB Seeker is a professional Opening Range Breakout (ORB) indicator built for traders who want accuracy, simplicity, flexibility, and clear chart structure.

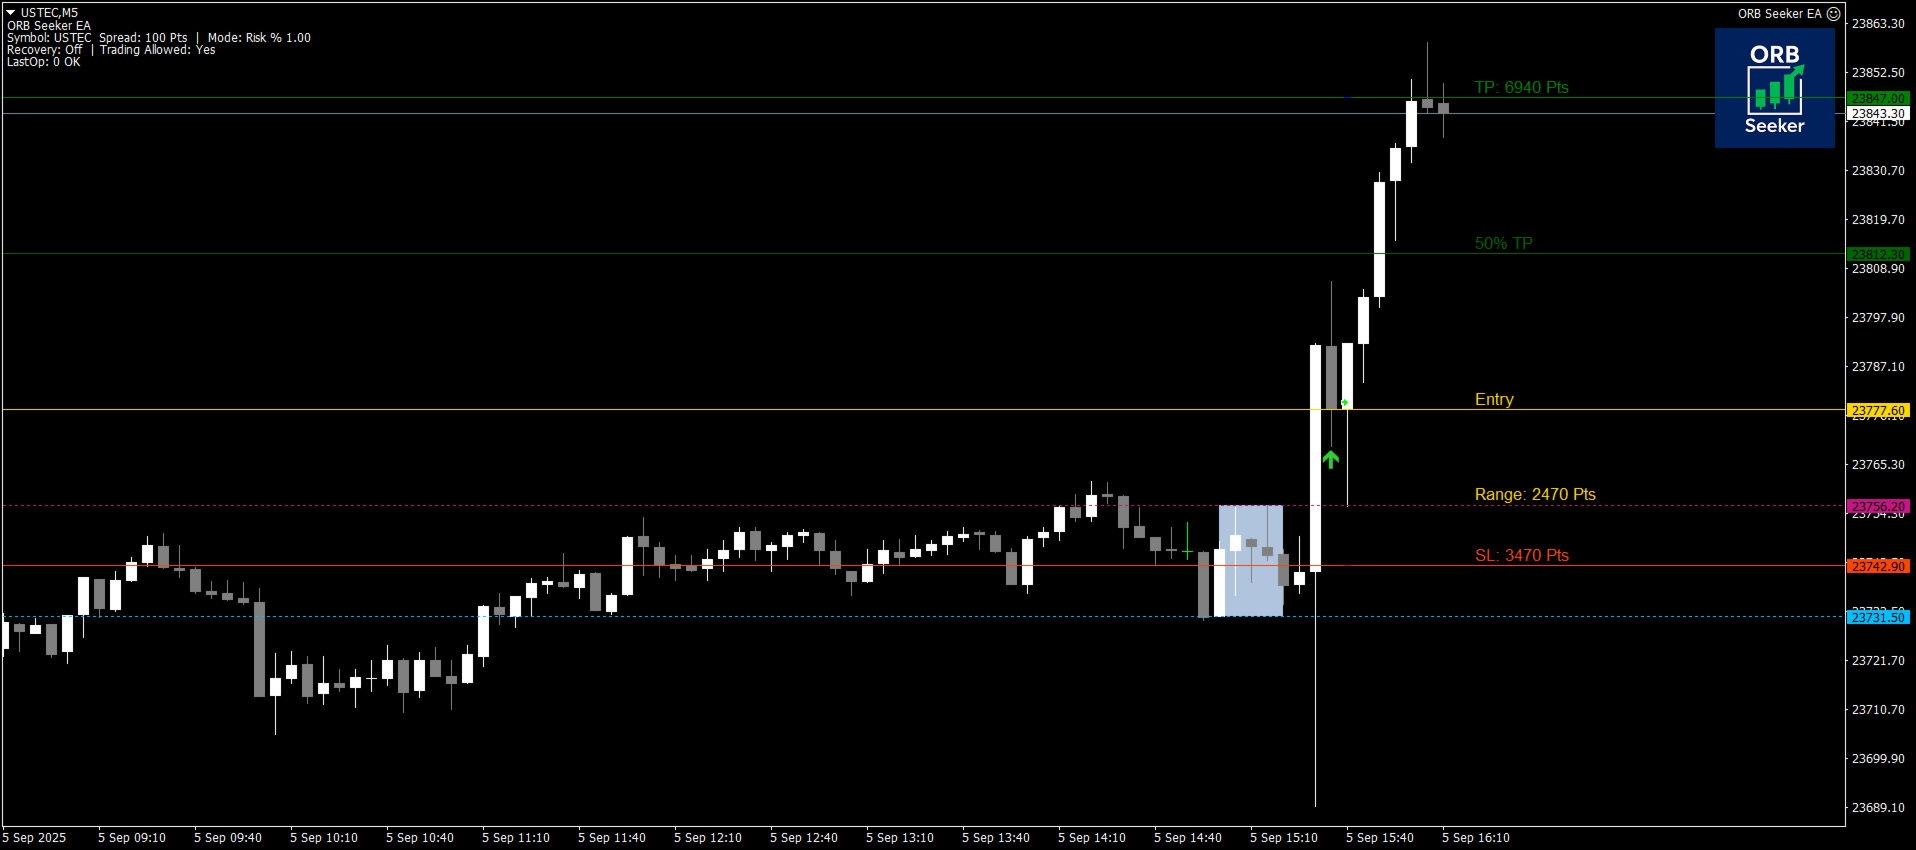
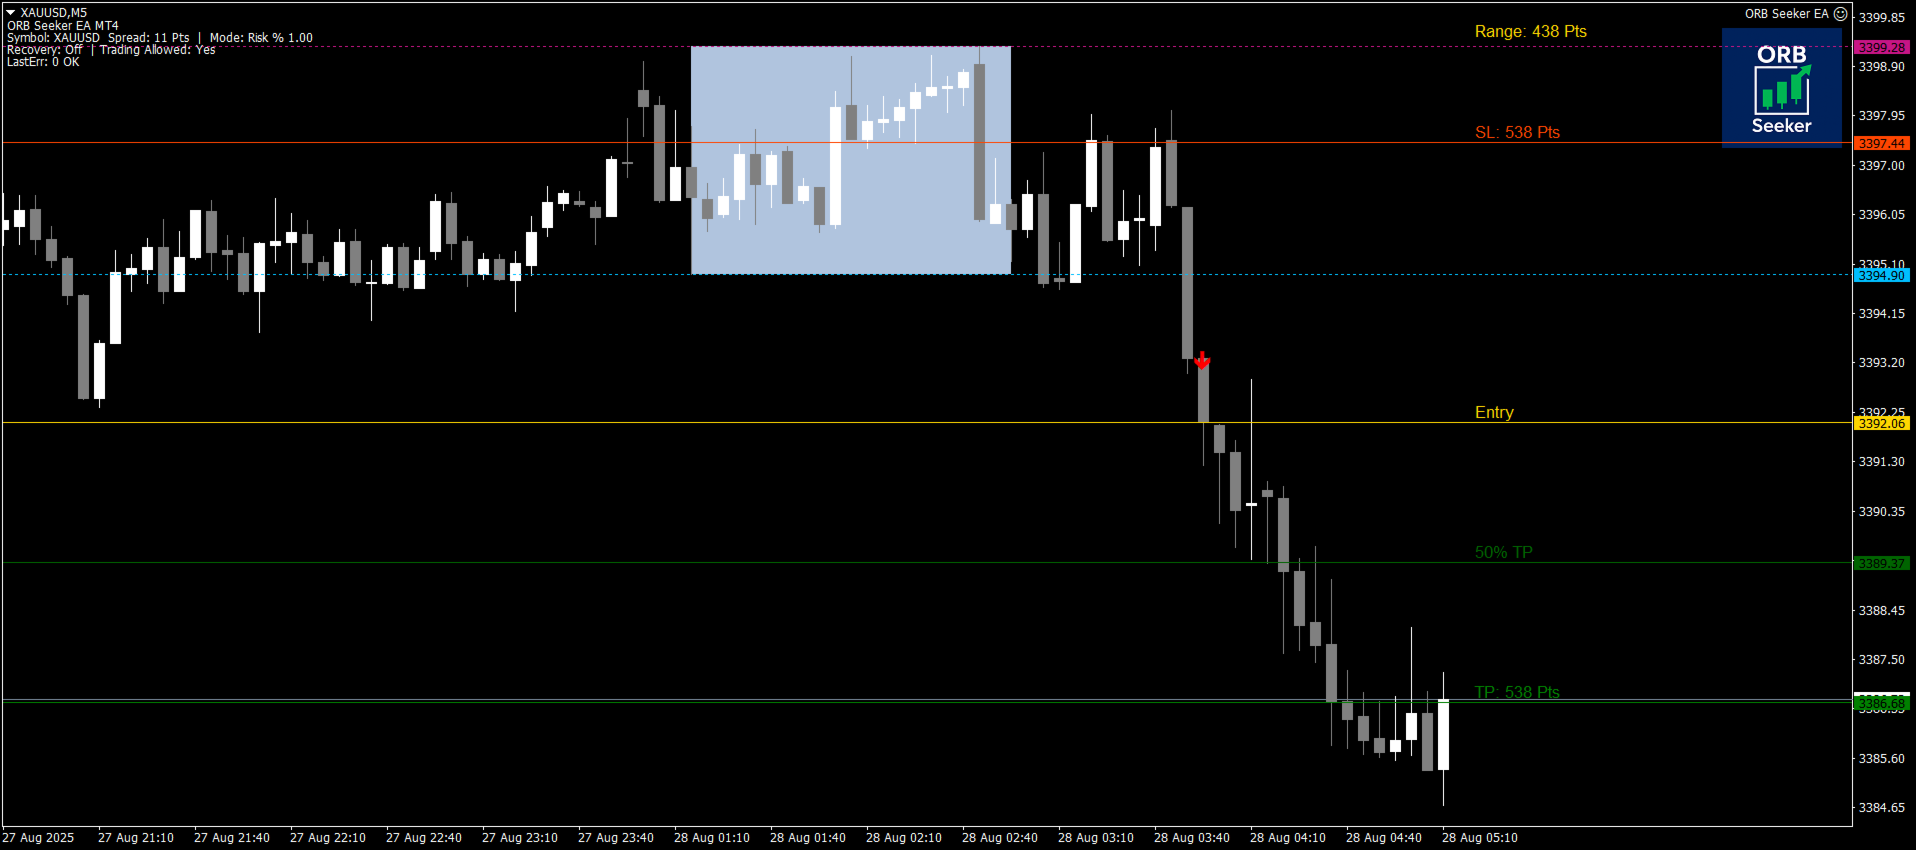
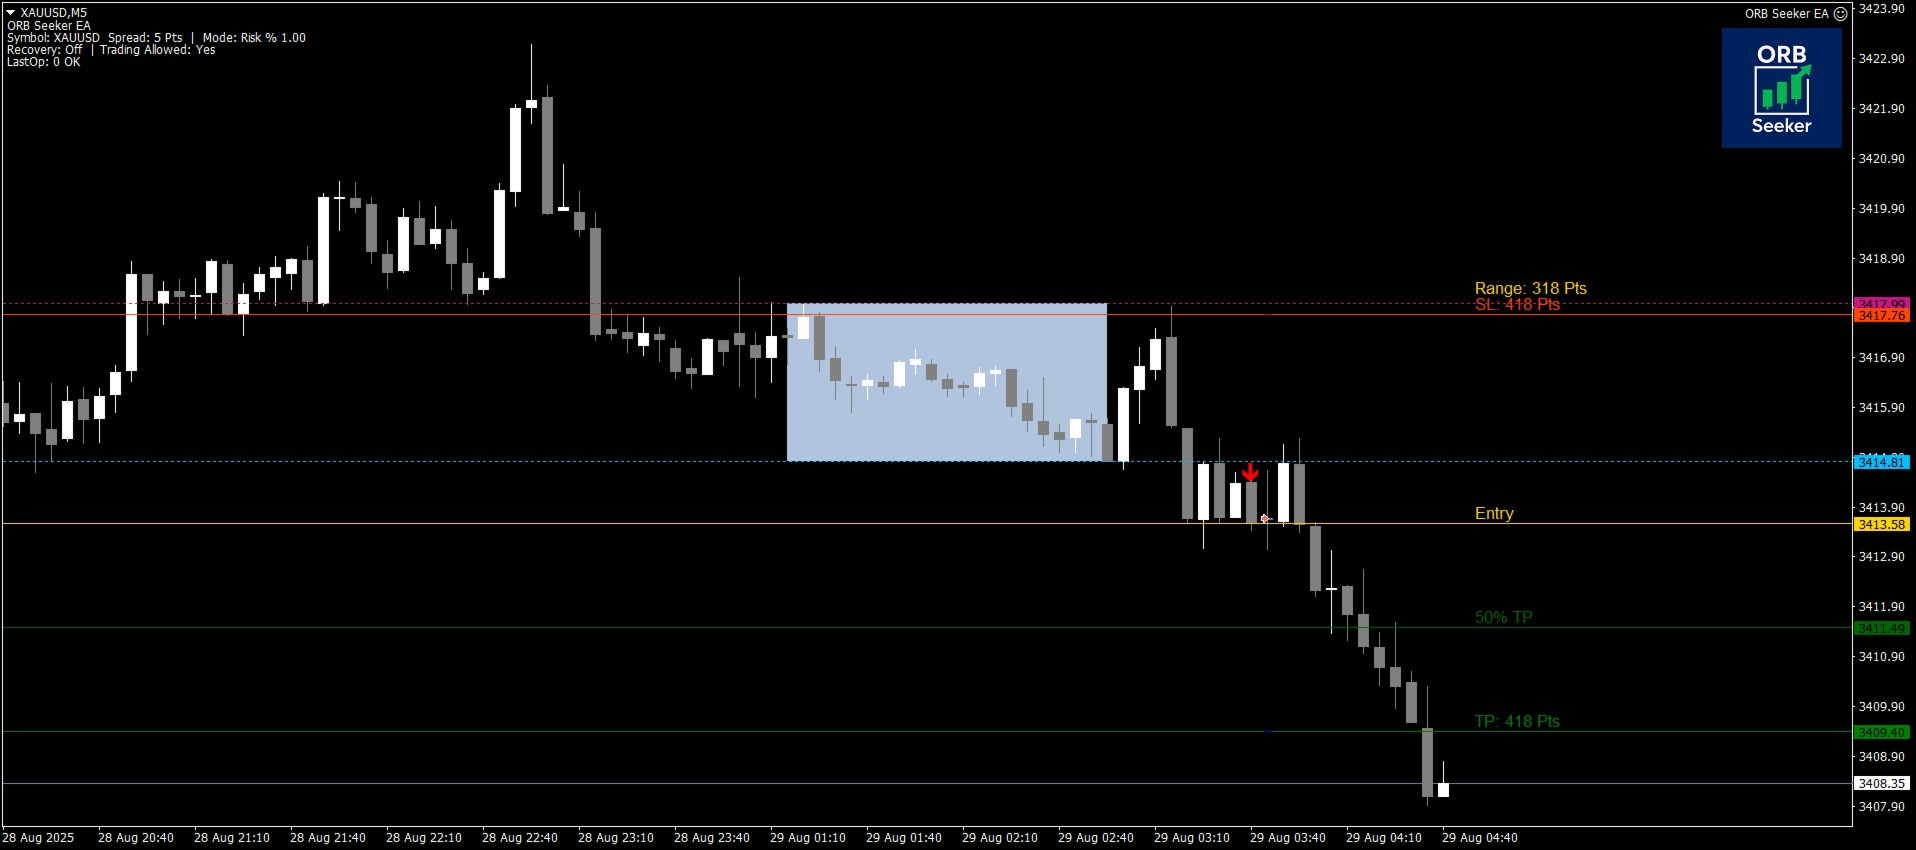
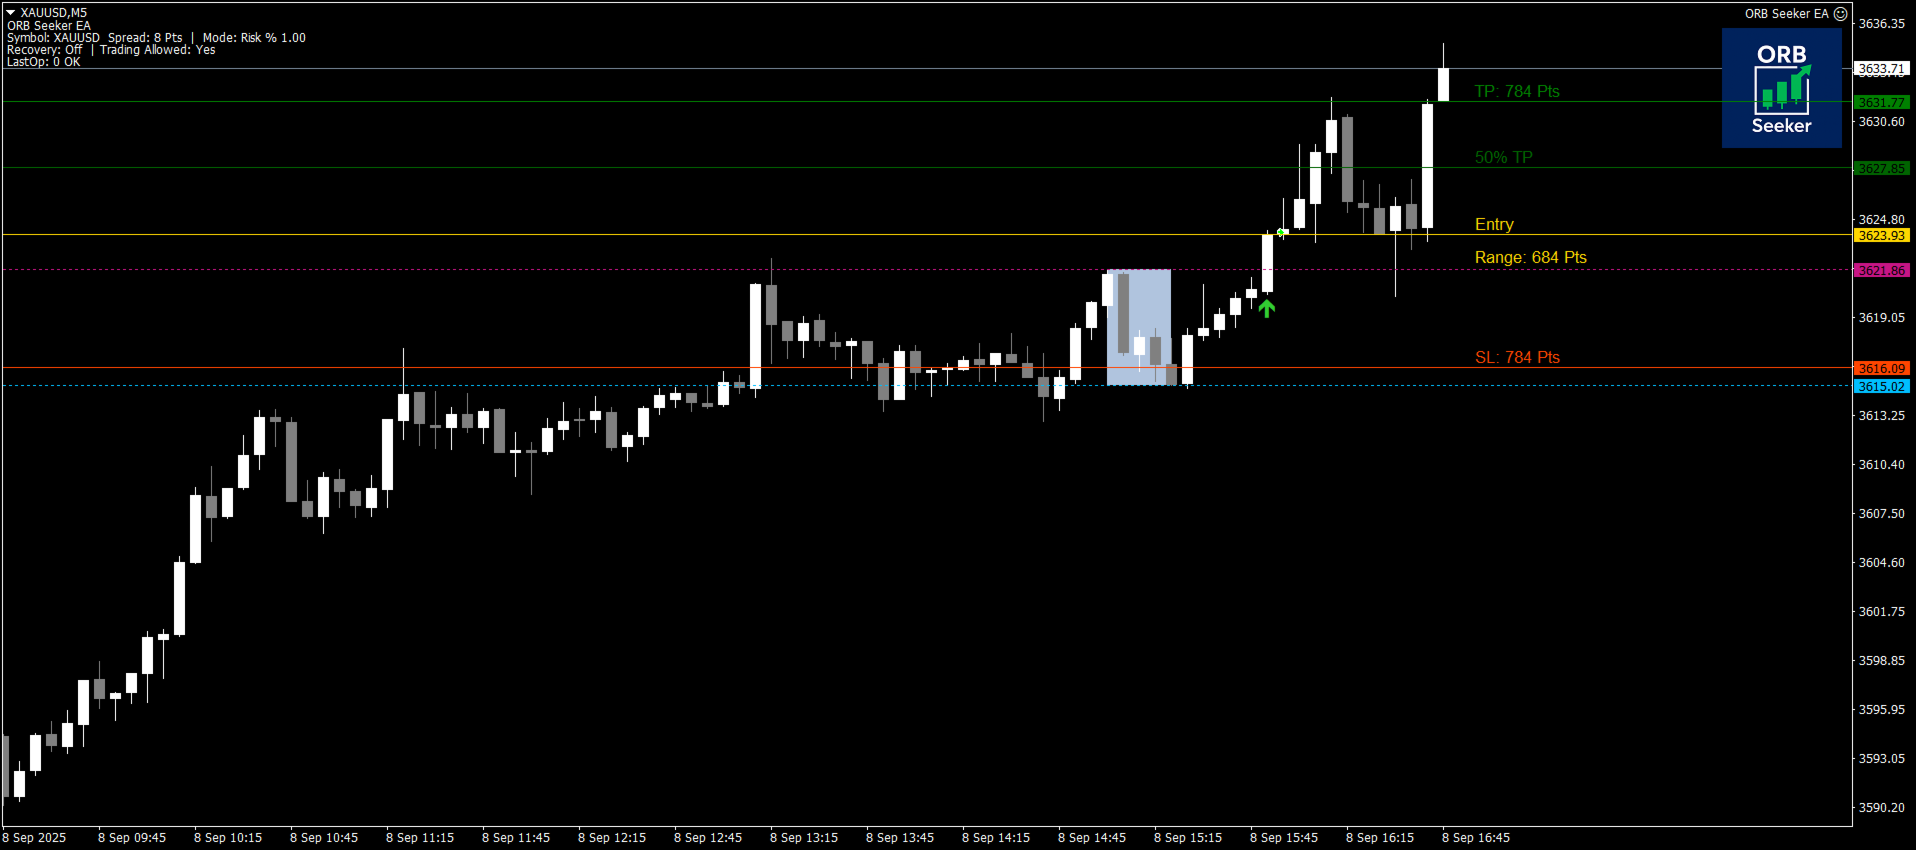
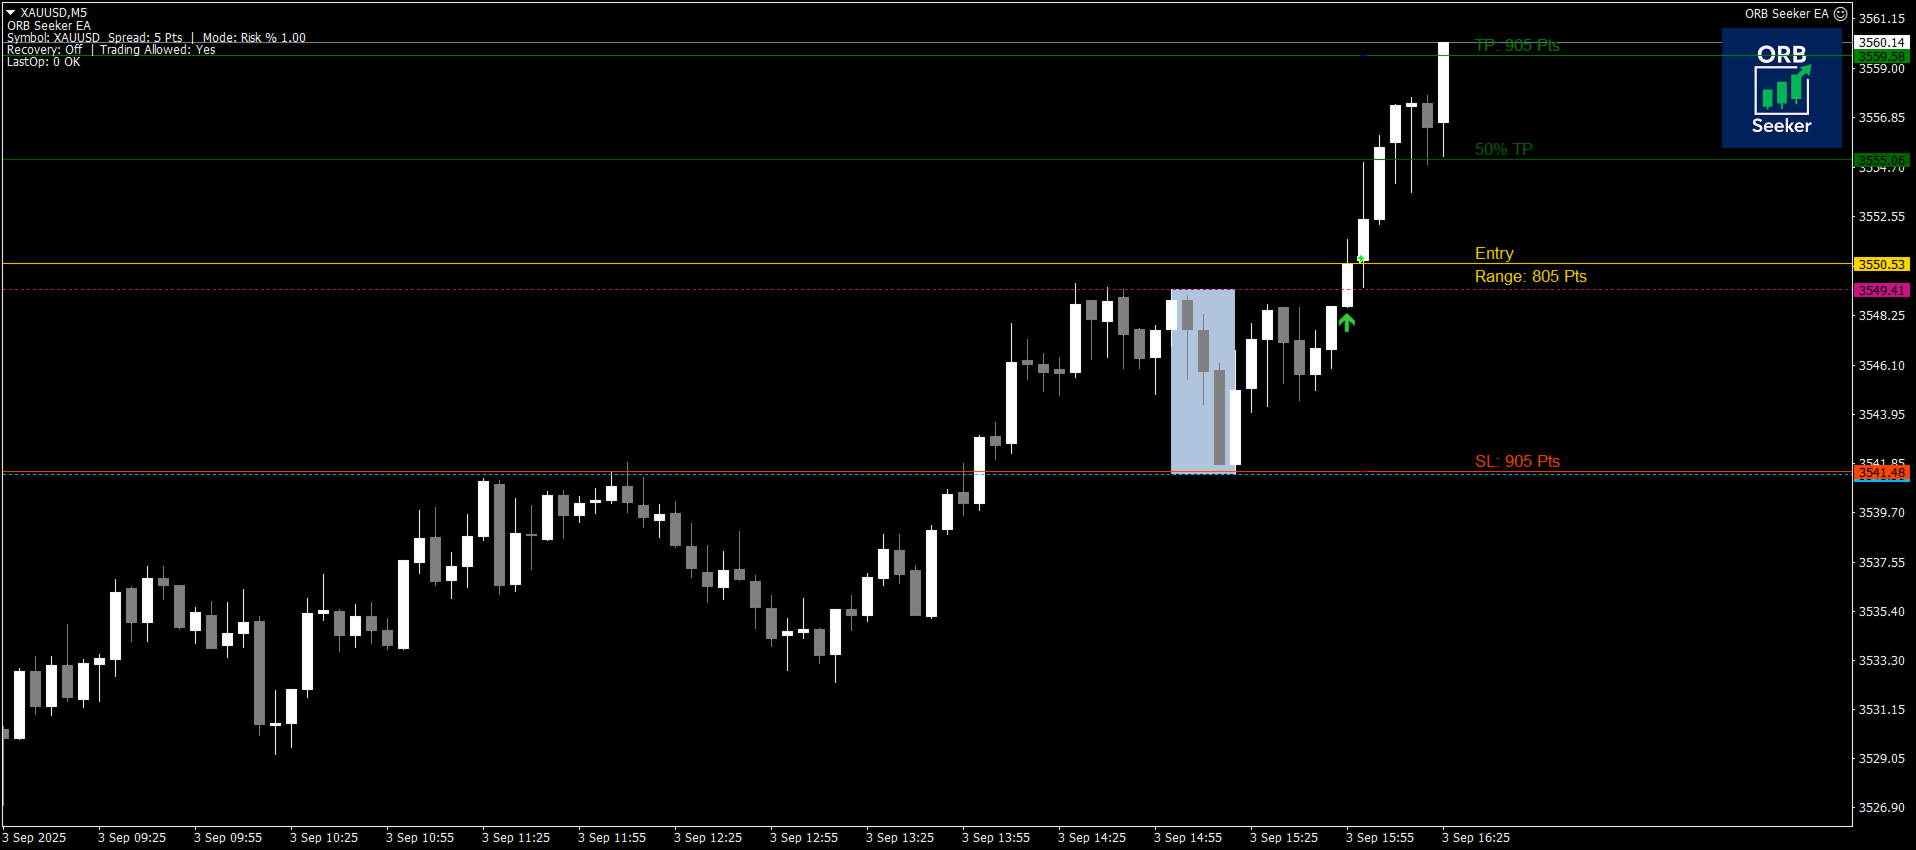
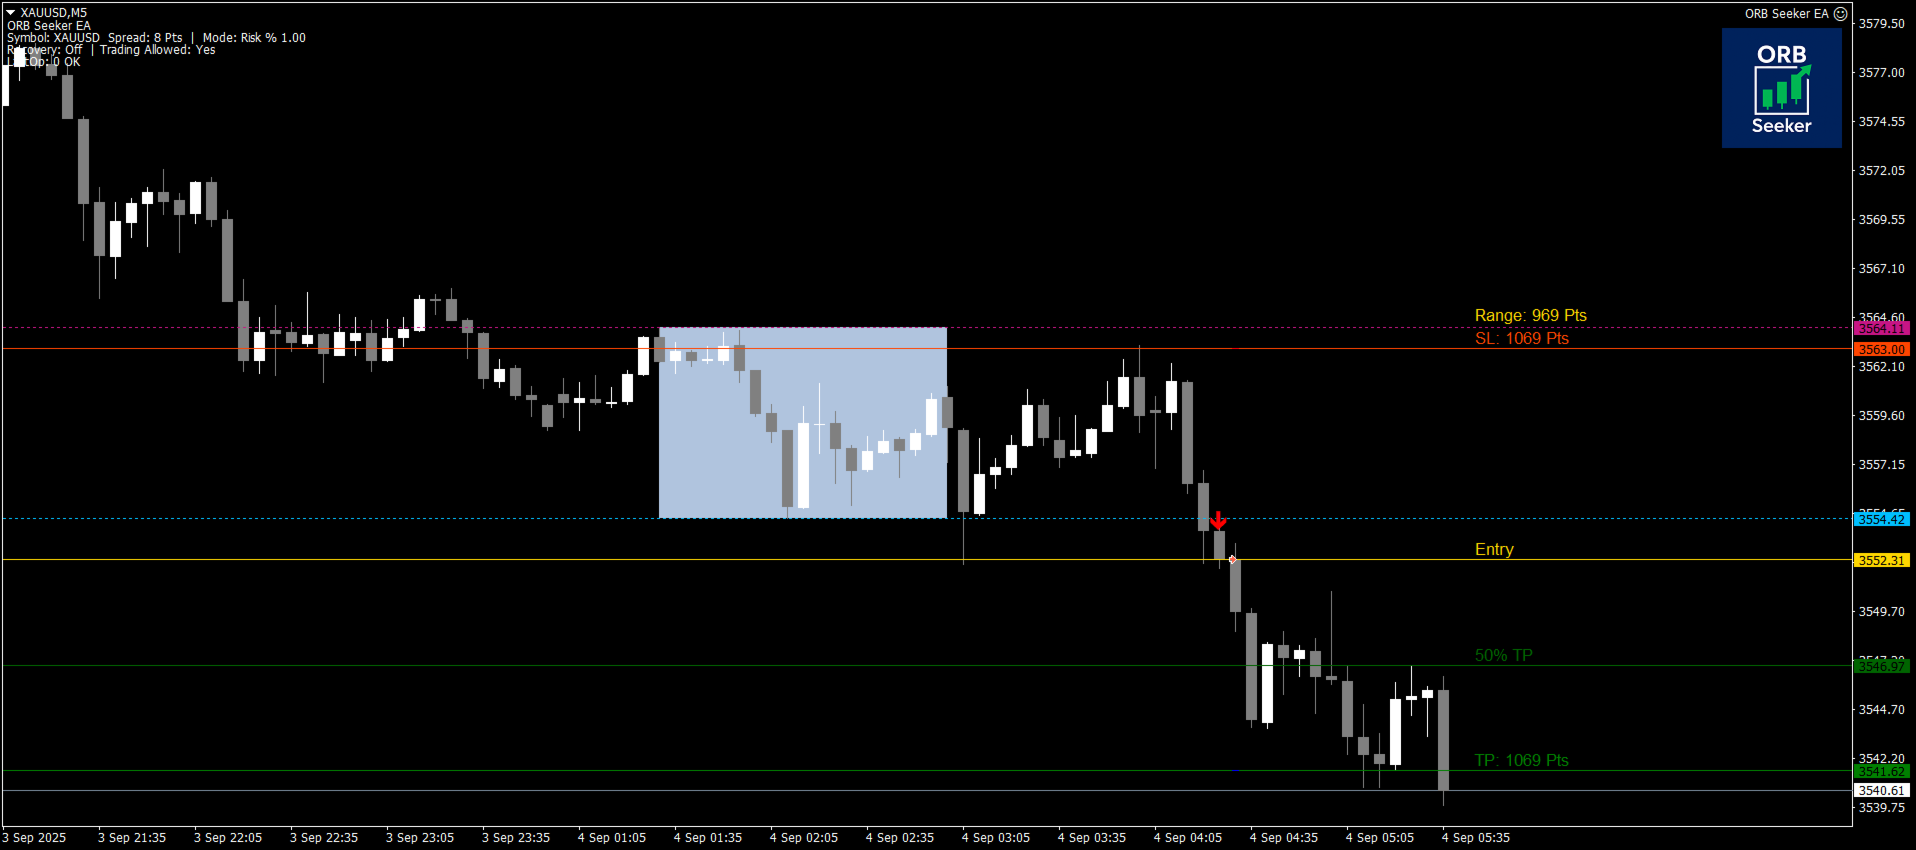
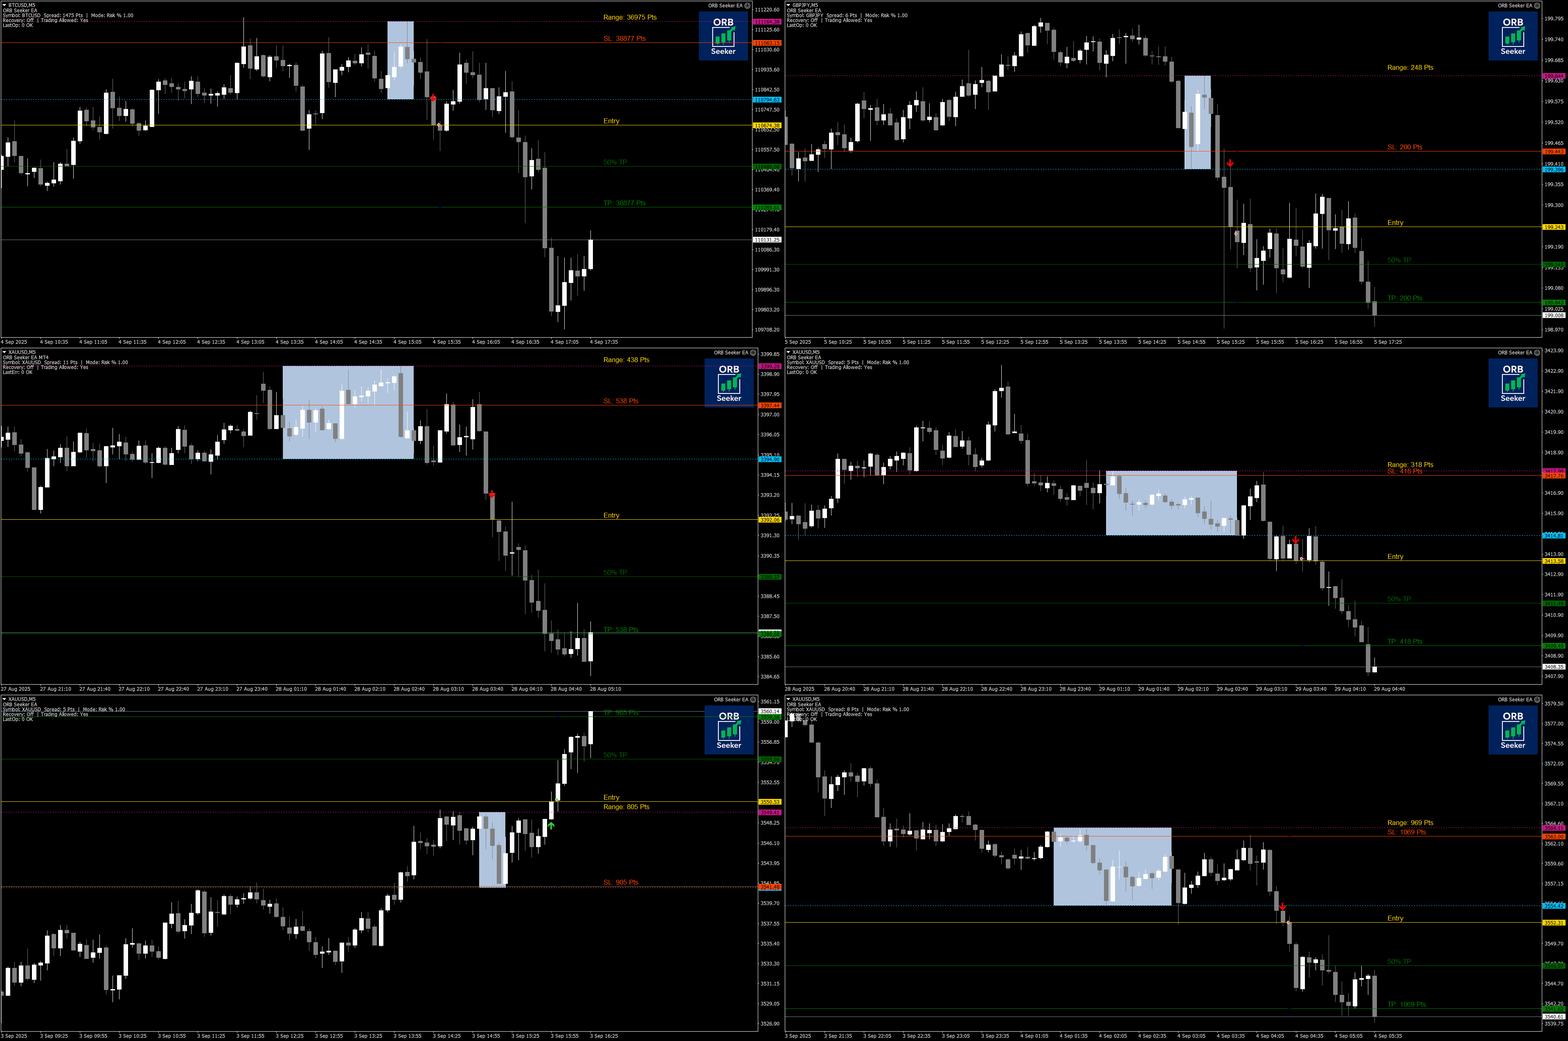
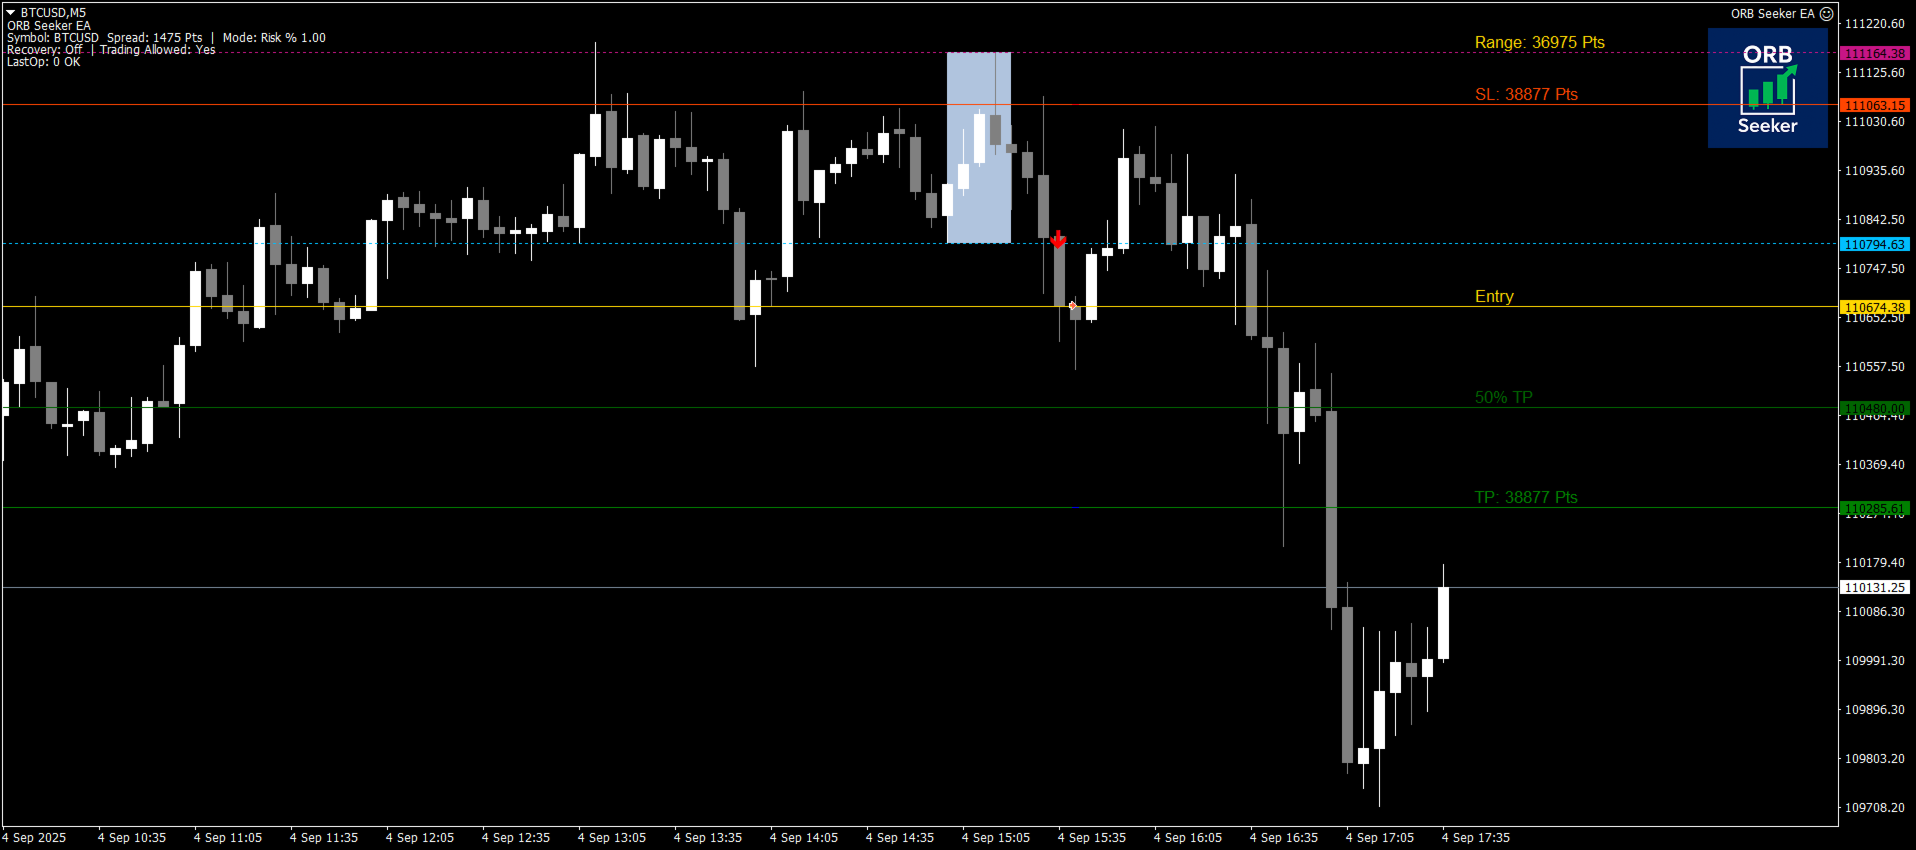
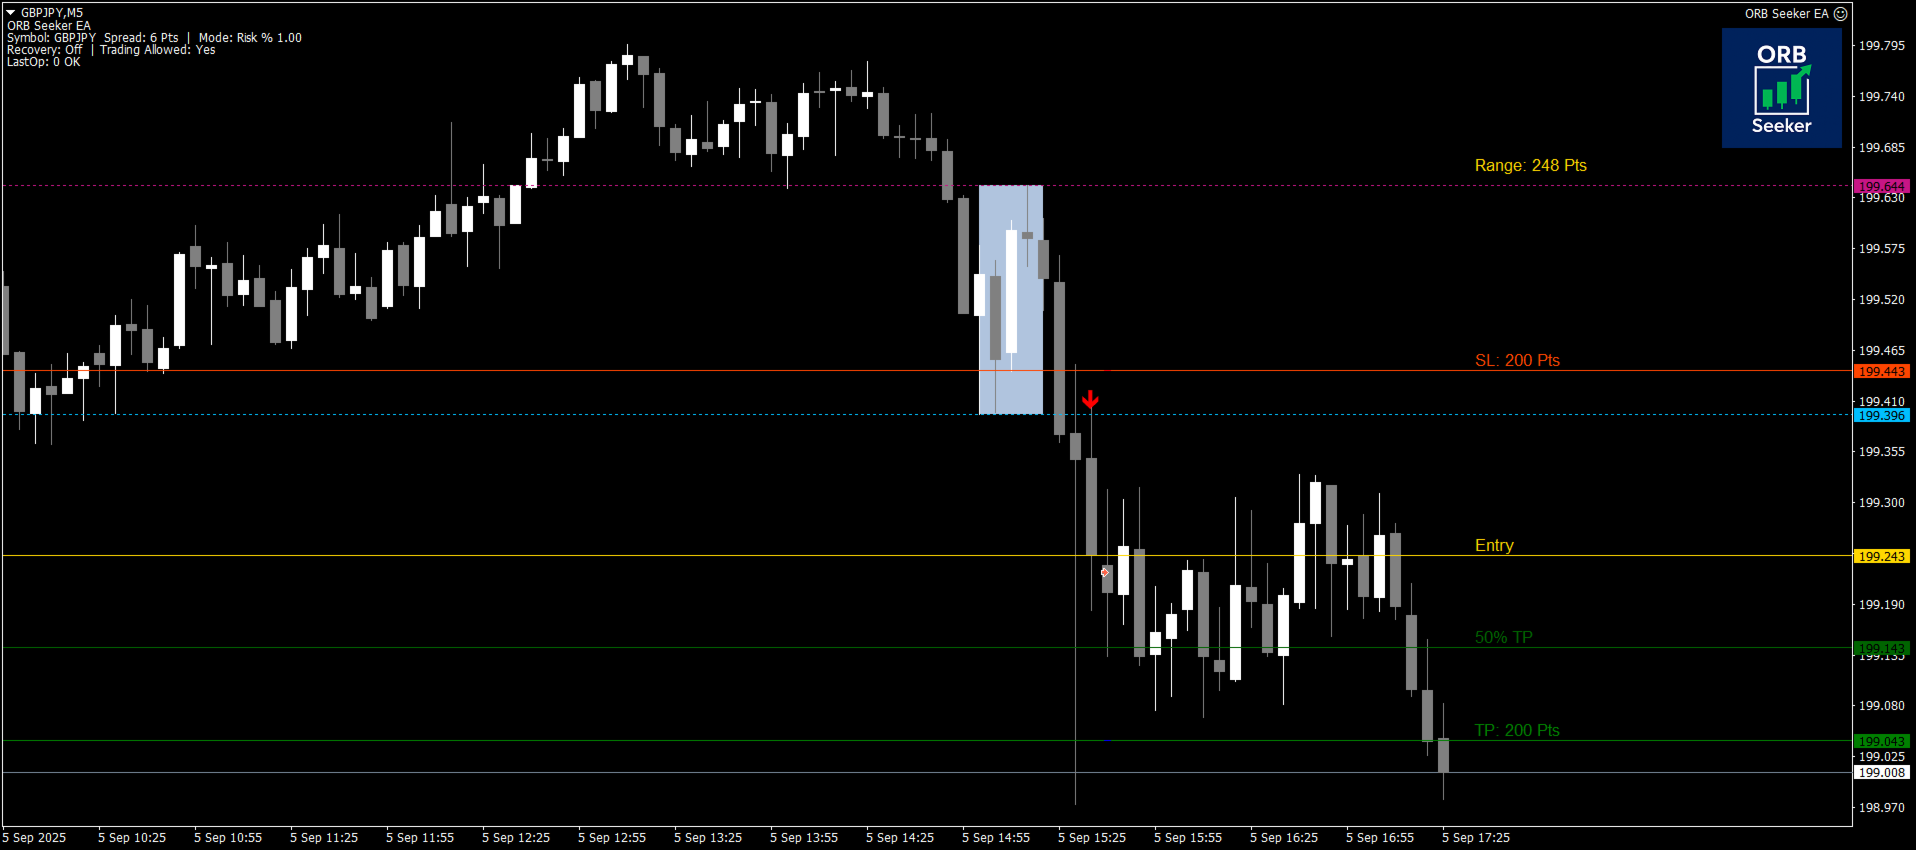
It automatically plots the pre-market or custom session range on any instrument, then gives clear breakout signals with entry, stop loss, take profit, and optional 50% partial TP levels. Everything is calculated and displayed directly on the chart in real time.

Trade the London Open, New York session, Asian session, or your own custom market window. ORB Seeker adapts to the session times you choose, so you can see exactly where the market range is, where the breakout level is, and where the trade levels are placed.

Included FREE as a bonus with every purchase is the ORB Seeker EA. The EA reads the indicator’s breakout signals and can place trades automatically, giving you the choice to trade manually or let the EA handle the entries using the indicator’s signal logic.


Why Choose ORB Seeker

  • Multiple Session Support - Set your own pre-market and session times for London, New York, Asian, or custom trading sessions.
  • Complete Breakout Visuals - Session high and low lines, range box, breakout arrows, entry line, SL/TP labels, and optional 50% TP marker.
  • Two Breakout Modes - Use Breakout on Close for candle confirmation or Breakout on Touch for faster breakout detection.
  • Retest / Pullback Mode - Optional retest logic helps filter re-entry signals by waiting for price to pull back into the range before a new breakout is accepted.
  • Flexible SL/TP Options - Choose fixed SL/TP, ATR-based levels, or classic 1:0.5, 1:1, 1:2, and 1:3 risk/reward targets.
  • Breakout Buffer Control - Add a custom buffer beyond the session high or low to reduce premature breakout signals.
  • Built-In Filters - Use MA trend filter, RSI momentum filter, and VWAP filter for extra trade confirmation.
  • No Repainting - Once a valid breakout signal is triggered, the signal remains fixed on the chart.
  • Smart Chart Handling - Automatic session resets, clean object management, and support for multiple breakout signals per session.
  • Full Alert Suite - Pop-up alerts, push notifications, and email alerts with trade details.
  • Bonus EA Included - Use the included bonus ORB Seeker EA to trade the indicator’s breakout signals automatically.
  • Prop firm safe - Can safely be used for prop firm evaluations, and funded trading accounts.


Recommended Use:

Markets: Forex, commodities, indices, crypto, and stocks.

Timeframes: M1, M5, M15, M30, and H1.


ORB Seeker is designed for traders who want a clean and practical way to trade Opening Range Breakout setups. Use it for manual trade planning, alert-based trading, or automated execution with the included free bonus EA.

If you like trading session opens and breakout setups, ORB Seeker gives you the full ORB structure in one chart tool: range, breakout signal, entry, stop loss, take profit, alerts, and optional automation.

ORB Seeker is also a perfectly suitable trading tool for prop firm evaluations, and funded trading accounts.


Important note

ORB Seeker is a technical analysis tool. It does not guarantee profit, and all trading decisions remain your responsibility. Market conditions, spread, volatility, slippage, and broker execution can affect results.


ORB Seeker is sold only through the official MQL5 Market. If you see it being sold anywhere else, it is not an authorized copy.


Thank you for your support. If you have any questions, ideas, or suggestions for future updates, feel free to contact me. I’m always open to useful feedback from traders who use the tool.
Reviews 1
Gabriele Bozzolan
336
Gabriele Bozzolan 2026.08.22 10:13 

I purchased the indicator in question on August 12, 2026, and installed it on my MT4, as is standard practice. I used the set file given to me by the indicator's owner, along with the free EA—and that's not something everyone gets for free. I want to clarify one thing: I only used the files given to me, never changed anything, and used the default settings. The following day, everything went well. On Friday, two stops in a row—that's understandable. I should point out that the stop losses are double the winnings. On Monday, nothing happened, for some reason. On Tuesday, two stops in a row, and I didn't like it. On Wednesday morning, I found myself with another two stops in a row. At this point, I decided to unplug everything, as I was dissatisfied with the results. Too many stops in a row, in three days. I repeat: I only used the settings given to me. I'm reporting this to the indicator's owner. A series of messages begins with these, in which I reiterate that I used the settings he sent me and that I haven't made any changes. Finally, I say I'll leave a negative review for the indicator. The owner responds: I'm not cooperating, the indicator is profitable, as I told you, I'm using it myself and I'm not losing money, so there's something wrong on your end. What do I have to do with this? As I've said several times, I only used the settings provided to me, as they were. The owner adds: Users never like to admit they're wrong, they always blame the product. It's a shame. I repeat for the umpteenth time: what do I have to do with this? I only used the recommended settings. I reply to the messages the owner of the indicator sent me, confirming that I will leave a negative review and that I will no longer respond to his messages. He responds: You're responding like someone who doesn't want to admit they're at fault, that's fine, it's common human behavior. I know I'm right because the indicator is profitable; even last night I won and had more wins than losses. So why are you losing, while I and my other users are winning? Logic suggests that something is wrong on your end, whether you like it or not. Furthermore, you've only been using the indicator for a week. A week is not enough time to properly evaluate a product, especially if you haven't tested it first on a demo account to familiarize yourself with all its features. To understand if a product really works, you need to give it more time; every professional trader knows this. You're not cooperating, and if you continue to leave a negative review, as you're threatening, I'll simply respond with the truth and publish all the screenshots of this conversation so everyone can see the entire history and understand that your negative statement is false and that I'm not hiding anything. I wish you'd let me help you so you can try the indicator like me and other users, but you don't want to. It doesn't have to be this way; I want all my users to be happy. I'm sorry I tried. I'm replying to this last message I received, published in its entirety. I never threatened anyone; the threats are different. I simply stated what happened to me with the indicator, and nothing more. Feel free to publish all the conversations I had with him; I have nothing to fear. Everyone who reads this review should make their own assessment.

Recommended products
Introduction to Fractal Pattern Scanner Fractal Indicator refers to the technical indicator that makes use of the fractal geometry found in the financial market. Fractal Pattern Scanner is the advanced Fractal Indicator that brings the latest trading technology after the extensive research and development work in the fractal geometry in the financial market. The most important feature in Fractal Pattern Scanner is the ability to measure the turning point probability as well as the trend probabi
Mongol Indicator2
Sumiyabazar Buyanjargal
It's a variation of mid of HH and LL since it compares the higher of HH or LL against a period and twice the number of bars back to avoid whipsaws. I used to display this against lines on a chart, but made a histogram out of it and it looks interesting. It looks good at gauging trend strength and general turns (see image below). The name of the indicator is BAM, which is an acronym for "Below and Above Mid". Ways to use it: 1. To see general trend on longer TFs (more than 30 bars back).
Indicator for binary options arrow is easy to use and does not require configuration works on all currency pairs, cryptocurrencies buy signal blue up arrow sell signal red down arrow tips do not trade during news and 15-30 minutes before their release, as the market is too volatile and there is a lot of noise it is worth entering trades one or two candles from the current period (recommended for 1 candle) timeframe up to m 15 recommended money management fixed lot or fixed percentage of the depo
PTW NON REPAINT TRADING SYSTEM + HISTOGRAM Non-Repainting ,   Non-Redrawing   and   Non-Lagging  Trading System. Does the following: - Gives Accurate Entry and Exit Points - Scalping, Day and Swing Trading  - 95% Accuracy  - Targets, where to take profits. - Shows Trends, Support and resistance levels - Works on All Brokers - Works on All Currencies, CFDs and Stocks - It does not place trades for you, it only shows you what trades to place. - It works on All Timeframes - It is for Trend or ran
Didi Index indicator with visual buy and sell alert, with confirmation alert. Buy or sell alerts, on screen and for mobile phones, with a visual description in colors of the direction on the screen! A warning in the color of the current direction of the graph on the screen quickly informs you if the pair is bought or sold by Didi Index. With configurable text position and size, making it easier to follow the trend of the pair.
FREE
Snake NW
Sergei Shishaev
5 (1)
Канальный индикатор "Snake" . Отлично показывает точки входа и выхода. Не перерисовывает! Хорошо подойдет для стратегий с сетками (усреднения), стратегий с пирамидами (стратегий добора), обычной торговли по тренду, торговли на коррекции. Для любых типов инструментов:   валюты, нефть, металлы, криптовалюты. Для любых таймфреймов:   от M1 до D1 . Для любых стилей торговли:   скальпинг, интрадэй, свинг, долгосрок . Используйте в сочетании с трендовым индикатором, чтобы исключить риски входа про
The Accurate Gold indicator is a user-friendly tool that is both  intuitive and simple to use , regardless of traders' level of experience. It is designed for traders seeking precise signals on the M5 timeframe in the gold market. This indicator employs advanced mathematical algorithms to analyze price movements and volume dynamics, generating accurate buy and sell signals. The distinctive features of this indicator, including its non-repainting nature, provide traders with valuable insights in
Introduction This indicator detects volume spread patterns for buy and sell opportunity. The patterns include demand and supply patterns. You might use each pattern for trading. However, these patterns are best used to detect the demand zone (=accumulation area) and supply zone (=distribution area). Demand pattern indicates generally potential buying opportunity. Supply pattern indicates generally potential selling opportunity. These are the underlying patterns rather than direct price action. T
What is this?  This script not only can help you to place all type of orders, included market order " BUY " / " SELL " and pending order " BUYSTOP " / " BUYLIMIT " / " SELLSTOP " / " SELLLIMIT ", but also, it allow you to place order lots by money management concept. How to use this script? 1. Open the chart you want to trade; 2. Drag and drop the script to that chart; 3. Input the parameter what you want to do; 4. Double check the order information, then click "Yes" to confirm to place order;
FiboZag
Andriy Sydoruk
Indicator FiboZag - transfer the indicator to the chart and the Fibonacci levels will be built automatically on the last ZigZag turn. The main advantage lies in the correct construction of Fibonacci levels and markup of price levels. Simple, visual and effective use. The indicator is not redrawn and does not lag. Works on all currency pairs and on all timeframes.
Intuitive Trading on Higher Time Frames Streamline your trading strategy with the Target Trend V2 Indicator. Specifically designed for use on higher time frames, this tool specializes in immediately identifying the underlying market trend, allowing you to make decisions with absolute clarity. Our core philosophy emphasizes consistency and discipline : simply follow the signal to capture the directional move and achieve your daily profit target, often closing the trade after the action of just a
Market Projection Pro — MT4 Want to visualize how the price cycles in your chosen chart section could extend? Market Projection Pro analyzes a historical window you select, extracts cycle components and draws a composite projection to its right. You control the source window and forward horizon to compare the scenario with price structure and potential turning zones. What you see on the chart Interactive boundaries let you select a historical analysis window directly on the chart. Cycle componen
IQ Signals
Eadvisors Software Inc.
The best indicator for Binary Options is now available at the MQLMarket, this version is already configured and optimized to operate with Binary Options, Forex and Cryptocurrencies. It is composed of a momentum algorithm that looks for better opportunities in the market, bringing you the best points to open your positions with low risk and high proportion of gain. The MQL version can also be incorporated into the MT2 signal automator.     Product features Common signals (Oscillator) Super
Smart Pivot Points for MetaTrader 4 — Clear Levels for Smart Trading Smart Pivot Points is a professional indicator for MetaTrader 4 that automatically calculates and displays a full set of key trading levels on the chart. It transforms the chaos of price action into a clear structured map, highlighting support, resistance, price balance, and potential target zones. Designed for traders who value clarity, the tool works in any market: Forex, cryptocurrencies (Bitcoin, Ethereum), stock indices,
Market Session PRO MT4 – Smart Session Visualization Boxes Market Session PRO MT4 is a powerful and lightweight indicator designed to help traders clearly visualize the major forex trading sessions directly on your charts. This tool automatically highlights the Tokyo, London, and New York sessions, allowing you to better understand market behavior, volatility, and key trading opportunities. Key Features: Automatic Session Detection Accurately plots Tokyo, London, and New York sessions using au
FREE
Gold BB PRO
Vojtech Svobodnik
1 (1)
Gold BB PRO is a professional version of Gold BB FREE, which uses a portfolio of strategies based on Bollinger Bands . Gold BB PRO was developed for XAUUSD . This Expert Advisor has been tested from year 2006 to 2021 .  Doesn't use Martingale or other dangerous strategies. Backtest, which you can see bellow in screenshots section, used the real tick data with 99,90% accuracy. With this strategy one can trade using fixed lots  or using a risked percentage of the balance . Recommendations Symbol
In the fast-paced world of financial markets, every second counts, and every decision can make or break a trade. Enter the Binary Hacker Indicator – a groundbreaking tool that is set to transform the way traders analyze price movements, one minute at a time. Unveiling Precision in Trading: The Binary Hacker Indicator is not your ordinary trading tool. It functions as a real-time analyzer, dissecting each minute on the chart to provide traders with invaluable insights. Unlike traditional indicato

**Introducing the Binary Smart System: Your Ultimate Trading Companion** The Binary Smart System is not just an indicator; it's a sophisticated trading tool meticulously designed to empower traders with pinpoint accuracy and timely signals across various markets. Built on a foundation of cutting-edge algorithms and an exhaustive collection of technical indicators, this system is your key to unlocking trading success. **Indicator Components:** 1. **Moving Average Percentage (MAP):** This comp
Neuro Poseidon MT4
Daria Rezueva
4.74 (46)
Neuro Poseidon is a new indicator by Daria Rezueva. It combines precise trading signals with adaptive TP/SL levels - creating best possible trades as a result! Message me and get  Neuro Poseidon Assistant  as a gift to automize your trading process! What makes it stand out? 1. Proven profitability on all assets and timeframes 2. Only confirmed BUY and SELL signals present on the chart 3. Adaptive TP & SL levels generated by the software for each trade 4. Easy to understand - suitable for all
Mystic Arrow
Svyatoslav Kucher
5 (4)
Mystic Arrow - уникальный авторский индикатор, отображающий сигналы в направлении основной тенденции, и против нее. Благодаря разнообразию настроек и фильтров индикатор можно настроить под свой стиль торговли. Mystic Arrow  подходит для любого таймфрейма, валютной пары. Сигналы индикатора не пропадают ни при каких условиях. Отличительной особенностью является возможность настроить сигналы индикатора отдельно для тенденции и против нее. Имеет в качестве отключаемого фильтра показания ценового кан
Scalping dynamic system - a dynamic system for determining price reversals. The indicator looks for price reversal points on the chart and puts arrows in these places. When the indicator draws a blue arrow, there is a high probability that the price will reverse up. When the indicator draws a red arrow, there is a high probability that the price will reverse down. The use of this indicator in the trading process is very simple. In the video below the description, we will show in detail how to t
Boba Binary
Anthonius Soruh
5 (1)
Result look on  https://t.me/BonosuProBinary Pair : All Forex Pairs Time Frame : M1 Expaired : 1-2 Minutes Trade Time Once Time a Day Backtester, Alert Avaliable Average Signals Generate 5 - 20 Signals All Pair A Day Broker Time Zone GMT+3 Default Setting [Example Broker GMT+3 : Alpari, FBS, XM] Support Broker : Deriv, IQOption, Alpari, Binomo, Olymtrade, Qoutex, GCoption, etc Support Auto Trading : MT2 Trading, Binary Bot, Intrade Bot, Binomo Bot, Olymptrad Bot, MX2 trading, Price Pro, etc Ind
Cota Binary
Anthonius Soruh
5 (2)
Result look on  https://t.me/BonosuProBinary Pair : All Forex Pairs Time Frame : M1 Expaired : 1-2 Minutes Trade Time Once Time a Day Backtester, Alert Avaliable Average Signals Generate 5 - 20 Signals All Pair A Day Broker Time Zone GMT+3 Default Setting [Example Broker GMT+3 : Alpari, FBS, XM] Support Broker : Deriv, IQOption, Alpari, Binomo, Olymtrade, Qoutex, GCoption, etc Support Auto Trading : MT2 Trading, Binary Bot, Intrade Bot, Binomo Bot, Olymptrad Bot, MX2 trading, Price Pro, etc Ind
PLEASE NOTE:   You can  customize the settings of all 3 EMA as per your requirement. The accuracy will change as per your settings. 100% Non repaint Pre-alert (get ready) signals Non-delay indications 24/7 signals 100% No lag No recalculating Lifetime license This is a EMA crossover indicator and its 100% non repaint indicator. The EMA_1 and the EMA_2 is based on which signal is generated. EMA_3 is a Higher EMA value which will remain below or above the candle (market) to identify the trend. Me
Key Zone Detector Key Level Supply & Demand Zone Detector   Overview A sophisticated supply and demand zone detection indicator that identifies and rates key price levels where significant market activity occurs. The indicator uses fractal analysis and multiple validation methods to detect and classify trading zones. Key Features Zone Detection Auto-detects support and resistance zones Uses dual fractal system (fast and slow) for confirmation Dynamic zone thickness based on ATR (Average True Ran
MoveWave
Andriy Sydoruk
MoveWave - Moving waves are very handy indicators for determining pivot levels. Most Forex traders make decisions based on technical analysis. This type of analysis determines patterns and trends in the market. With the help of complex mathematical equations that are combined and made out in the form of this indicator, the trader will be able to more accurately determine the price reversal levels. Wave theory mathematically represents various behavioral models of the market. It is used as the ba
BinaryMartini
Abdulkarim Karazon
an indicator for binary trading based on 3ma cross with macd , it gives buy and sell signals on bar open and it Doesn't Repaint or Back paint the indicator is not focused on high win rate as it is made for martingale trading , the indicator focus on lowest losing signal count in a row. Strategy : Minimum Deposit is 1000 unite , we start the trading with 1 unite (trade size is 1 unite for every 1000 capital) we double trade size on next signal if current signal lost , we only take indicator sett
Robot Choppiness
Diego Mauricio Padilla Mendez
3 (2)
The Choppines robot is loaded as an indicator in the MT4 indicators folder It is recommended to use a candle timing of 5 minutes, the recommended robot expiration time is 5 minutes. The robot can be configured to send signals to MT2, MX2, PRICEPRO platforms. To send signals, you must use the connector program of the platform we want to work with. To install on the connector, perform the following procedure (an image is attached describing the configuration with the MT2 platform connector): 
Multi Level Trend Direction
Filip Maurice Daelman
1 (1)
Multi Level Trend Direction is an indicator that identifies the most accurate buy/sell swing points with the highest probability, based on multi-level Zig Zag Swings. The indicator draws a color Zig Zag at the Higher Highs, Higher Lows, Lower Lows and Higher Lows in the chart, but based on two level Zig Zag Swing. If the fast price swing is in line with the trend of the slow price swing, then the buy/sell trend lines are bigger. If the price swing is against the trend, no lines are drawn to si
Over Arrow
Svyatoslav Kucher
Over Arrow  - уникальный авторский индикатор, имеющий возможность отображения сигналов в направлении основной тенденции, или против нее. Over Arrow  подходит для любого таймфрейма, валютной пары, но лучше всего использовать его на средних временных периодах, таких как М30, Н1, Н4. Сигналы индикатора не пропадают ни при каких условиях. Отличительной особенностью является наличие фильтра тенденции, при активации которого, сигналы будут появляться только в направлении основного движения. Параметры
Buyers of this product also purchase
Miraculous Indicator Binary & Forex v3 StrategySafe Miraculous Indicator Binary & Forex v3 StrategySafe is a professional trading indicator designed for traders who want clear signals, powerful confirmation tools, and a structured way to analyze both Binary and Forex markets. This version brings a stronger trading experience with advanced dashboards, GANN Law analysis, Square of 9 levels, angle confirmation, and a clean StrategySafe approach that helps traders filter stronger setups instead of e
TrendMaestro
Stefano Frisetti
4 (4)
Attention: beware of SCAMS, TRENDMAESTRO is only ditributed throught MQL5.com market place. note: this indicator is for METATRADER4, if you want the version for METATRADER5 this is the link:  https://www.mql5.com/it/market/product/108106 TRENDMAESTRO ver 2.5 TRENDMAESTRO recognizes a new TREND from the start, he never makes mistakes. The certainty of identifying a new TREND is priceless. DESCRIPTION TRENDMAESTRO identifies a new TREND in the bud, this indicator examines the volatility, volumes a
FFx Engulfing Setup Alerter gives trade suggestions with Entry, Target 1, Target 2 and StopLoss. Below are the different options available: Entry suggestion - pips to be added over the break for the entry 3 different options to calculate the SL - by pips, by ATR multiplier or at the pattern High/Low 3 different options to calculate the 2 TPs - by pips, by ATR multiplier or at Risk/Reward Offset the dashboard - any place on the chart Remove the suggestion once the price reached the SL line Lines
FFx InsideBar Setup Alerter gives trade suggestions with Entry, Target 1, Target 2 and StopLoss. Below are the different options available: Entry suggestion - pips to be added over the break for the entry Minimum candle size - to avoid too close buy/sell entry suggestions 3 different options to calculate the SL - by pips, by ATR multiplier or at the pattern High/Low 3 different options to calculate the 2 TPs - by pips, by ATR multiplier or at Risk/Reward Offset the dashboard - any place on the c
FFx OutsideBar Setup Alerter gives trade suggestions with Entry, Target 1, Target 2 and StopLoss. Below are the different options available: Entry suggestion - pips to be added over the break for the entry. 3 different options to calculate the SL - by pips, by ATR multiplier or at the pattern High/Low. 3 different options to calculate the 2 TPs - by pips, by ATR multiplier or at Risk/Reward. Offset the dashboard - any place on the chart. Remove the suggestion once the price reached the SL line.
FFx PinBar Setup Alerter gives trade suggestions with Entry, Target 1, Target 2 and StopLoss. Below are the different options available: Entry suggestion - pips to be added over the break for the entry Minimum candle size - to avoid too small candles 3 different options to calculate the SL - by pips, by ATR multiplier or at the pattern High/Low 3 different options to calculate the 2 TPs - by pips, by ATR multiplier or at Risk/Reward Offset the dashboard - any place on the chart Remove the sugges
Automatic, live & interactive picture of all trendlines. Assign push, email and sound alerts to the lines of your choice and be informed about price rollback, breakout, rollback after breakout, number of rollbacks, line expiration by double breakout. Correct, drag or delete the lines and interactively tune the line system. https://youtu.be/EJUo9pYiHFA . Chart examples https: //www.mql5.com/en/users/efficientforex Price Interaction Events All events are effective immediately and only after one
The purpose of this new version of the MT4 standard indicator provided in your platform is to display in a sub-window multiple timeframes of the same indicator with its divergences. See the example shown in the picture below. But the display isn't like a simple MTF indicator. This is the real display of the indicator on its timeframe. Here's the options available in the FFx divergences indicator: Select the timeframes to be displayed (M1 to Monthly) Define the width (number of bars) for each tim
The purpose of this new version of the MT4 standard indicator provided in your platform is to display in a sub-window multiple timeframes of the same indicator with its divergences. See the example shown in the picture below. But the display isn't like a simple MTF indicator. This is the real display of the indicator on its timeframe. Here's the options available in the FFx divergences indicator: Select the timeframes to be displayed (M1 to Monthly). Define the width (number of bars) for each ti
The FFx Dashboard MTF alerter will show you on a single chart all the timeframes (M1 to Monthly) with their own status for the indicator. 2 Alert Options: Single timeframe: each selected timeframe alert separately when a signal occurs Multi timeframes: all selected timeframes must agree for an alert to be triggered Both options have an input to select the timeframes to be used for the alert(s). How to Understand the Status: Green/Red square: histogram above/below 0 line Green square + Red bord
The FFx Dashboard MTF alerter will show you on a single chart all the timeframes (M1 to Monthly) with their own status for the indicator. 2 Alert Options: Single timeframe: each selected timeframe alert separately when a signal occurs Multi timeframes: all selected timeframes must agree for an alert to be triggered Both options have an input to select the timeframes to be used for the alert(s). How to understand the status: Green/Red square: RSI above/below 50 line Green square + Red border: R
The FFx Dashboard MTF alerter will show you on a single chart all the timeframes (M1 to Monthly) with their own status for the indicator. 2 Alert Options: Single timeframe: each selected timeframe alert separately when a signal occurs Multi timeframes: all selected timeframes must agree for an alert to be triggered Both options have an input to select the timeframes to be used for the alert(s). How to understand the status: Green/Red square: Stoch above/below 50 line Green square + Red border:
The FFx Dashboard MTF alerter will show you on a single chart all the timeframes (M1 to Monthly) with their own status for the indicator. 2 Alert Options: Single timeframe: each selected timeframe alert separately when a signal occurs Multi timeframes: all selected timeframes must agree for an alert to be triggered Both options have an input to select the timeframes to be used for the alert(s). How to understand the status: Green/Red square: Price above/below Cloud (Kumo) Green square + Red bo
The FFx Dashboard MTF alerter will show you on a single chart all the timeframes (M1 to Monthly) with their own status for the indicator. 2 Alert Options: Single timeframe: each selected timeframe alert separately when a signal occurs Multi timeframes: all selected timeframes must agree for an alert to be triggered Both options have an input to select the timeframes to be used for the alert(s). How to understand the status: Green/Red square: MA pointing Up/Down Green square + Red border: MA po
The FFx Dashboard MTF alerter will show you on a single chart all the timeframes (M1 to Monthly) with their own status for the indicator. 2 Alert Options: Single timeframe: each selected timeframe alert separately when a signal occurs. Multi timeframes: all selected timeframes must agree for an alert to be triggered. Both options have an input to select the timeframes to be used for the alert(s). How to understand the status: Green square: Price above PSAR Red square: Price below PSAR Options
The FFx Dashboard MTF alerter will show you on a single chart all the timeframes (M1 to Monthly) with their own status for the indicator. 2 Alert Options: Single timeframe: each selected timeframe alert separately when a signal occurs Multi timeframes: all selected timeframes must agree for an alert to be triggered Both options have an input to select the timeframes to be used for the alert(s). How to understand the status: Green/Red square: CCI above/below levels (ie. 100/-100) Grey square: C
The FFx Dashboard MTF alerter will show you on a single chart all the timeframes (M1 to Monthly) with their own status for the indicator. 2 Alert Options: Single timeframe: each selected timeframe alert separately when a signal occurs Multi timeframes: all selected timeframes must agree for an alert to be triggered Both options have an input to select the timeframes to be used for the alert(s). How to understand the status: Green/Red square: ADX above level Grey square: ADX below level Red bor
The FFx Dashboard MTF alerter will show you on a single chart all the timeframes (M1 to Monthly) with their own status. 2 Alert Options: Single timeframe: each selected timeframe alert separately when a signal occurs Multi timeframes: all selected timeframes must agree for an alert to be triggered Both options have an input to select the timeframes to be used for the alert(s). How to understand the status: Green/Red square: bullish/bearish candle Options available in the FFx Dashboard Alerter
The [GRAFF] III manual trading system is based on multiple MetaTrader (MT4) indicators. Together, the entire PACK of GRAFF III indicators makes an advanced trading tool. The system consists of over 20 different custom-built indicators which have been carefully selected and tested in the long term to produce strong and efficient trading signals. The particular indicators are based on different mathematical formulas, so the entire system is calibrated to remove false signals from its own indicator

FFx Universal Strength Meter PRO is more than a basic strength meter. Instead of limiting the calculation to price, it can be based on any of the 19 integrated strength modes + 9 timeframes. With the FFx USM, you are able to define any period for any combination of timeframes. For example, you can set the dashboard for the last 10 candles for M15-H1-H4… Full flexibility! Very easy to interpret... It gives a great idea about which currency is weak and which is strong, so you can find the best pai
A simplistic indicator informing a user on RSI divergence by sending messages to mobile device and email. The indicator draws 2 vertical lines, marking two RSI extrema that formed the divergence. You get the alert, open the charts and make a decision. The indicator does not show past divergences, thus when you attach it to a chart for the first time you see nothing. Graphics and alerts will appear as soon as divergences do. Drop it in Tester to see how it works. Parameters: RSIPeriod - number of


Pan PrizMA CD Phase is an analogue of the МetaТrader 5 indicator , and is an option based on the Pan PrizMA indicator. Details . Averaging by a quadric-quartic polynomial increases the smoothness of lines, adds momentum and rhythm. Extrapolation by the sinusoid function near a constant allows adjusting the delay or lead of signals. The value of the phase - wave status parameter (which is close in meaning to the trigonometric phase or the angle of the radius-vector rotation in the trigonometric p
Green Wall Arrows
Daniel Luchinger
1 (1)
The Name Green Wall : Arrows hits a lot of TP, by changing the idea of non using SL as something bad, but instead use Small TP and a lot of free Margin and Patience. Use micro TP and a lot of Free Margin with this indicator on Forex. It also can be used with Binary Options. This strategy is intended to be traded Manually. This Indicator runs on Open Bar, arrows will delete when price are against it. The only Indicator Parameter is Alerts true/false, all the rest is included inside the code. Arro
Golden Monowave
Ahmed Mohamed Ali
Golden Monowave is monowave indicator, the monowave theory is one of Elliott wave approach and one of most complicate and accurate method. Golden Monowave can shortcut many major steps to identify and describe the monowave. It works on any timeframe and with any trading instrument, including currencies, indices, futures, etc. Input Parameters initial_Bars - set the initial number of bars to calculate. wave_color - select the color of the wave. label_color - select the color of labels. temp_labe
Ticks Size
Viktor Kolmakov
This indicator displays in a separate window the difference between the number of points which increased the price, and the number of points that decreased the price during the time interval specified in the settings. The time interval for calculation is expressed as the number of bars of the chart the indicator is attached to. This approach allows you to evaluate the movement direction (growth or fall) of the instrument's price, the strength of the movement and the size of the movement in point
FFx Basket Scanner
Eric Venturi-Bloxs
MetaTrader 5 version available here : https://www.mql5.com/en/market/product/24882 FFx Basket Scanner is a global tool scanning all pairs and all timeframes over up to five indicators among the 16 available. You will clearly see which currencies to avoid trading and which ones to focus on. Once a currency goes into an extreme zone (e.g. 20/80%), you can trade the whole basket with great confidence. Another way to use it is to look at two currencies (weak vs strong) to find the best single pairs
NostradamusMT4
Andrey Spiridonov
1 (1)
NostradamusMT4 is a powerful indicator from the set of professional trader. The indicator is based on Andrei Spiridonov's original price calculation method (ESTIMATED PRICE) for the current candle price. Advantages The indicator does not redraw. It works on any timeframes. Works with any trading instruments. Perfectly suitable for scalping and trading binary options. Parameters Color - color of the ESTIMATED PRICE FUTURE line. How to work with the indicator The indicator forms the ESTIMATED P
More from author
ORB Seeker MT5
Marcela Goncalves De Oliveira
Special price to limit availability and maintain scarcity of the product!  Only $599! After purchase contact me to get the bonus ORB Seeker EA and personal optimized set files. Catch clean session breakouts with confidence! ORB Seeker MT5 is a professional Opening Range Breakout (ORB) indicator built for traders who want accuracy, simplicity, flexibility, and clear chart structure. It automatically plots the pre-market or custom session range on any instrument, then gives clear breakout signal
Filter:
Gabriele Bozzolan
336
Gabriele Bozzolan 2026.08.22 10:13 

I purchased the indicator in question on August 12, 2026, and installed it on my MT4, as is standard practice. I used the set file given to me by the indicator's owner, along with the free EA—and that's not something everyone gets for free. I want to clarify one thing: I only used the files given to me, never changed anything, and used the default settings. The following day, everything went well. On Friday, two stops in a row—that's understandable. I should point out that the stop losses are double the winnings. On Monday, nothing happened, for some reason. On Tuesday, two stops in a row, and I didn't like it. On Wednesday morning, I found myself with another two stops in a row. At this point, I decided to unplug everything, as I was dissatisfied with the results. Too many stops in a row, in three days. I repeat: I only used the settings given to me. I'm reporting this to the indicator's owner. A series of messages begins with these, in which I reiterate that I used the settings he sent me and that I haven't made any changes. Finally, I say I'll leave a negative review for the indicator. The owner responds: I'm not cooperating, the indicator is profitable, as I told you, I'm using it myself and I'm not losing money, so there's something wrong on your end. What do I have to do with this? As I've said several times, I only used the settings provided to me, as they were. The owner adds: Users never like to admit they're wrong, they always blame the product. It's a shame. I repeat for the umpteenth time: what do I have to do with this? I only used the recommended settings. I reply to the messages the owner of the indicator sent me, confirming that I will leave a negative review and that I will no longer respond to his messages. He responds: You're responding like someone who doesn't want to admit they're at fault, that's fine, it's common human behavior. I know I'm right because the indicator is profitable; even last night I won and had more wins than losses. So why are you losing, while I and my other users are winning? Logic suggests that something is wrong on your end, whether you like it or not. Furthermore, you've only been using the indicator for a week. A week is not enough time to properly evaluate a product, especially if you haven't tested it first on a demo account to familiarize yourself with all its features. To understand if a product really works, you need to give it more time; every professional trader knows this. You're not cooperating, and if you continue to leave a negative review, as you're threatening, I'll simply respond with the truth and publish all the screenshots of this conversation so everyone can see the entire history and understand that your negative statement is false and that I'm not hiding anything. I wish you'd let me help you so you can try the indicator like me and other users, but you don't want to. It doesn't have to be this way; I want all my users to be happy. I'm sorry I tried. I'm replying to this last message I received, published in its entirety. I never threatened anyone; the threats are different. I simply stated what happened to me with the indicator, and nothing more. Feel free to publish all the conversations I had with him; I have nothing to fear. Everyone who reads this review should make their own assessment.

Marcela Goncalves De Oliveira
504
Reply from developer Marcela Goncalves De Oliveira 2026.08.24 18:49
I'm going to repeat a few things that I told you in our chat for you to understand, again. What I said is true; I don't understand how you could have lost when the other users and I did not. Clearly there is something wrong on your side. Furthermore, like I said, you had only been using the indicator for a week. One week is not enough time to properly evaluate a product, especially if you haven't tested it first on a demo account to familiarize yourself with all its features. To understand if a product really works, you need to give it more time. I attempted to assist you multiple times, but you were uninterested in receiving help; after a few days, you simply gave up and made your decision. You expected instant perfect results, which does not exist. I've said before that the indicator can lose sometimes; such a result is perfectly normal. Your expectations are not. I'm sorry that you have closed your mind to receiving any help so you can use the indicator successfully and make profit like the rest of us are doing. Good luck.
Reply to review