Extract Candle Power

5

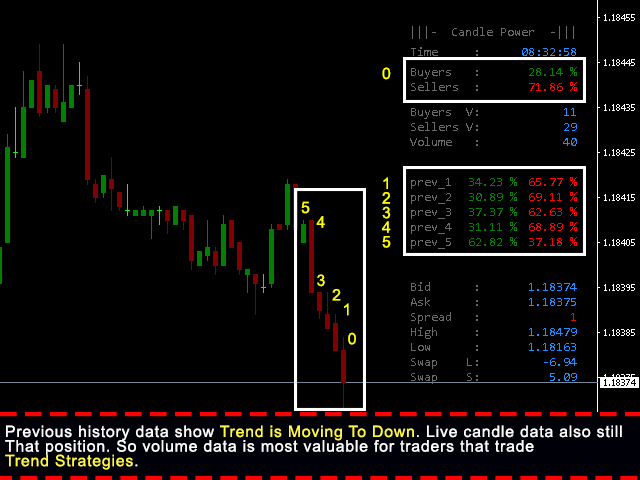
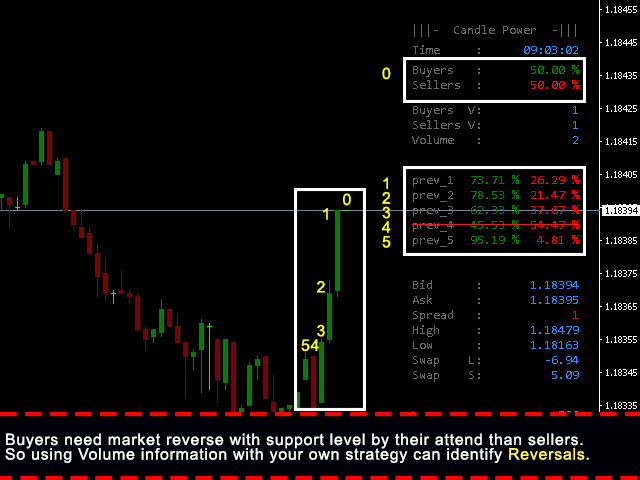
Extract Candle Power is a real time volume extractor indicator that provides valuable insights into the behavior of sellers and buyers during each candle. By analyzing the volume data, traders can make more informed decisions about market trends and potential reversals, surpassing the capabilities of traditional Moving Average indicators.

This powerful tool allows you to extract and analyze the sellers and buyers volume of the current candle, as well as compare it with the volume of previous candles. This information is crucial in understanding the current positioning of traders in the market. Additionally, you can easily identify potential reversal points by comparing the live candle's volume with the Moving Average.

The Extract Candle Power indicator is highly versatile, working effectively with all time frames and any currency pair. It provides accurate insights and can be especially valuable when used in higher time frames. Whether you have a specific trading strategy or prefer to adapt to different time frames, this indicator can be tailored to suit your needs.

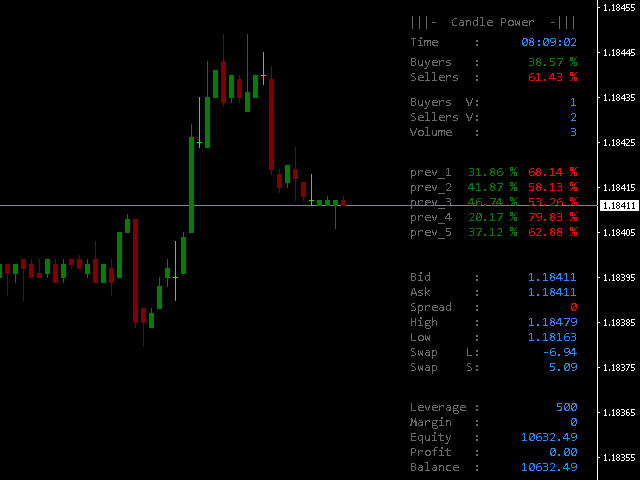
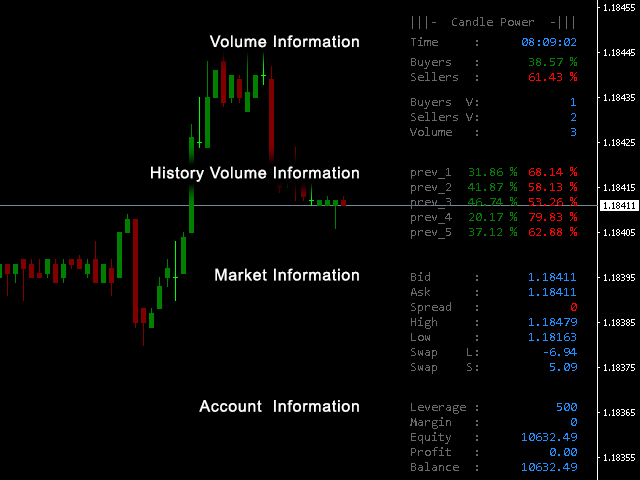
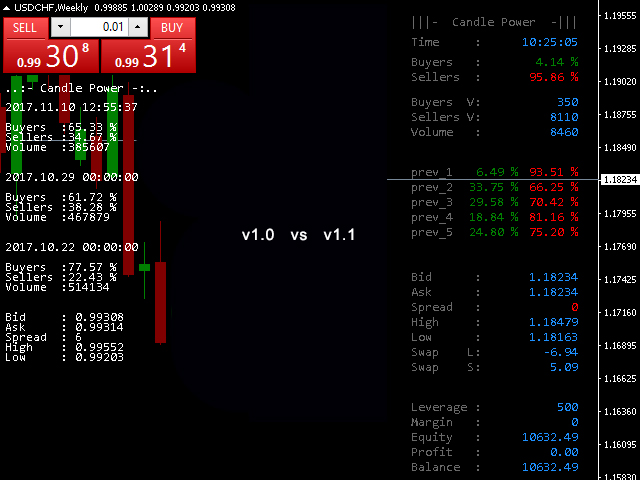
The indicator also offers a range of additional information and parameters that enhance your trading experience. You can access details such as your broker's server time, volume percentages of buyers and sellers, candle volume, bid and ask prices, spread, high and low day prices, swap rates, leverage, margin, equity, profit, and balance.

With customizable display parameters, including color choices, font selection, and sizing options, you can personalize the indicator's appearance to suit your preferences. The information panel provides a clear and organized display of relevant data, making it easy to interpret and analyze.

Furthermore, Extract Candle Power offers the convenience of real time alerts through mobile, email, and pop-up notifications. This ensures that you stay informed about critical trading events and opportunities, allowing you to make timely decisions.

In summary, Extract Candle Power is a powerful volume extractor indicator that provides real time insights into sellers' and buyers' behavior during each candle. Its versatility, customizable parameters, and comprehensive display of information make it a valuable tool for traders seeking accurate trend analysis and enhanced decision making capabilities.


    Parameters

    • Past Volume Data Display Parameters - Customize Volume data visual appearance and colors.
    • Information Panel Display Parameters - Customize Information data visual appearance and colors.
    • Volume Section Display Parameters - Customize Volume data visual appearance and colors.
    • Sessions Section Display Parameters - Customize Sessions data visual appearance and colors.
    • Market Section Display Parameters - Customize Market data visual appearance and colors.
    • Account Section Display Parameters - Customize Account data visual appearance and colors.
    Reviews 3
    XANKEEZ
    889
    XANKEEZ 2025.08.28 06:48 
     

    nice indicator with great support!

    Todor Bayganov
    545
    Todor Bayganov 2024.03.14 10:42 
     

    Great indicator! :)

    Erdinç Yıldız
    539
    Erdinç Yıldız 2017.12.08 12:22 
     

    The new update looks very good. Waiting for it. 5 stars for the effort and listening to the comments.

    Recommended products
    Forex Volume MT4
    KEENBASE SOFTWARE SOLUTIONS
    KT Forex Volume shows the buying and selling volume of a currency pair in the form of a colored histogram. The volume is made of buying and selling transactions in an asset. In FX market: If the buying volume gets bigger than the selling volume, the price of a currency pair would go up. If the selling volume gets bigger than the buying volume, the price of a currency pair would go down. Features Avoid the bad trades by confirming them using the tick volume data. It helps you to stay on the side
    Volume Compair
    Thiago Pereira Pinho
    5 (1)
    Professional Cumulative Delta & Volume Median Indicator Track   real buying/selling pressure   with this powerful volume analysis tool. The   Volume Compare Indicator   combines   Cumulative Delta   and   Volume Medians   to help you identify institutional activity, imbalances, and potential reversals. Key Features: Cumulative Delta Histogram   – Visualizes net buying vs. selling volume in real-time. Buy/Sell Volume Medians   – Horizontal lines showing average buy & sell volume levels. Smart Vo
    MT4 Version : https://www.mql5.com/en/market/product/157433 MT5 Version : https://www.mql5.com/en/market/product/167286 Volume Imbalance is a lightweight Volume Profile + Delta Imbalance visualization tool designed to help you spot high-activity price zones, directional pressure, and “empty” price areas inside a configurable lookback range. Unlike classic volume profile that only shows total volume, this indicator splits each price level into: Bull Volume (Buy Pressure) – estimated from bulli
    MarketProfile EForex
    Veridiana Adorno Kendrick
    Market Profile Shows where the price has spent more time, highlighting important levels that can be used in trading. It is a powerful tool which is designed to take the fundamental components which comprise every market; price/volume/time, and visually display their relationship in real-time as the market develops for a pre-determined time period. Very powerful tool!
    Description The Market Profile & Volume Profile Indicator is a powerful technical analysis tool designed to visualize market activity and price distribution over specific timeframes. Unlike standard technical indicators that focus solely on price over time, this indicator organizes price data to show where the market spent the most time (TPO) and where the most volume was traded (Volume Profile). It automatically calculates and displays key structural levels such as the Point of Control (POC) ,
    The   Donchian Time Sync Analyzer   brings powerful   multi-timeframe   dimension to classic Donchian channel analysis, allowing traders to simultaneously monitor   trend strength   and potential   reversal signals   across five different chart periods. This advanced indicator calculates the highest highs and lowest lows across your selected timeframes, generating   clear visual signals   that help identify convergence of trend direction across multiple time horizons. By providing coordinated an
    Simply The Best Pro
    Szymon Palczynski
    5 (1)
    This indicator displays the histogram and arrows on chart. When Simple The Best Pro are placed on a chart, they identify the trend.  The color of may be blue or red. The blue color stands for upside moves and the red color stands for downside trends. The indicator offers to set Stop Loss (SL) and  Take Profit (TP)  setting. The default value is ATR. Indicator has automatic optimization. The STB is a unique indicator that shows the tendency (button Bars) of a particular signals. The STB tells us
    Market Profile 3
    Hussien Abdeltwab Hussien Ryad
    3 (2)
    Market Profile 3 MetaTrader 4 indicator  — is a classic Market Profile implementation that can show the price density over time, outlining the most important price levels, value area, and control value of a given trading session. This indicator can be attached to timeframes between M1 and D1 and will show the Market Profile for daily, weekly, monthly, or even intraday sessions. Lower timeframes offer higher precision. Higher timeframes are recommended for better visibility. It is also possible t
    FREE
    The indicator builds current quotes, which can be compared with historical ones and on this basis make a price movement forecast. The indicator has a text field for quick navigation to the desired date. Options: Symbol - selection of the symbol that the indicator will display; SymbolPeriod - selection of the period from which the indicator will take data; IndicatorColor - indicator color; Inverse - true reverses quotes, false - original view; Next are the settings of the text field, in w
    This indicator is a conventional analytical tool for tick volumes changes. It calculates tick volumes for buys and sells separately, and their delta on every bar, and displays volumes by price clusters (cells) within a specified bar (usually the latest one). The algorithm used internally is the same as in the indicator VolumeDelta , but results are shown as cumulative volume delta bars (candlesticks). Analogous indicator for MetaTrader 5 exists - VolumeDeltaBars . This is a limited substitution
    AQ XFifteen
    HIT HYPERTECH INNOVATIONS LTD
    4 (7)
    Χ15 indicator is a MetaTrader 4 tool that allows you to BUILD & BACKTEST ON REAL TIME your own strategies quickly, easily and efficiently. It contains 15 of the most popular technical analysis indicators that you can use, each one in a different way. Choose the indicators that you want to use, select how you will use them and you will see on the chart BUY (green) and SELL (red) arrows implementing your strategy. Choose Take Profit and Stop Loss and you will see the results of your strategy with
    FREE
    UPD1 Profile Levels
    Vitaliy Kuznetsov
    5 (7)
    The indicator finds the levels of the maximum and minimum price volume (market profile) on the working histogram for the specified number of bars.  Composite profile . The height of the histogram is fully automatic and adapts to any instrument and timeframe. The author's algorithm is used and does not repeat well-known analogues. The height of the two histograms is approximately equal to the average height of the candle. Smart alert will help you to inform about the price concerning the volume
    Pips forex - is a ready trading system . This indicator shows with arrows on the chart when and in what direction you need to open an order. If the arrow is green, then we open a buy deal, and if the arrow is red, then we open a sell deal. Everything is very simple and quite effective. TakeProfit set 15-25 points. StopLoss set at the level of points. When the dots move, we immediately override the StopLoss. Recommended timeframe for trading M1 and M5. This is a scalping strategy and works best
    BoxChart MT4
    Evgeny Shevtsov
    4.4 (5)
    The market is unfair if only because 10% of participants manage 90% of funds. An ordinary trader has slim changes to stand against these "vultures". This problem can be solved. You just need to be among these 10%, learn to predict their intentions and move with them. Volume is the only preemptive factor that faultlessly works on any timeframe and symbol. First, the volume appears and is accumulated, and only then the price moves. The price moves from one volume to another. Areas of volume accumu
    This indicator help to mark the high and low of the session Asian,London,Newyork , with custom hour setting This indicator is set to count from minute candle so it will move with the current market and stop at the designated hour and create a accurate line for the day. below is the customization that you can adjust : Input Descriptions EnableAsian Enables or disables the display of Asian session high and low levels. EnableLondon Enables or disables the display of London session high and
    FREE
    BoxInside MT4
    Evgeny Shevtsov
    4.83 (6)
    This indicator calculates the volume profile and places labels that correspond to the VAH, VAL and POC levels, for each candle individually. Indicator operation features The indicator works on the timeframes from M5 to MN, but it uses the history data of smaller periods: M1 - for periods from M5 to H1, M5 - for the H4 period, M30 - for the D1 period, H4 - for the W1 period, D1 - for the MN period. The color and location of the VAL, VAH and POC labels on the current candle are considered to be c
    FREE
    Time Bubble ***Specialized for GBPJPY 1H time frame*** (tested for two years with success rates about 82%) Time Circle's smart algorithm detects the price circles with time . give strong signals at the right time as result of combine the price and time. our team spent months to develop this indicator specially for GBPJPY ..with high success rates about 82% win trades over two years .tested from December 2016 to November 2018. *** in last two years total signals 1012 with 829 Wins and 183 Lo
    A technical indicator that calculates its readings on trading volumes. In the form of a histogram, it shows the accumulation of the strength of the movement of the trading instrument. It has independent calculation systems for bullish and bearish directions. Works on any trading instruments and time frames. Can complement any trading system. The indicator does not redraw its values, the signals appear on the current candle. It is easy to use and does not load the chart, does not require addition
    Introducing the Big Candle Scanner Dashboard MT4, an essential trading indicator designed to help traders identify significant bullish and bearish candles across multiple currency pairs and timeframes. This powerful tool is ideal for forex and crypto traders looking to capitalize on major price movements and market volatility. With the Big Candle Scanner Dashboard MT4, you gain the advantage of early entry points and enhanced risk management, allowing you to effectively spot trend initiations, b
    Smart Predictor — Continuous Market Forecasting with Intelligent Signals SmartPredictor  offers a fresh perspective on technical analysis. This indicator combines price data smoothing with advanced forecasting elements to create a seamless, continuous "past-present-future" view. No more guessing where the price might go — you can now see the most probable scenario plotted directly on your chart. Key Innovation: Zero Visual Lag Unlike standard averaging indicators such as moving averages that a
    The balance of supply and demand is a simple and effective market analysis method. The supply and demand diagram can show you in advance, even before the trend reversal, where the supply ends and the demand is already emerging, where the demand ends and the supply is emerging, while substantially increasing the probability of making a deal in the right direction and with a high profit factor. Indicator Signals The indicator uses the price/volume values to generate signals: ED – excess demand. E
    Volume Profile Sniper v11.1 is a comprehensive market analysis tool A professional approach to trading Volume Profile Sniper v11.1 combines more than 15 key filters in one indicator, providing clear signals based on a comprehensive assessment of the market situation. Main features Volume imbalance analysis – the algorithm calculates the share of buyers and sellers in each candle, signaling the predominance of one of the parties (configurable threshold from 50% to 90%). Multilevel signal filte
    VSA Histogram
    Richard Bystricky
    VSA - P (Volume Spread Analysis) Period-Based Histogram is a tool that visually represents market volume dynamics using Volume Spread Analysis principles, with a focus on highlighting key volume changes over specific time periods. The histogram captures changes in volume and price spread relationships in real-time, enabling traders to detect early signals of accumulation, distribution, and shifts in buying or selling pressure. Indicator is non repainting and working with real-time on tick data.
    VR Grid
    Vladimir Pastushak
    5 (3)
    The VR Grid indicator is designed to create a graphical grid with user-defined settings. Unlike the standard grid , VR Grid is used to build circular levels . Depending on the user's choice, the step between the round levels can be arbitrary. In addition, unlike other indicators and utilities, VR Grid maintains the position of the grid even when the time period changes or the terminal is rebooted. You can find settings, set files, demo versions, instructions, problem solving, at [blog] You can
    FREE
    Simple Anchored VWAP is a lightweight yet powerful tool designed for traders who want precise volume-weighted levels without complexity. This indicator lets you anchor VWAP from any point on the chart and instantly see how price reacts around institutional volume zones. MT5 Version -  https://www.mql5.com/en/market/product/155321/ Join To Learn Market Depth -   https://www.mql5.com/en/channels/suvashishfx Using VWAP bands and dynamic levels, the tool helps you understand where real buying and s
    FREE
    Blahtech Market Profile
    Blahtech Limited
    4.53 (15)
    Was: $249  Now: $99   Market Profile defines a number of day types that can help the trader to determine market behaviour. A key feature is the Value Area, representing the range of price action where 70% of trading took place. Understanding the Value Area can give traders valuable insight into market direction and establish the higher odds trade. It is an excellent addition to any system you may be using. Blahtech Limited presents their Market Profile indicator for the MetaTrader community. Ins
    The indicator calculates volume profiles dynamically and displays the result as VAL, VAH and POC curves. Indicator features The indicator uses the historical data of the lower (relative to the current) timeframes for calculations: M1 - for timeframes up to H1, M5 - for timeframe H1, M15 - for timeframe H4, H1 - for timeframe D1, H4 - for timeframe W1, D1 - for timeframe MN. The color of the DPOC curve sections is determined by comparing the volume of the POC levels of all profiles that make up
    Cumulative Delta MT4
    Evgeny Shevtsov
    4.86 (29)
    The indicator analyzes the volume scale and splits it into two components - seller volumes and buyer volumes, and also calculates the delta and cumulative delta. The indicator does not flicker or redraw, its calculation and plotting are performed fairly quickly, while using the data from the smaller (relative to the current) periods. The indicator operation modes can be switched using the Mode input variable: Buy - display only the buyer volumes. Sell - display only the seller volumes. BuySell -
    FREE
    MidPrice_A — The Hidden Power of the Market in a Single Number Looking for a way to see the true market direction without noise, lag, or overloaded charts? MidPrice_A is a minimalistic yet powerful tool that reveals the pure price impulse , based on a professional market movement logic. What does MidPrice_A do? Unlike traditional indicators that rely on closing prices and often lag behind, MidPrice_A analyzes the candle mid-price and measures how far the market has actually shifted over the last
    FREE
    Last 50 Pips
    Martin Alejandro Bamonte
    The Last 50 Pips indicator is designed to quickly identify buying and selling opportunities based on recent price behavior. It measures price changes in the last candles to highlight in yellow moments when the price may be changing direction. Buy signal: You should open a BUY position when the indicator changes from RED to YELLOW , suggesting a change from a downtrend to an uptrend. Please refer to the images to see how easy it is. Sell signal: You should open a SELL position when the indicato
    Buyers of this product also purchase
    Gann Made Easy
    Oleg Rodin
    4.83 (162)
    Gann Made Easy is a professional and easy to use Forex trading system which is based on the best principles of trading using the theory of W.D. Gann. The indicator provides accurate BUY and SELL signals including Stop Loss and Take Profit levels. You can trade even on the go using PUSH notifications. PLEASE CONTACT ME AFTER PURCHASE TO GET TRADING  INSTRUCTIONS AND GREAT EXTRA INDICATORS   FOR FREE! Probably you already heard about the Gann trading methods before. Usually the Gann theory is a ve
    M1 Sniper
    Oleg Rodin
    5 (22)
    M1 SNIPER is an easy to use trading indicator system. It is an arrow indicator which is designed for M1 time frame. The indicator can be used as a standalone system for scalping on M1 time frame and it can be used as a part of your existing trading system. Though this trading system was designed specifically for trading on M1, it still can be used with other time frames too. Originally I designed this method for trading XAUUSD and BTCUSD. But I find this method helpful in trading other markets a
    Scalper Inside PRO
    Alexey Minkov
    4.74 (69)
    Scalper Inside PRO – Since 2020. An exclusive indicator that utilizes an innovative algorithm to swiftly and accurately determine the market trend. The indicator automatically calculates opening, closing, and profit levels, providing detailed trading statistics. With these features, you can choose the most appropriate trading instrument for the current market conditions. Additionally, you can easily integrate your own arrow indicators into Scalper Inside Pro to quickly evaluate their statistics
    PRO Renko System
    Oleg Rodin
    5 (30)
    PRO Renko System is a highly accurate trading system specially designed for trading RENKO charts. The ARROWS and Trend Indicators DO NOT REPAINT! The system effectively neutralizes so called market noise giving you access to accurate reversal signals. The indicator is very easy to use and has only one parameter responsible for signal generation. You can easily adapt the tool to any trading instrument of your choice and the size of the renko bar. I am always ready to provide extra support to help
    Auto Optimized Parabolic RSI: Advanced 3D Momentum Engine Most retail indicators fail because they rely on static inputs that break the moment market volatility shifts. Auto Optimized Parabolic RSI solves the problem of "indicator decay" by continuously recalculating its own mathematical edge, bringing institutional-grade quantitative adaptation directly to your MT5 terminal. The Core Advantage: Custom In-Memory 3D Optimization   Standard auto-optimizers often freeze the MT5 platform because the
    Quantum Breakout Indicator PRO
    Bogdan Ion Puscasu
    4.96 (26)
    Introducing   Quantum Breakout PRO , the groundbreaking MQL5 Indicator that's transforming the way you trade Breakout Zones! Developed by a team of experienced traders with trading experience of over 13 years, Quantum Breakout PRO is designed to propel your trading journey to new heights with its innovative and dynamic breakout zone strategy. Quantum Breakout Indicator will give you signal arrows on breakout zones with 5 profit target zones and stop loss suggestion based on the breakout box. I
    Market Makers
    Mohamed Hassan
    5 (4)
    After purchase, contact me privately to receive 1 month of free testing with EA Forex Proton! This advanced MT4 trading robot automatically executes signals from any MT4 indicator, including Market Makers. The latest version also includes AI integration, allowing each trade signal to be analyzed using Artificial Intelligence. Live Signal with EA Forex Proton: Click here Market Makers is a powerful price action trading system designed to identify high-probability Buy and Sell opportunities based
    New Update of Smart Trend Trading System MT5 For  2026 Market: If You Buy this Indicator you will Get my Professional   Trade Manager + EA  for   FREE . First of all Its worth emphasizing here that this Trading System is   Non-Repainting   , Non Redrawing and Non Lagging Indicator   Which makes it ideal from both manual and robot trading .  [Online course] ,   [manual]   and   [download presets] . The Smart Trend Trading System MT5 is a comprehensive trading solution tailored for   new   and   e
    PZ Harmonacci Patterns
    PZ TRADING SLU
    3.17 (6)
    Trade smarter, not harder: Empower your trading with Harmonacci Patterns This is arguably the most complete harmonic price formation auto-recognition indicator you can find for the MetaTrader Platform. It detects 19 different patterns, takes fibonacci projections as seriously as you do, displays the Potential Reversal Zone (PRZ) and finds suitable stop-loss and take-profit levels. [ Installation Guide | Update Guide | Troubleshooting | FAQ | All Products  ] It detects 19 different harmonic pric
    Please send me Direct message on MQL5 CHAT after purchasing the Indicator for Training and Installation Support There are some additional files that is important to use with the Indicator . So be sure to contact me after purchasing the Indicator So that I can add you for training and support . If you find any difficulty with installation then send me Direct message here So that I can connect with you via Anydesk or Teamview for the product installation. " Smart Order Block Indicator " to find m
    GoldRush Trend Arrow Signal V1.6 The GoldRush Trend Arrow Signal indicator V1.6 continues to provide precise, real-time trend analysis tailored for high-speed, short-term scalpers in XAU/USD , but it now has additional features and improved efficiency and reliability. Built specifically for the 1-minute time frame, this tool displays directional arrows for clear entry points, allowing scalpers to navigate volatile market conditions with confidence. The indicator consists of PRIMARY and SECONDARY
    Day Trader Master is a complete trading system for traders who prefer intraday trading. The system consists of two indicators. The main indicator is the one which is represented by arrows of two colors for BUY and SELL signals. This is the indicator which you actually pay for. I provide the second indicator to my clients absolutely for free. This second indicator is actually a good trend filter indicator which works with any time frame. THE INDICATORS DO NOT REPAINT AND DO NOT LAG! The system is
    The " Dynamic Scalper System " indicator is designed for the scalping method of trading within trend waves. Tested on major currency pairs and gold, compatibility with other trading instruments is possible. Provides signals for short-term opening of positions along the trend with additional price movement support. The principle of the indicator. Large arrows determine the trend direction. An algorithm for generating signals for scalping in the form of small arrows operates within trend waves.
    PZ Trend Trading
    PZ TRADING SLU
    4.8 (5)
    Capture every opportunity: your go-to indicator for profitable trend trading Trend Trading is an indicator designed to profit as much as possible from trends taking place in the market, by timing pullbacks and breakouts. It finds trading opportunities by analyzing what the price is doing during established trends. [ Installation Guide | Update Guide | Troubleshooting | FAQ | All Products ] Trade financial markets with confidence and efficiency Profit from established trends without getting whips
    GOLD Impulse with Alert
    Bernhard Schweigert
    4.67 (12)
    This indicator is a super combination of our 2 products  Advanced Currency IMPULSE with ALERT  and  Currency Strength Exotics . It works for all time frames and shows graphically impulse of strength or weakness for the 8 main currencies plus one Symbol! This Indicator is specialized to show currency strength acceleration for any symbols like Gold, Exotic Pairs, Commodities, Indexes or Futures. Is first of its kind, any symbol can be added to the 9th line to show  true currency strength accelerat
    Advanced Supply Demand
    Bernhard Schweigert
    4.91 (300)
    Trading Special – 40% OFF Best Solution for any Newbie or Expert Trader! This indicator is a unique, high quality and affordable trading tool because we have incorporated a number of proprietary features and a new formula. With this update, you will be able to show double timeframe zones. You will not only be able to show a higher TF but to show both, the chart TF, PLUS the higher TF: SHOWING NESTED ZONES. All Supply Demand traders will love it. :) Important Information Revealed Maximize the pot
    CRT Candle Range Theory HTF MT4.   Ultimate CRT Indicator: Advanced ICT Concepts and Malaysian SnR Trading System Discounted   Price   $50  !!     Secure your lifetime access   now   before it switches to   subscription-only ! Master the Market Maker's Footprints with the Most Advanced Candle Range Theory Indicator Unlock the true power of   Smart Money Concepts (SMC)   and trade precisely like the institutions with the   Ultimate CRT Indicator . Built exclusively for serious traders, this indic
    PZ Turning Points MT4
    PZ TRADING SLU
    1 (1)
    Identify key turning points with reliable fractal analysis This indicator examines the price structure of fractals of different periods to determine possible reversal points in the market, providing timing to positional traders that already have a fundamental or technical valuation model. Unlike its younger brother, Reversal Fractals , this indicator won't miss reversals because of the period selected, and will find reversal fractals on a zig-zag fashion, ignoring those reversals which do not
    PZ Support Resistance
    PZ TRADING SLU
    3.33 (3)
    Unlock key market insights with automated support and resistance lines Tired of plotting support and resistance lines? This is a multi-timeframe indicator that detects and plots supports and resistance lines in the chart with the same precision as a human eye would. As price levels are tested over time and its importance increases, the lines become thicker and darker, making price leves easy to glance and evaluate. [ Installation Guide | Update Guide | Troubleshooting | FAQ | All Products ] Boos
    They say history repeats itself. What if you could prove it in real-time? The Propfolio Ghost Pattern is an advanced algorithmic pattern-matching engine. It empowers you to select any current price action structure on your chart and instantly scan thousands of historical candles to find the exact moment in the past where the market did the exact same thing. Once it finds the highest probability match, it projects the historical outcome into the future as "Ghost Candles"—giving you a highly calcu
    Atomic Analyst
    Issam Kassas
    5 (5)
    First of all Its worth emphasizing here that this Trading Indicator is   Non-Repainting , Non Redrawing and Non Lagging Indicator   Indicator, Which makes it ideal from both manual and robot trading.  User manual: settings, inputs and strategy . The Atomic Analyst  is a PA Price Action Indicator that uses Strength and Momentum of the price to find a better edge in the market. Equipped with Advanced filters which help remove noises and false signals, and Increase Trading Potential. Using Multiple
    CURRENTLY 26% OFF !! This indicator is a super combination of both our main indicators ( Advanced Currency Strength 28 &  Advanced Currency IMPULSE with ALERT ). It shows Currency Strength values for TICK-UNITS and alert signals for 28 Forex pairs. 11 different Tick-Units can be used. Those are 1, 2, 3, 4, 5, 6, 10, 12, 15, 20, and 30 Seconds. The Tick-Unit bar in the sub-window will be shown and shifted to the left when there is at least 1 tick within the second’s timer.  With only ONE chart y
    KURAMA GOLD SIGNAL PRO (MT4) — Complete XAUUSD Trading System with 7-Layer Filter, Auto TP/SL, and Quality Scoring NON-REPAINTING. NON-REDRAWING. NON-LAGGING. Every signal is permanent. What you see is what you get. BONUS: Buy the lifetime license and receive AI Zone Radar ($59 value) + full PDF manual FREE. Message me after purchase. AI Zone Radar: https://www.mql5.com/en/market/product/175834 TRUSTED BY TRADERS: Already used by an active community of Gold traders. Praised for accuracy and
    Contact me after purchase to get Bonus EA based on this indicator. The Self Optimizing Double MA Strategy is a professional-grade trading tool designed to eliminate parameter guesswork. Powered by a built-in auto-optimization engine, it continuously adapts to shifting market conditions by simulating thousands of parameter combinations in the background to maintain a statistical edge. Instead of relying on static, outdated settings, the indicator dynamically updates its own logic to find the mos
    Gold Scalper Super
    Aleksandr Makarov
    5 (2)
    Gold Scalper Super is an easy-to-use trading system. The indicator can be used as a standalone scalping system on the M1 time frame, as well as part of your existing trading system. Bonus: when purchasing an indicator, Trend Arrow Super is provided free of charge, write to us after purchase. The indicator 100% does not repaint!!! If a signal appears, it does not disappear! Unlike indicators with redrawing, which lead to the loss of a deposit, because they can show a signal and then remove it.
    Trading Special –40% OFF Best Solution for any Newbie or Expert Trader! This Indicator is a unique, high quality and affordable trading tool because we have incorporated a number of proprietary features and a new formula. With only ONE chart you can read Currency Strength for 28 Forex pairs! Imagine how your trading will improve because you are able to pinpoint the exact trigger point of a new trend or scalping opportunity? User manual: click here That's the first one, the original! Don't buy a
    Technical indicator that structures charts and identifies cyclical price movements. Can work on any charts. Several types of alerts. There are additional arrows on the chart itself. Without redrawing on history, works on closing a candle. Recommended TF from M5 and higher. Easy to use and configure parameters. When using 2 indicators with different parameters, you can use without other indicators. Has 2 input parameters Cyclicality and Signal duration These 2 parameters work with the processin
    KuKl
    IGOR KIRIANEN
    The indicator is built on a non-standard Zig Zag, it draws accumulations after which if the price leaves this zone and a test of this zone occurs, then a sound signal is given and an arrow appears - after the test candle closes.The indicator does not redraw its signals, it is very easy to use, there are only three settings 1- this is the zig zag parameter 2- this is the minimum price exit from the zone 3- this is the maximum price exit from the zone. The lower the parameter for Zig Zag, the more
    Trend Screener
    STE S.S.COMPANY
    4.79 (95)
    Trend Screener Indicator --Professional Trend Trading & Market Scanning System for MetaTrader Unlock the true power of trend trading with Trend Screener Indicator — a complete multi-currency, multi-timeframe trend analysis solution   powered by Fuzzy Logic,Trend Pulse Technology  and advanced market structure algorithms.   Trend Screener transforms your MetaTrader platform into a professional-grade Trend Analyzer and Market Scanner, helping you identify high-probability trend opportunities, ear
    Advanced UT BOT ALERTS for MT4 Professional Multi-Filter Trend Detection System | Enhanced UT BOT Engine We only provide high-quality indicators.  Advanced UT BOT is built for professional use, featuring a stable signal logic and secure calculation process that prevents any delays or false updates. It does not repaint, redraw, remove, or modify past signals in any way. All BUY and SELL signals are generated only after the candle has closed , ensuring consistent accuracy and reliability. There is
    More from author
    The Donchian Time Sync Analyzer brings powerful multi-timeframe dimension to classic Donchian channel analysis, allowing traders to simultaneously monitor trend strength and potential reversal signals across five different chart periods. This advanced indicator calculates the highest highs and lowest lows across your selected timeframes, generating clear visual signals that help identify convergence of trend direction across multiple time horizons. By providing coordinated analysis from minute t
    SMC Sessions MT5
    Thushara Dissanayake
    5 (2)
    The SMC Sessions Indicator is a precision tool crafted for Smart Money traders who rely on ICT concepts, liquidity hunts, and session based strategies . It seamlessly maps out critical session based trading zones using the most proven and popular concepts used by institutional level traders. This all in one session indicator overlays your chart with the most effective and high probability range strategies, including: ICT Asian Range, London Breakout, New York Range, ICT London Open Killzone, ICT
    NewYork Range MT5
    Thushara Dissanayake
    The New York Range Indicator is a session based analysis tool developed for traders applying ICT (Inner Circle Trader) concepts, Smart Money trading, and institutional price action methods . Designed specifically for the New York session, this indicator captures the price range between 12:00 and 14:00 GMT , a critical period that overlaps with the London Close and New York Open . It identifies session highs and lows , detects Fair Value Gaps (FVGs) , and highlights potential liquidity sweep zone
    The ICT NewYork Open Killzone Indicator is designed for traders who follow Smart Money Concepts (SMC) , ICT trading models , and liquidity based strategies in the Forex market . This tool marks the New York Open Killzone , spanning 11:00 to 14:00 GMT , a critical time when institutional volume often leads to major moves. The indicator highlights session ranges , market maker ranges , liquidity sweeps , FVG zones (Fair Value Gaps) , and breakout opportunities , providing a complete view of price
    The London Session Breakout Strategy Indicator is designed for traders who follow ICT (Inner Circle Trader) and Smart Money Concepts (SMC) , focusing on session based liquidity hunts, killzones, and market maker behavior during the London session. This tool captures the highest and lowest price levels between 00:00 and 07:00 GMT , which is commonly identified as the London Killzone or market maker range . It helps traders identify potential breakout zones where institutional activity and volati
    Opening Range Breakouts MT5
    Thushara Dissanayake
    4.5 (4)
    The Opening Range Breakouts Indicator is a session based trading tool designed for traders who follow institutional trading concepts, such as ICT (Inner Circle Trader), Smart Money Concepts (SMC), and volume or order flow based strategies. This indicator plots essential session opening ranges, allowing traders to identify potential liquidity sweeps, breakout zones, fakeouts, and key intraday levels across the major global Forex sessions. This strategy is rooted in the concept of the Opening Rang
    Candle Power Pro
    Thushara Dissanayake
    4.5 (8)
    The   Candle Power Pro   is a sophisticated trading tool designed to decode   real volume pressure, tick data imbalances, and institutional order flow dynamics   by measuring the   battle between bull ticks and bear ticks   in real time. This indicator transforms raw   volume data into actionable insights , helping traders identify   Smart Money movements, liquidity hunts, and hidden market psychology   behind each price candle. By analyzing   buyer/seller volume percentages, divergence pattern
    Breakout Robot
    Thushara Dissanayake
    5 (3)
    The Breakout Robot EA is a specialized trading tool designed to automate time session-based breakouts . The EA operates by drawing a price range box and high/low lines according to the specified input time parameters. When price breaks above the high or below the low of this defined range, the EA automatically executes trades. The system's core functionality focuses on the EURJPY Breakout between 22:00-02:00 GMT, while its flexible architecture allows adaptation to other time-based strategies li
    Candle Volume Strength is an advanced volume analysis indicator that provides insights into the ongoing battle between buyers and sellers. It calculates and visualizes real time volume shifts, helping traders confirm breakouts, trends, retracements, and reversals with greater accuracy. Key Features: Volume Based Confirmation –   The indicator monitors tick volume changes and alerts when market power shifts between buyers and sellers. Trend and Breakout Validation –   By analyzing volume distri
    Introducing the Bollinger Band Volume Breakout Detector , a powerful technical indicator designed to enhance the popular Bollinger Band Breakout Strategy . This indicator takes trend following to the next level by incorporating Volume Data, effectively minimizing false signals. By adhering to the principle of "volume confirms price," this tool allows traders to identify price breakouts accompanied by significant increases in volume, ensuring more accurate trading decisions. The indicator's custo
    The   FVG Zone Indicator MT5   is a powerful tool designed to identify Fair Value Gaps (FVG) in the market, highlighting price imbalances between fair value and market price. This precise identification of gaps enables traders to spot potential market entry and exit points, significantly enhancing their ability to make informed trading decisions. With its intuitive and user-friendly interface, the FVG Zone Indicator automatically scans charts for Fair Value Gaps, marking these zones on the price
    Fibo Scalper Pro
    Thushara Dissanayake
    2.33 (3)
    The Fibo Scalper Pro Expert Advisor is a powerful tool designed to automate popular Fibonacci Trading Strategies . It simplifies the trading process by automatically drawing and adjusting Fibonacci levels on the chart. This feature provides convenience and accuracy for traders who utilize Fibonacci retracements and extensions in their analysis. One of the key features of the Fibo Scalper Pro is its customization facility. It allows professional traders to enable or disable each Fibonacci level
    Candle GAP
    Thushara Dissanayake
    3 (1)
    The Candle GAP indicator is an essential tool for traders utilizing Gap Trading Strategies as it automatically identifies candle gaps for each day of the week. A gap refers to a price level difference between the close and open of two consecutive days. This indicator recognizes four types of gap patterns: Common, Breakaway, Continuation, and Exhaustion. By incorporating this indicator into any chart, traders can validate their signals and enhance their trading decisions. One of the key features
    FREE
    Three MA Alert
    Thushara Dissanayake
    The Three MA Alert indicator is an essential tool for traders who rely on the Moving Averages Crossover Strategy . It simplifies your trading life by sending notifications to your mobile device, email, and displaying pop-up alerts with sound whenever there is a crossover of three moving averages. By following this widely used technique, you can ensure that you are always on the right side of the trend and avoid trading against the prevailing market direction. With the Three MA Alert indicator, y
    Mr Fibonacci
    Thushara Dissanayake
    5 (1)
    Introducing Mr. Fibonacci , an amazing indicator designed to simplify the process of drawing and adjusting Fibonacci levels on your chart. This indicator offers exceptional customization options for professional traders, allowing them to draw any Fibonacci level with precision. Additionally, it provides mobile notifications, email alerts, and pop-up alerts when price enters Fibonacci levels, ensuring you never miss potential trading opportunities. Using this indicator, you no longer have to cons
    Two MA Crossover
    Thushara Dissanayake
    5 (3)
    The Two MA Crossover is a powerful notification system designed specifically for traders who rely on the Moving Average Crossover Strategy . This fully automated indicator serves as a comprehensive alert system, ensuring that you never miss a crucial trading event. It sends notifications to your mobile device, email, and displays pop-up alerts with sound on your computer, all when it detects a moving average crossover based on your preferred parameters. One of its notable features is its compati
    Pivot Bro
    Thushara Dissanayake
    5 (1)
    The Pivot Bro technical indicator is a powerful tool designed to identify retracement areas using Pivot, Fibonacci, ATR, and ADR levels. It goes beyond that by also recognizing price action based reversal candlestick patterns . Additionally, the Currency Meter is a valuable companion for assessing the true strength of major currencies. By analyzing 28 currency pairs and displaying their strength on the chart with color changes, it enables traders to make informed decisions on entry and exit poin
    ReversalPatterns
    Thushara Dissanayake
    This technical indicator automatically identifies and analyzes price action using a variety of Reversal Candlestick Patterns on the chart. It conveniently draws arrow signs along with the corresponding pattern names, making it easy to spot the latest reversal candlestick patterns. With this indicator, you can quickly identify and compare chart analysis with previously identified candle patterns. The indicator includes a range of implemented candlestick patterns, both simple and complex, such as
    Reversal Alert Pro
    Thushara Dissanayake
    2.5 (2)
    The Reversal Alert Pro indicator is a powerful tool designed to automatically detect reversal areas in the market. It offers convenient notifications sent directly to your mobile device and displays pop-up alerts with sound. By incorporating this indicator into your trading strategy, you can effectively filter trade positions. Furthermore, the indicator provides the option to utilize CCI, RSI, and Stochastic indicators to further refine the generated signals, enhancing its versatility and applic
    Currency Strength 7
    Thushara Dissanayake
    The Currency Strength 7 technical indicator is a powerful tool designed to help traders gauge the strength of the seven most popular currencies. By analyzing the strength of AUD, USD, EUR, GBP, JPY, CHF, and CAD, this indicator provides valuable insights into currency dynamics. It represents currency strength on the chart using lines, allowing traders to quickly assess the relative strength of different currencies. One of the standout features of this indicator is its ability to draw an extended
    BullsBears Action
    Thushara Dissanayake
    The BullsBears Action Expert Advisor is an advanced trading solution designed for traders who rely on volume based market analysis. Utilizing Bulls and Bears volume data, this EA automatically identifies potential trade opportunities based on market strength and executes Buy or Sell orders according to user defined parameters. It is fully customizable, allowing traders to fine tune their strategies with multiple filters, risk management options, and trade execution controls. This EA includes an
    Crossover Action
    Thushara Dissanayake
    The Crossover Action Expert Advisor is an advanced tool designed to automate one of the most popular trading strategies, the M oving Average Crossover Strategy . With its intuitive interface and powerful features, this expert advisor takes the complexity out of manual trading and executes trades automatically based on moving average crossovers. One of the key features of this expert advisor is its proper risk management system, ensuring that trades are executed with appropriate lot sizes and max
    CCI Action
    Thushara Dissanayake
    The CCI Action Expert Advisor is a powerful tool designed to automate the CCI (Commodity Channel Index) Strategy , allowing traders to capitalize on CCI level touches. With its user friendly settings and robust risk management system, this EA provides a reliable and efficient solution for traders looking to incorporate the CCI indicator into their trading approach. One of the key features of this Expert Advisor is its proper risk management system, which helps traders maintain control over their
    News Robo
    Thushara Dissanayake
    2 (1)
    The News Robo Expert Advisor is a powerful tool designed to assist news traders in opening pending orders with hidden stop loss during news releases. It offers several features that enhance your trading experience and protect your trades. One of the key features of News Robo is the hidden stop loss, which is ideal for news traders who prefer to conceal their stop loss from market maker brokers. The stop loss is automatically revealed once a profitable position is achieved, allowing you to secure
    RSI Action
    Thushara Dissanayake
    3.67 (3)
    The RSI Action Expert Advisor is a powerful tool that automates popular RSI (Relative Strength Index) strategies, allowing for efficient and accurate trading. By utilizing overbought and oversold levels, this EA identifies optimal entry points for buy and sell orders. It also offers various signal filtering options to enhance trading precision, including RSI reversal points, pending orders, major trend identification, and Moving Average Crossover signals. Additionally, it incorporates a modern
    TPSL Driver
    Thushara Dissanayake
    Introducing the TPSL Driver Utility , a powerful tool designed to enhance your trading experience by automating Stop Loss and Take Profit management. This utility caters to every trader who desires seamless order management and advanced profit protection techniques. With the TPSL Driver Utility, you have the flexibility to choose between two modes of order management: Hidden and Visual. The Hidden mode allows you to hide the Take Profit and Stop Loss levels, providing a discreet approach to mana
    Entry Point
    Thushara Dissanayake
    The   Entry Point   indicator is a   professional signal dashboard   that combines multiple technical indicators across up to three timeframes to produce a single   consolidated entry signal . Rather than juggling separate windows for Moving Averages, CCI, RSI, Stochastic, Bill Williams Accelerator, and volume analysis, traders can view all these readings in one   intuitive visual panel . The system analyzes each timeframe independently, then applies   weighted voting   based on your chosen prio
    Entry Point Dashboard Ultimate
    Thushara Dissanayake
    4 (5)
    Introducing the Entry Point Dashboard Ultimate , a powerful technical indicator designed to provide Buy/Sell notifications for 6 currency pairs. This indicator analyzes 5 moving averages, CCI, RSI, Stochastic, Bill Williams, and volume indicators across 3 different time frames to generate accurate signals. It offers unlimited customization options for professional traders, allowing them to tailor the indicator based on their experience and strategies. The Entry Point Dashboard Ultimate sends sig
    Introducing the Fibo Channels Ultimate technical indicator, a powerful tool designed to revolutionize your Fibonacci trading strategy. With its advanced functionality, this indicator automatically draws all past Fibonacci channels on your chart, saving you time and effort. What sets the Fibo Channels Ultimate apart is its exceptional customization capabilities, allowing professional traders to draw any Fibonacci level they desire. This level of flexibility ensures that you can tailor the indicat
    The Crossover Tactics Ultimate Expert Advisor is a powerful tool designed to automate popular Moving Average Crossover Strategies . It excels at identifying optimal entry points based on the intersection of three moving averages, while employing advanced filtering techniques to enhance the reliability of signals. However, what sets this EA apart is its comprehensive trade management system, known as the TPSL Driver Utility algorithm. One of the standout features of this expert advisor is its abi
    Filter:
    XANKEEZ
    889
    XANKEEZ 2025.08.28 06:48 
     

    nice indicator with great support!

    Thushara Dissanayake
    28118
    Reply from developer Thushara Dissanayake 2025.08.28 09:03
    Hey, thank you so much for the kind words! I’m really glad you like the indicator, and it means a lot to hear you’re happy with the support too. I always value feedback and ideas from users, it helps me make the tools even better. So keep the ideas coming, and thanks again for taking the time to share your thoughts! Happy trading!
    Todor Bayganov
    545
    Todor Bayganov 2024.03.14 10:42 
     

    Great indicator! :)

    Thushara Dissanayake
    28118
    Reply from developer Thushara Dissanayake 2025.08.28 09:05
    Hey, thanks so much for the feedback! Really glad you're enjoying the indicator. Let me know if you ever have ideas or run into anything, always happy to help. Cheers!
    Erdinç Yıldız
    539
    Erdinç Yıldız 2017.12.08 12:22 
     

    The new update looks very good. Waiting for it. 5 stars for the effort and listening to the comments.

    Thushara Dissanayake
    28118
    Reply from developer Thushara Dissanayake 2025.08.28 09:07
    Hey, thanks so much for the kind words!
    Reply to review