Exit Area Ultimate
- Indicators
-
Thushara Dissanayake
 I’ve always loved exploring new trading strategies, testing them with indicators, and automating them with expert advisors (EAs). Welcome to my world of Forex Trading Robots, Indicators, and Trading Tools, all specially built for the MetaTrader platform.
 - Version: 2.0
- Updated: 17 April 2026
- Activations: 5
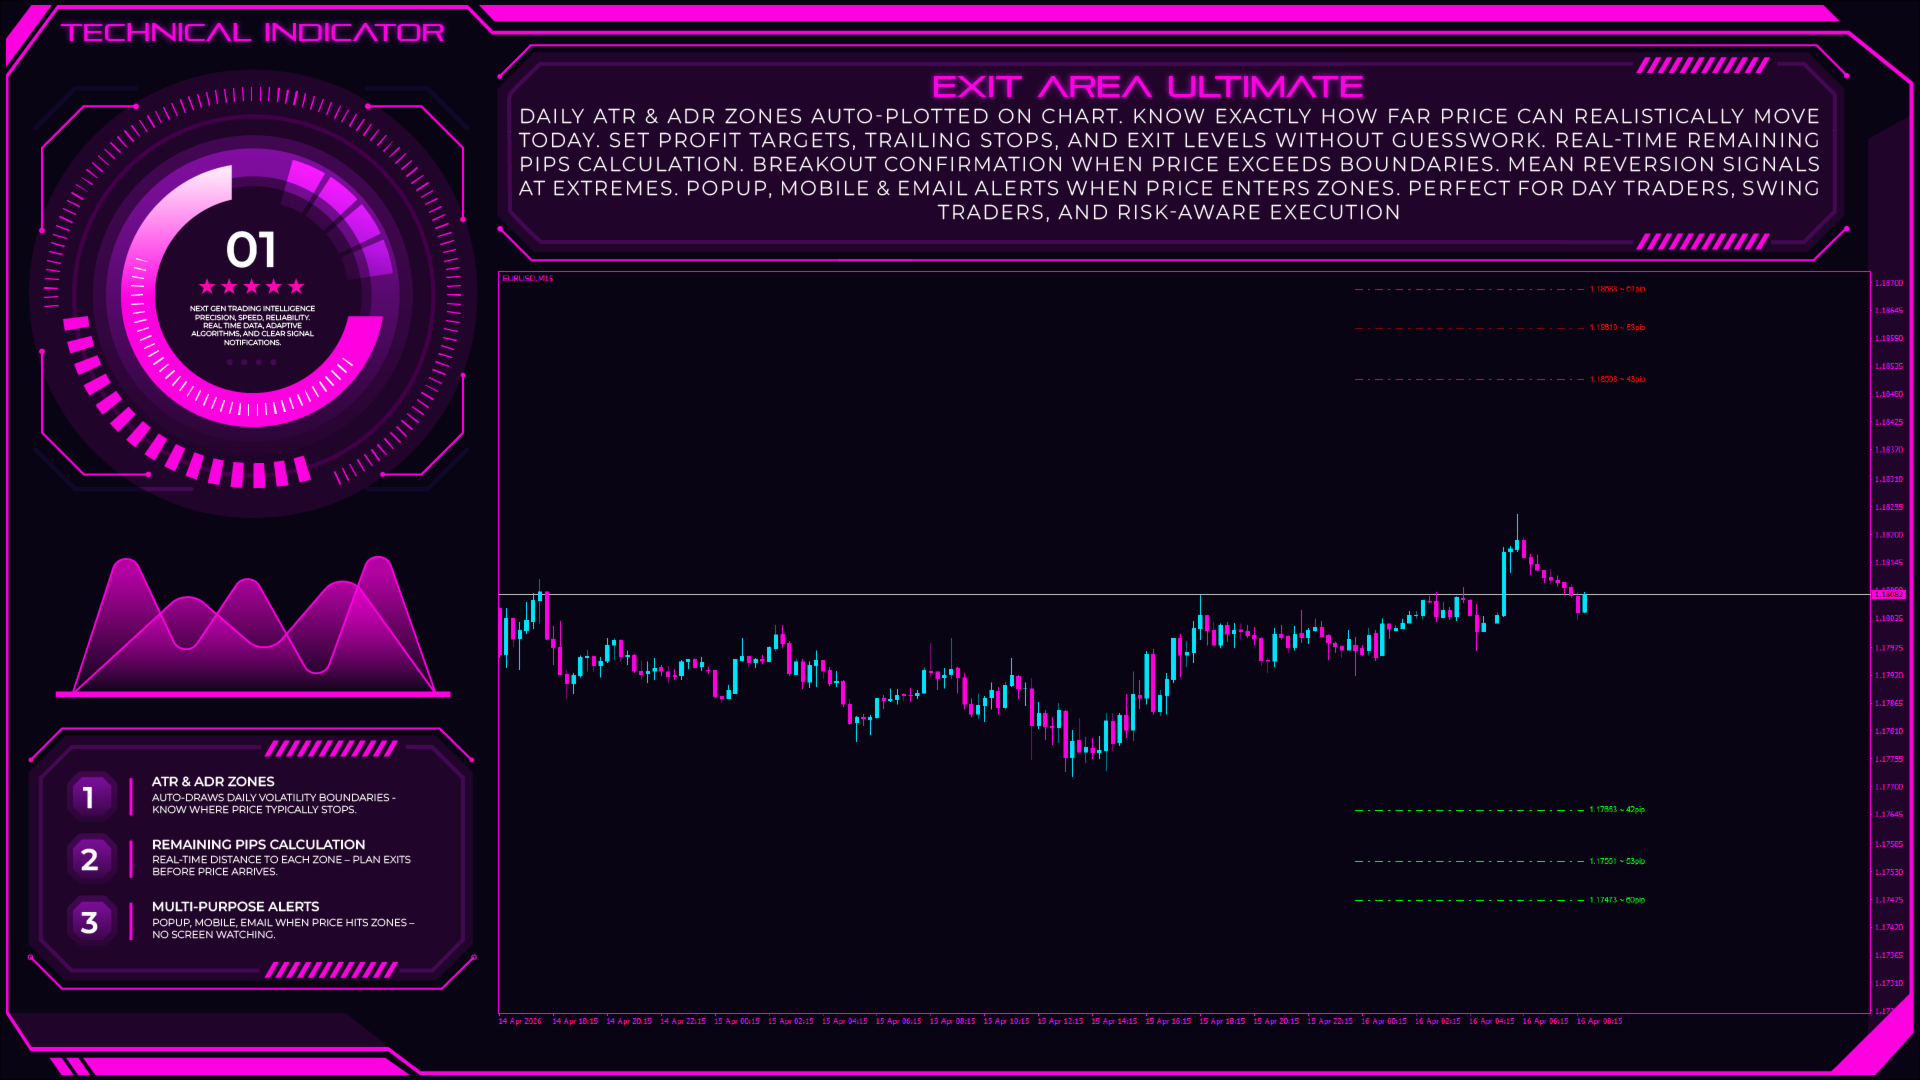
The Exit Area Ultimate is a practical chart tool that displays daily ATR (Average True Range) and ADR (Average Daily Range) levels directly on your chart, helping traders understand how much an asset typically moves in a single day. By showing these volatility based target zones, the indicator answers a key question: how far can price realistically go today? Based on historical price movement averages, the system draws upper and lower boundaries that represent the day's potential high and low zones. This makes it easier to set profit targets, trailing stops, and daily exit levels without guesswork.
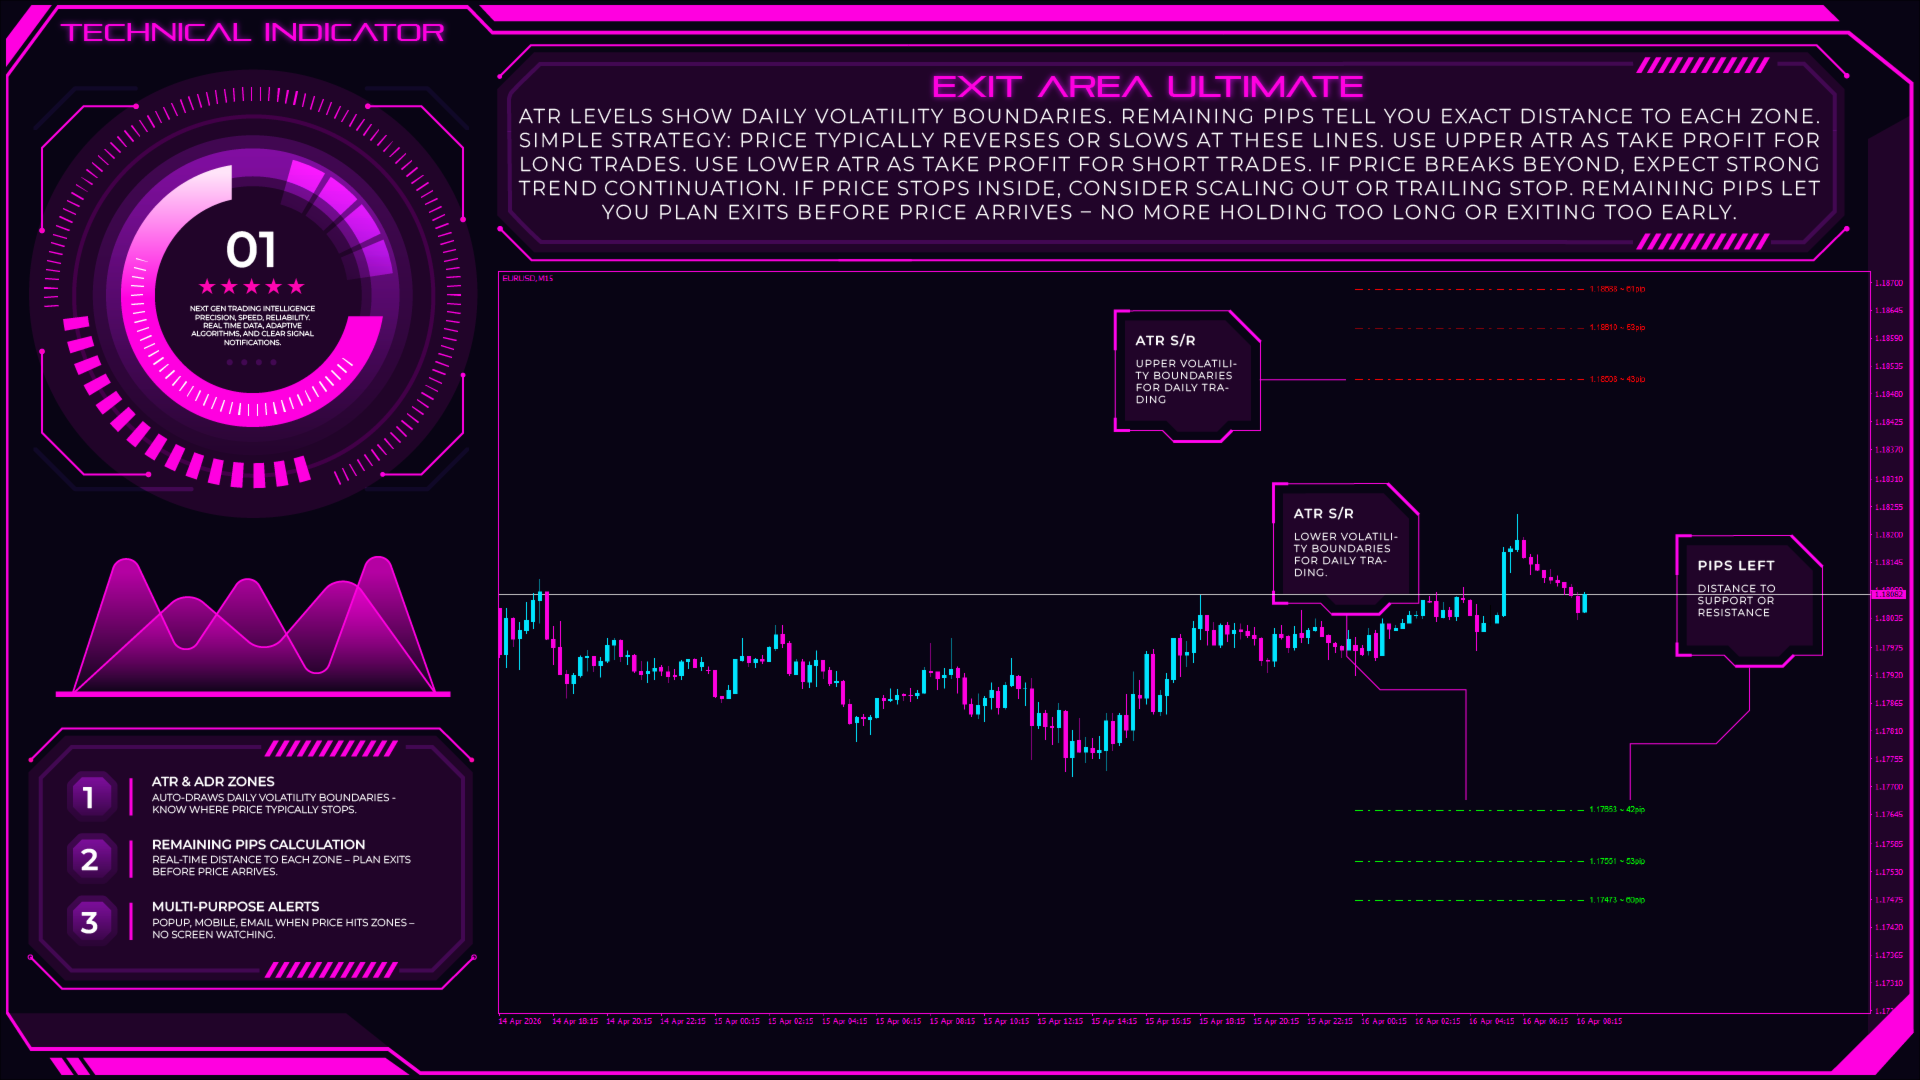
The indicator calculates the ADR, which measures the average distance between daily high and low prices over a user defined lookback period, and the ATR, which accounts for any price gaps between days. Both values are presented as horizontal price lines on your chart, updated in real time. Traders can choose to display one or both ranges, adjust the averaging period, and apply a multiplier to widen or tighten the zones based on market conditions. When price approaches or exceeds either boundary, the indicator can send popup, mobile, or email alerts, helping traders stay aware of potential reversal zones or breakout extensions without constantly watching the screen. A remaining pips calculation also provides a quick estimate of how much of the day's expected range has already been used.
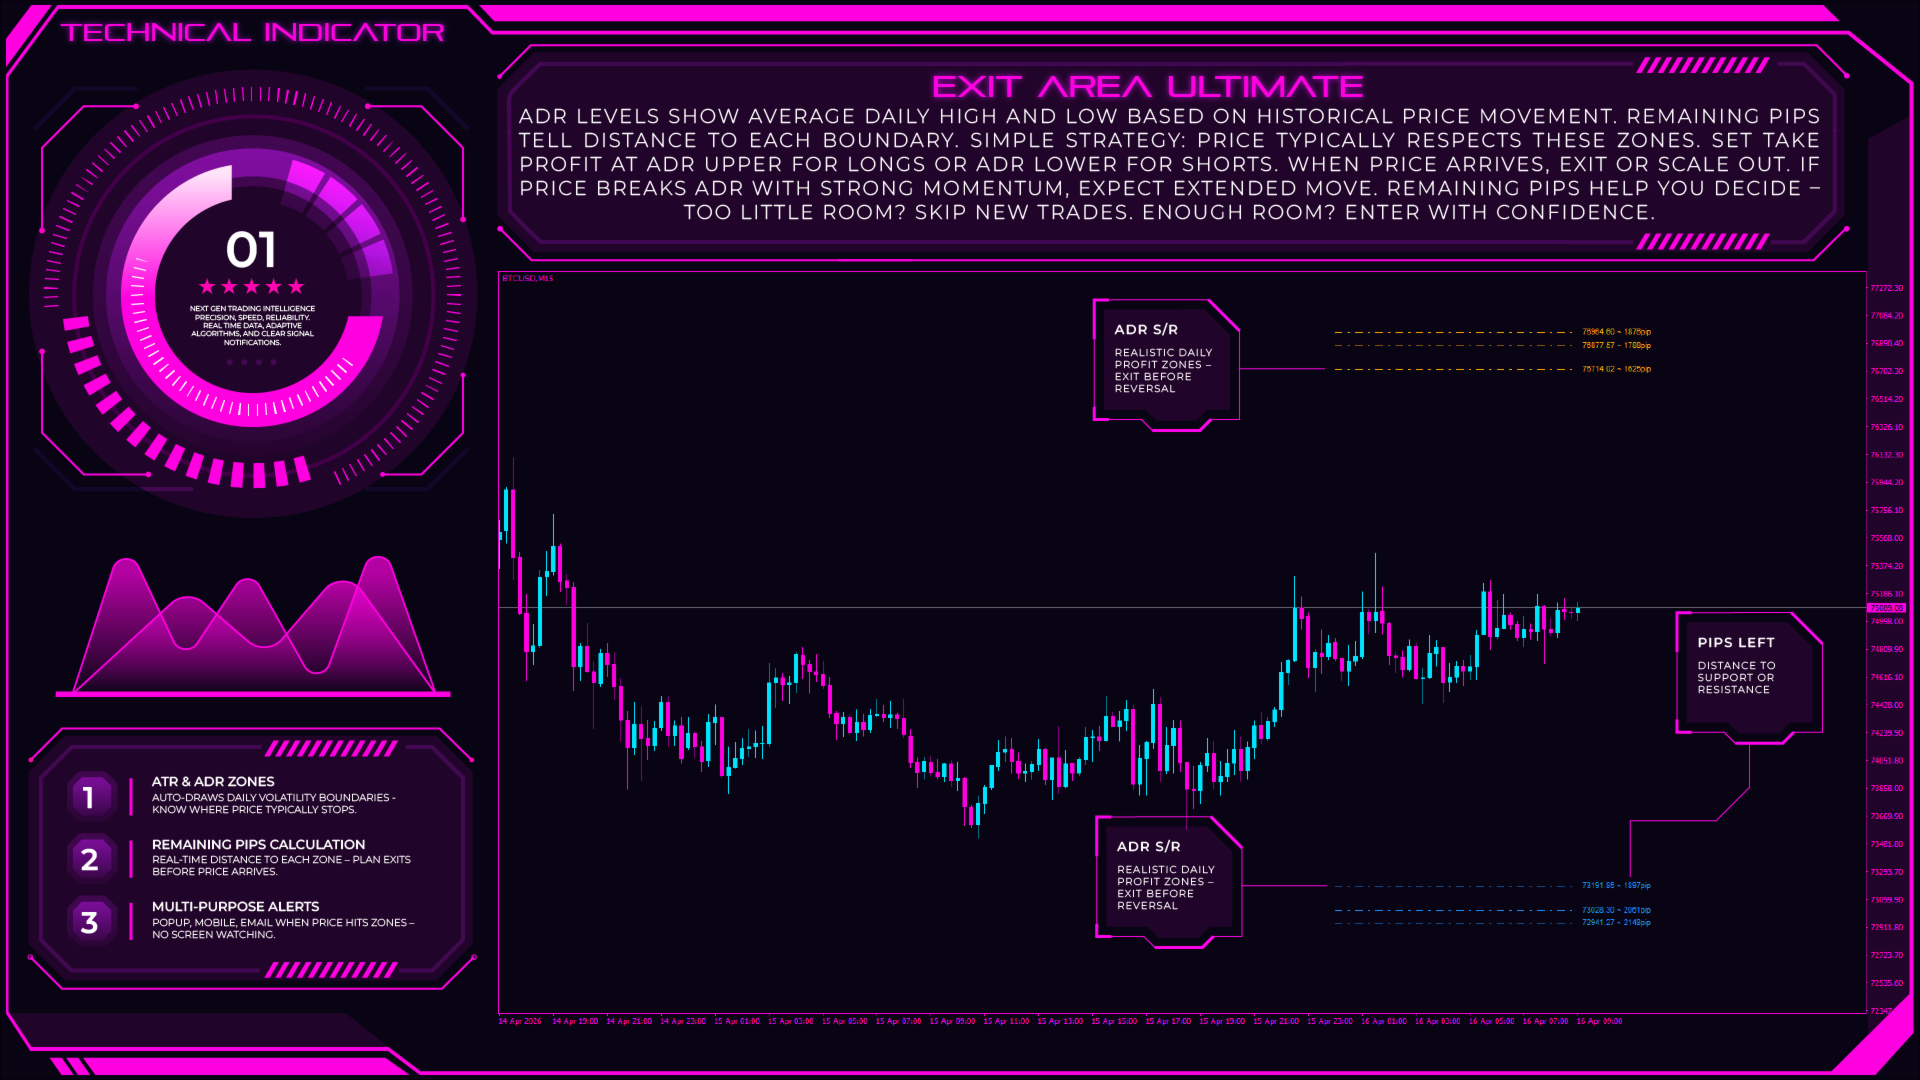
One of the most useful applications of this indicator is profit exit management. Many traders lose profits because they hold positions too long, waiting for unrealistic price targets. By knowing where the day's average range ends, traders can plan take-profit levels with greater discipline, either exiting completely when price reaches the ADR boundary or scaling out of positions to lock in gains. For stop-loss placement, the ATR or ADR distance can be used as a dynamic stop reference, keeping stops far enough to withstand normal volatility but tight enough to protect capital. The indicator also supports trailing stop strategies as price moves within the daily range, stops can be adjusted proportionally to the remaining expected movement.
Beyond simple exit timing, the Exit Area Ultimate works well for breakout confirmation. When price breaks above the upper ADR level, it suggests strong buying momentum with potential for continuation: conversely, a break below the lower level indicates selling pressure. Traders can use these signals alongside price action patterns or other confirmation tools before entering trades. For mean reversion strategies, when price reaches an ADR extreme without a clear breakout, the zone often acts as a reversal area, giving traders an opportunity to fade the move back toward the middle of the daily range. The indicator also helps scalpers and day traders assess whether there is still enough room in the day's range to justify a new position, improving risk to reward assessments before entry.
The indicator is compatible with every symbol, including Forex pairs, gold (XAUUSD), indices, commodities, and cryptocurrencies. Each level can be turned on or off independently, and graphical parameters allow customization of line colors, styles, and widths to match chart preferences. The alert system can be filtered to trigger only when price enters a zone, avoiding unnecessary notifications during normal market movement.
Ideal for day traders who need objective profit targets, swing traders managing multiple positions, breakout traders confirming volatility expansions, and risk-conscious traders looking to improve stop placement. New traders benefit from having clear daily boundaries drawn automatically, reducing the uncertainty of where to take profits or cut losses.
Final Notes
The Exit Area Ultimate does not predict price direction but provides a volatility based framework for setting realistic daily targets and stop levels. For best results, test different period settings and multiplier values in a demo account to match your trading style, and always combine the zones with other analysis methods such as support/resistance levels or candlestick confirmation before making trading decisions.


No me gustó mucho el indicador. Tampoco recibí demasiado buen soporte del autor. Me pareció un indicador útil, pero no conseguí configurarlo de manera que obtuviera buenas señales