CPieChart

Class for plotting pie charts.

ccanvas_piechart

The code of the above figure is provided below.

Description

The methods included in this class are designed for full-scale operation with pie charts, from the creating a graphical resource to designing labels to segments.

Declaration

   class CPieChart : public CChartCanvas

Title

   #include <Canvas\Charts\PieChart.mqh>

Inheritance hierarchy

  CCanvas

      CChartCanvas

          CPieChart

Class methods

Method

Action

Create

Virtual method that creates a graphical resource.  

SeriesSet

Sets a series of values that will be shows on the pie chart.

ValueAdd

Adds a new value to the pie chart (to the end).

ValueInsert

Inserts a new value to the pie chart (at the specified position).

ValueUpdate

Updates the value on the pie chart (at the specified position).

ValueDelete

Removes a value from the pie chart (at the specified position).

DrawChart

Virtual method which draws a pie chart and all its elements.

DrawPie

Draws a segment of the pie chart, which corresponds to a specified value.                                                        

LabelMake

Generates a segment label based on its value and the original label.

Methods inherited from class CCanvas

CreateBitmap, CreateBitmap, CreateBitmapLabel, CreateBitmapLabel, Attach, Attach, Destroy, ChartObjectName, ResourceName, Width, Height, Update, Resize, Erase, PixelGet, PixelSet, LineVertical, LineHorizontal, Line, Polyline, Polygon, Rectangle, Triangle, Circle, Ellipse, Arc, Arc, Arc, Pie, Pie, FillRectangle, FillTriangle, FillPolygon, FillCircle, FillEllipse, Fill, Fill, PixelSetAA, LineAA, PolylineAA, PolygonAA, TriangleAA, CircleAA, EllipseAA, LineWu, PolylineWu, PolygonWu, TriangleWu, CircleWu, EllipseWu, LineThickVertical, LineThickHorizontal, LineThick, PolylineThick, PolygonThick, PolylineSmooth, PolygonSmooth, FontSet, FontNameSet, FontSizeSet, FontFlagsSet, FontAngleSet, FontGet, FontNameGet, FontSizeGet, FontFlagsGet, FontAngleGet, TextOut, TextWidth, TextHeight, TextSize, GetDefaultColor, TransparentLevelSet, LoadFromFile, LineStyleGet, LineStyleSet

Methods inherited from class CChartCanvas

ColorBackground, ColorBackground, ColorBorder, ColorBorder, ColorText, ColorText, ColorGrid, ColorGrid, MaxData, MaxData, MaxDescrLen, MaxDescrLen, AllowedShowFlags, ShowFlags, ShowFlags, IsShowLegend, IsShowScaleLeft, IsShowScaleRight, IsShowScaleTop, IsShowScaleBottom, IsShowGrid, IsShowDescriptors, IsShowPercent, ShowLegend, ShowScaleLeft, ShowScaleRight, ShowScaleTop, ShowScaleBottom, ShowGrid, ShowDescriptors, ShowValue, ShowPercent, LegendAlignment, Accumulative, VScaleMin, VScaleMin, VScaleMax, VScaleMax, NumGrid, NumGrid, VScaleParams, DataOffset, DataOffset, DataTotal, DescriptorUpdate, ColorUpdate


Example

//+------------------------------------------------------------------+
//|                                               PieChartSample.mq5 |
//|                   Copyright 2009-2017, MetaQuotes Software Corp. |
//|                                              http://www.mql5.com |
//+------------------------------------------------------------------+
#property copyright   "2009-2017, MetaQuotes Software Corp."
#property link        "http://www.mql5.com"
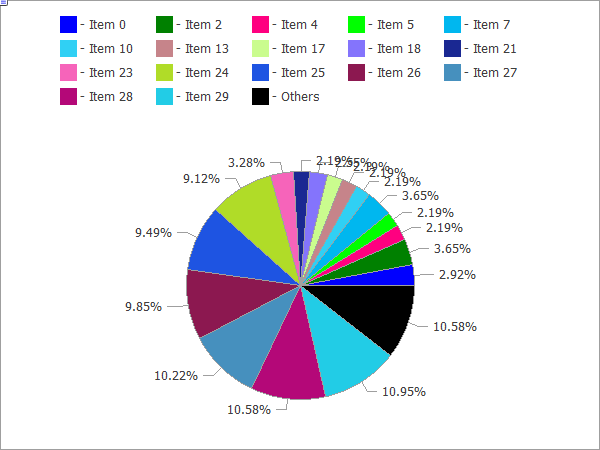
#property description "Example of using pie chart"
//---
#include <Canvas\Charts\PieChart.mqh>
//+------------------------------------------------------------------+
//| inputs                                                           |
//+------------------------------------------------------------------+
input int      Width=600;
input int      Height=450;
//+------------------------------------------------------------------+
//| Script program start function                                    |
//+------------------------------------------------------------------+
int OnStart(void)
  {
//--- check
   if(Width<=0 || Height<=0)
     {
      Print("Too simple.");
      return(-1);
     }
//--- create chart
   CPieChart pie_chart;
   if(!pie_chart.CreateBitmapLabel("PieChart",10,10,Width,Height))
     {
      Print("Error creating pie chart: ",GetLastError());
      return(-1);
     }
   pie_chart.ShowPercent();
//--- draw
   for(uint i=0;i<30;i++)
     {
      pie_chart.ValueAdd(100*(i+1),"Item "+IntegerToString(i));
      Sleep(10);
     }
   Sleep(2000);
//--- disable legend
   pie_chart.LegendAlignment(ALIGNMENT_LEFT);
   Sleep(2000);
//--- disable legend
   pie_chart.LegendAlignment(ALIGNMENT_RIGHT);
   Sleep(2000);
//--- disable legend
   pie_chart.LegendAlignment(ALIGNMENT_TOP);
   Sleep(2000);
//--- disable legend
   pie_chart.ShowLegend(false);
   Sleep(2000);
//--- disable percentage
   pie_chart.ShowPercent(false);
   Sleep(2000);
//--- disable descriptors
   pie_chart.ShowDescriptors(false);
   Sleep(2000);
//--- enable all
   pie_chart.ShowLegend();
   pie_chart.ShowValue();
   pie_chart.ShowDescriptors();
   Sleep(2000);
//--- or like this
   pie_chart.ShowFlags(FLAG_SHOW_LEGEND|FLAG_SHOW_DESCRIPTORS|FLAG_SHOW_PERCENT);
   uint total=pie_chart.DataTotal();
//--- play with values
   for(uint i=0;i<total && !IsStopped();i++)
     {
      pie_chart.ValueUpdate(i,100*(rand()%10+1));
      Sleep(1000);
     }
//--- play with colors
   for(uint i=0;i<total && !IsStopped();i++)
     {
      pie_chart.ColorUpdate(i%total,RandomRGB());
      Sleep(1000);
     }
//--- rotate
   while(!IsStopped())
     {
      pie_chart.DataOffset(pie_chart.DataOffset()+1);
      Sleep(200);
     }
//--- finish
   pie_chart.Destroy();
   return(0);
  }
//+------------------------------------------------------------------+
//| Random RGB color                                                 |
//+------------------------------------------------------------------+
uint RandomRGB(void)
  {
   return(XRGB(rand()%255,rand()%255,rand()%255));
  }