Pro Sessions MT4
- Indicators
- Version: 2.0
- Updated: 19 July 2026
- Activations: 10

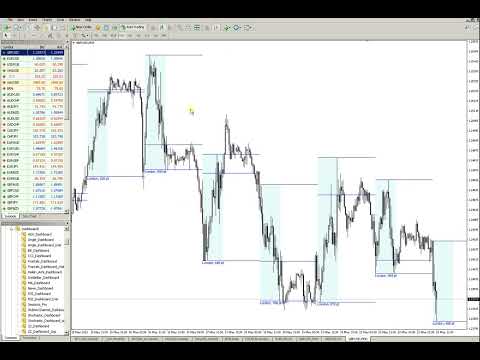
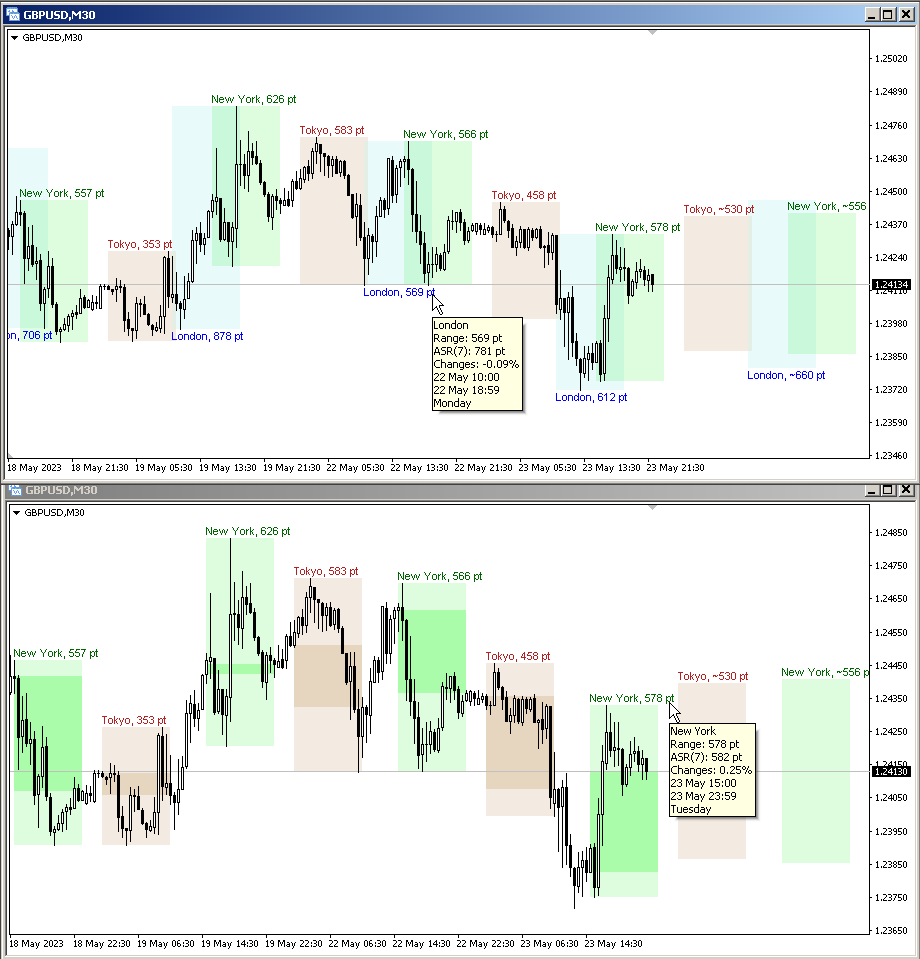
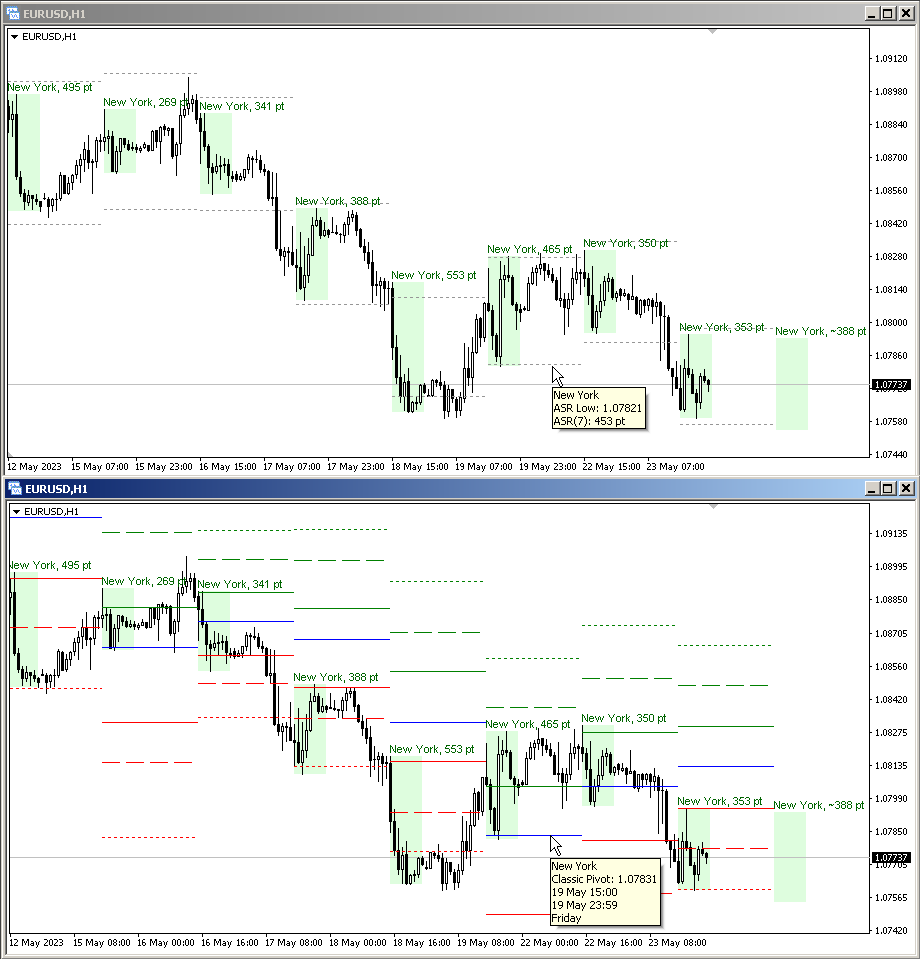
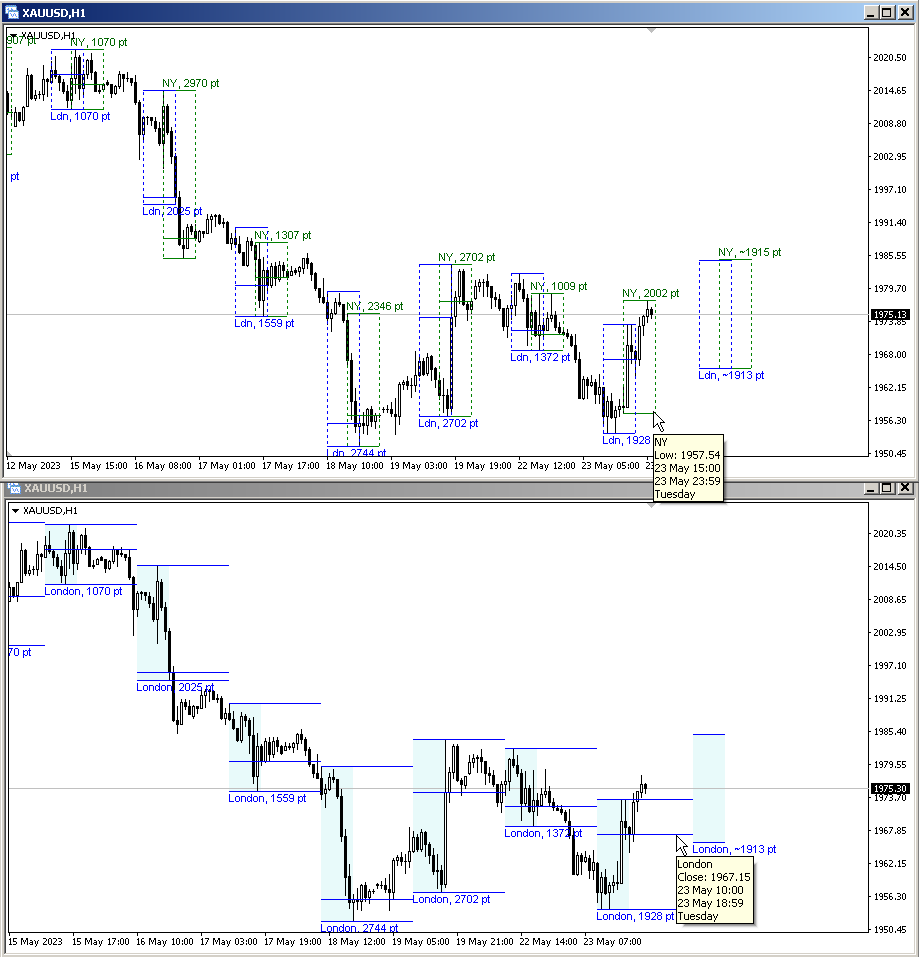
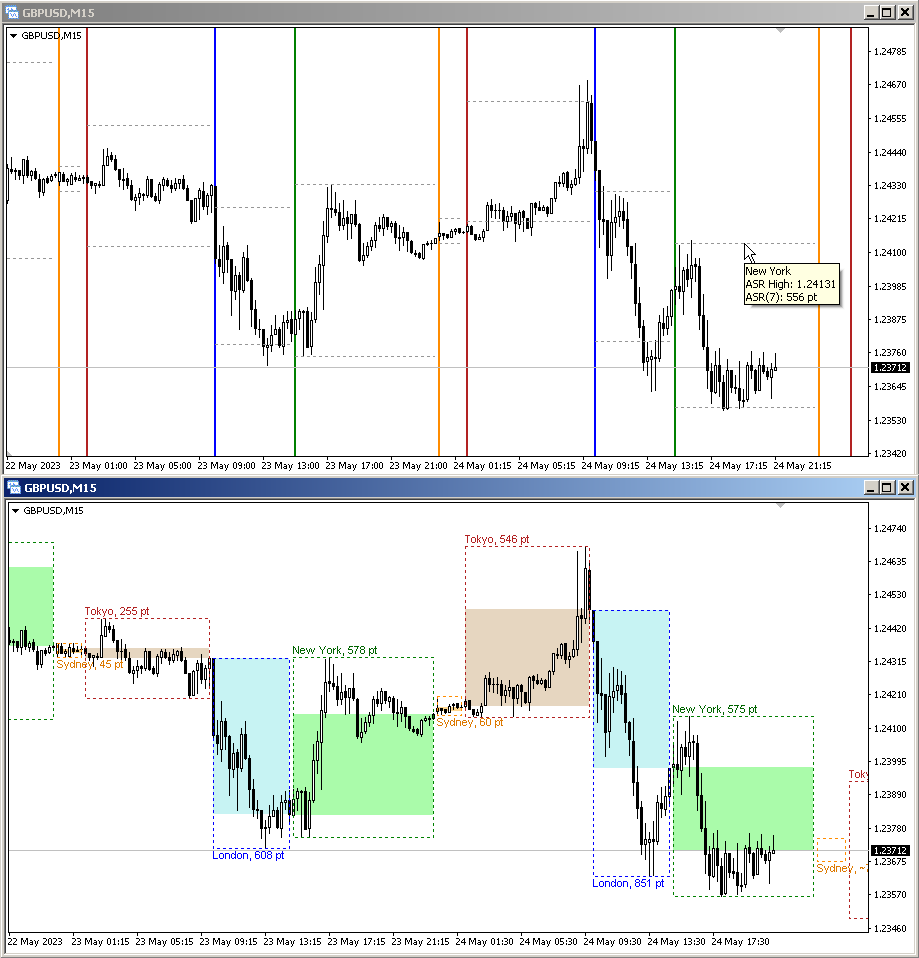
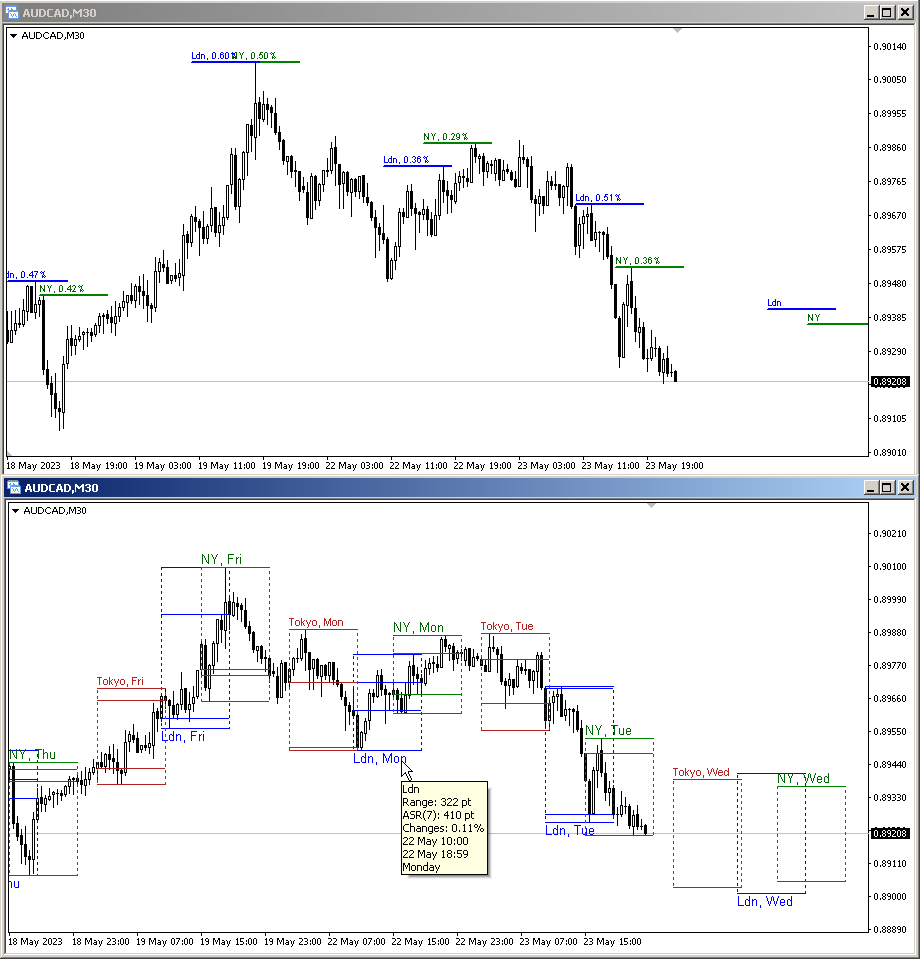
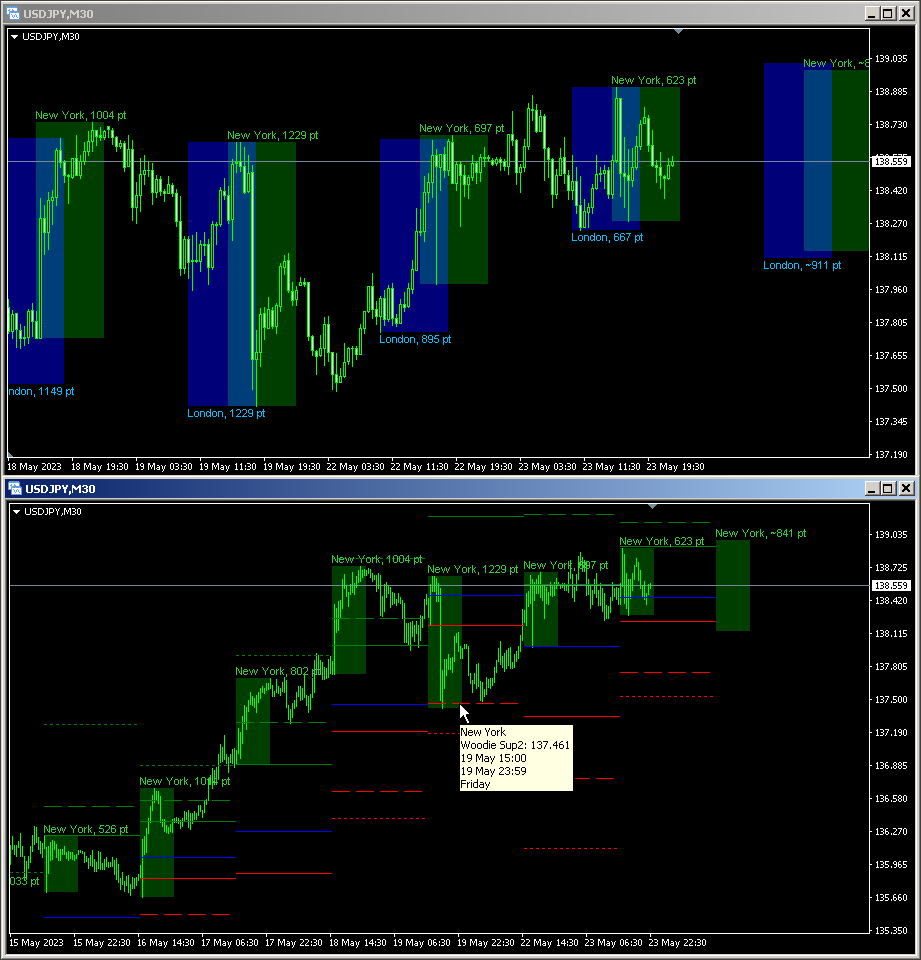
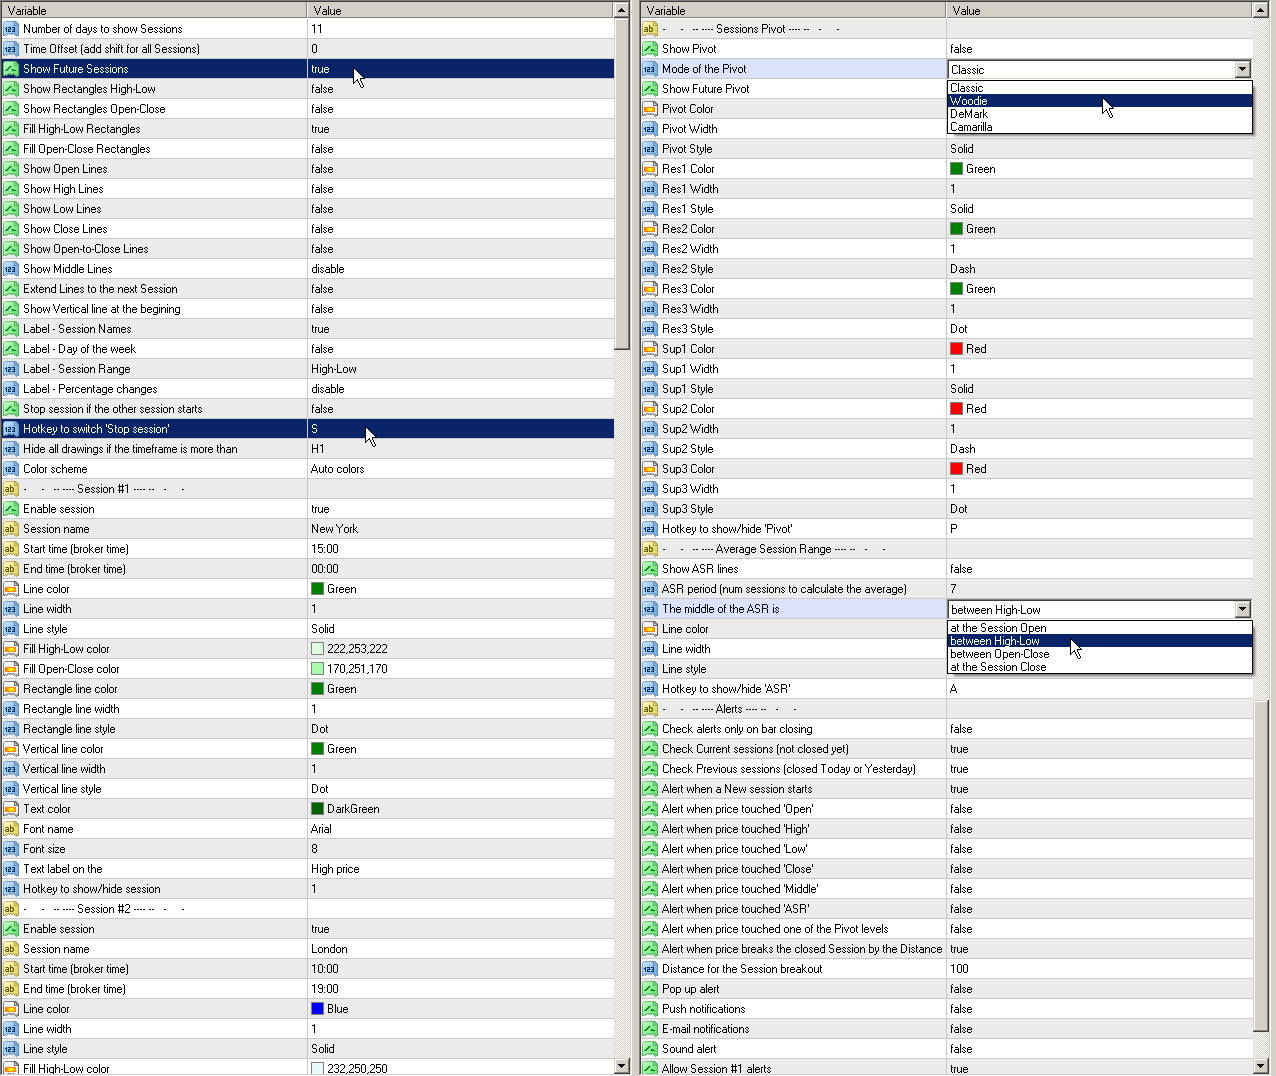
You can see ASR (Average Session Range) lines (default hotkey 'A'). This is similar to the ADR calculation, only it is calculated based on the last X-sessions, which allows you to see the potential range of the current (and previous) sessions (how far the price can move today). The average is calculated as the sum of previous sessions divided by the number of sessions (parameter 'ASR period (num sessions to calculate the average)'), each session has its own ASR value.
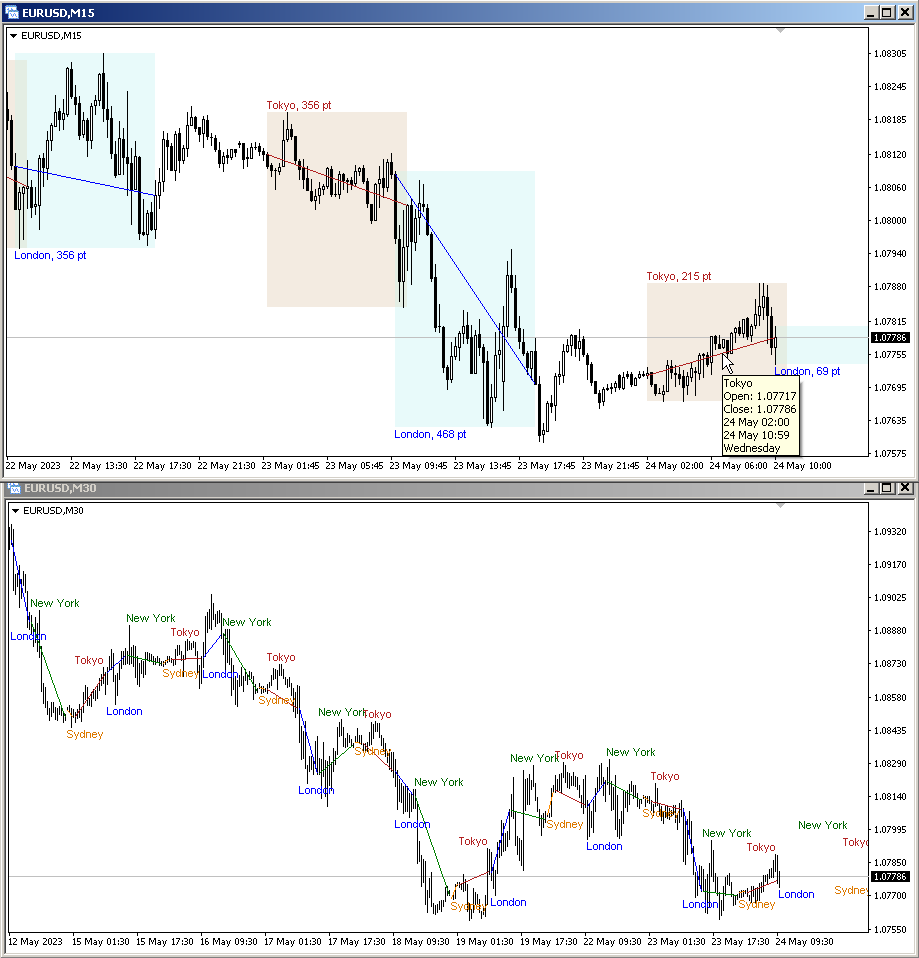
The indicator calculates and draws future sessions and their size. Correctly identifies holes in the history of quotes.
It can also draw a vertical separator at the beginning of each session.
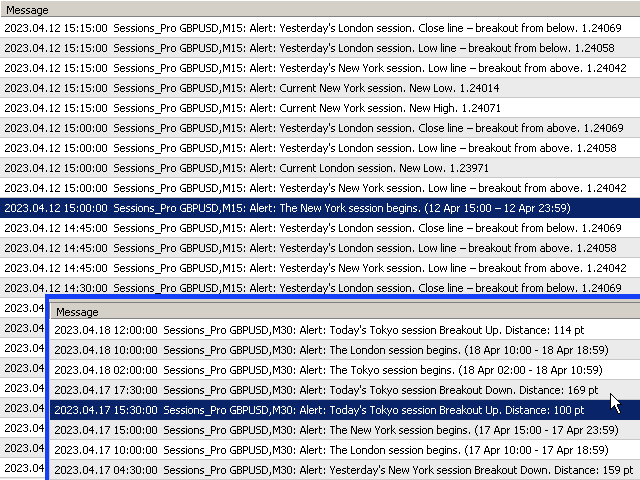
It also sends alerts when the session levels are touched by the price or when the price breaks through the closed session, for a given distance. Alerts for each session can be disabled.
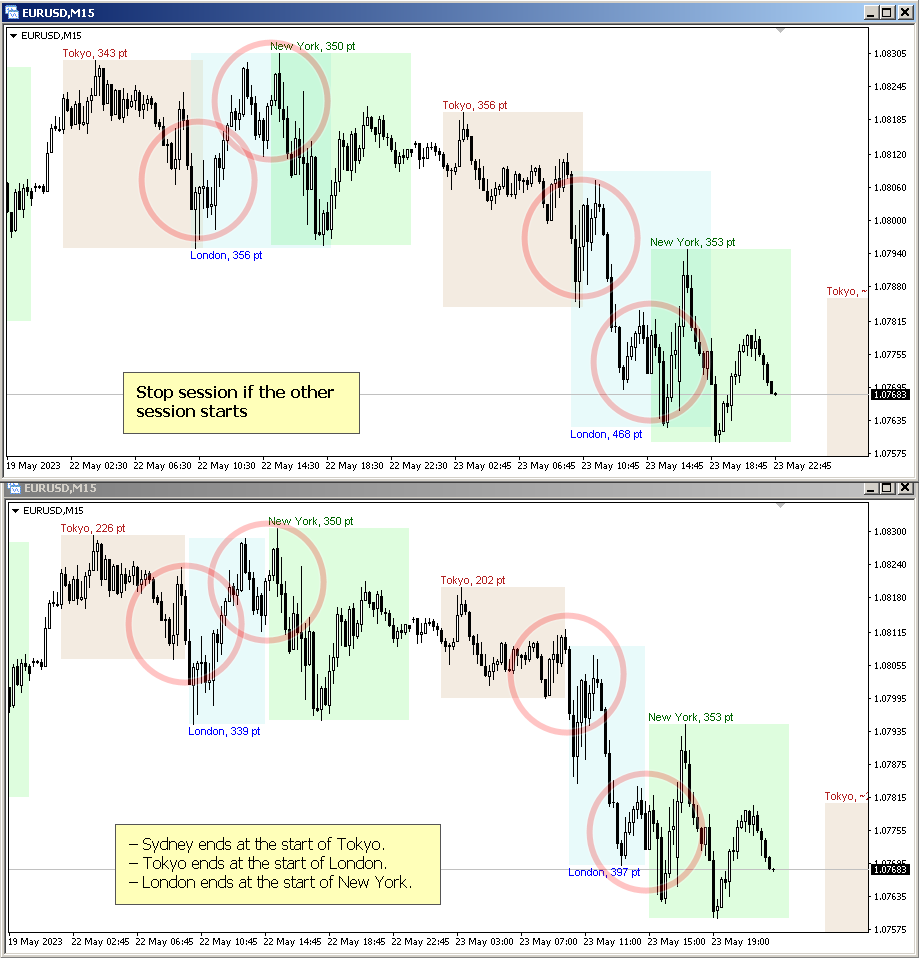
The parameter "Stop session if the other session starts" (hotkey 'S') allows you to stop a stale session and receive alerts when it breaks in a new session.
The indicator can draw Pivot levels and send alerts on them. These levels are calculated based on the values of previous sessions (default hotkey 'P')
Parameters
Number of days to draw.
Time Offset (add shift for all Sessions).
Show Future Sessions — show expected sessions in the future.
Show Open lines.
Show High lines.
Show Low lines.
Show Close lines.
Show Middle lines (between High-Low)
Extend lines to the next Session.
Show Rectangles High-Low.
Show Rectangles Open-Close.
Fill High-Low.
Fill Open-Close.
Show Vertical line at the begining.
Show Session Names.
Show Day of the week.
Show Session Range.
Show Percentage changes — show the percentage change in price between the open and close of the session or between the high and low of the session.
Stop session if the other session starts — Sydney ends at the start of Tokyo. Tokyo ends at the start of London.London ends at the start of New York.
Hotkey to switch 'Stop session'
Color scheme.
Session #1
Enable session.
Session name.
Start time (broker time).
End time (broker time).
Line color.
Line width.
Line style.
Fill High-Low color.
Fill Open-Close color.
Rectangle line color.
Rectangle line width.
Rectangle line style.
Vertical line color.
Vertical line width.
Vertical line style.
Text color.
Font name.
Font size.
Text label on the.
Hotkey to switch session.
The same parameters for Sessions #2, #3, #4.
Sessions Pivot
Show Pivot
Mode of the Pivot:
- Classic
- Woodie
- DeMark
- Camarilla
Show Future Pivot.
Average Session Range
Show ASR lines.
ASR period (num sessions to calculate the average).
The middle of the ASR is:
- at the Session Open
- between High-Low
- between Open-Close
- at the Session Close
Alerts
Check Current sessions (not closed yet)
Check Previous sessions (closed Today or Yesterday)
Alert when price touched 'Open'
Alert when price touched 'High'
Alert when price touched 'Low'
Alert when price touched 'Close'
Alert when price touched 'Middle'
Alert when price touched 'ASR'
Alert when price touched one of the Pivot levels
Check alerts only on bar closing
Alert when a New session starts
Alert when price breaks the closed Session by the Distance
Distance for the Session breakout
Pop up alert of the MT
Push notifications
E-mail notifications
Sound alert
Allow Session #1 alerts
Allow Session #2 alerts
Allow Session #3 alerts
Allow Session #4 alerts


Excellent indicator, easily the best on the market! The developer is also very responsive and quick to make updates when necessary.