• Overview
  • Reviews (5)
  • Comments (1)
  • What's new

Dashboard RSI Multicurrency for MT5

4.8

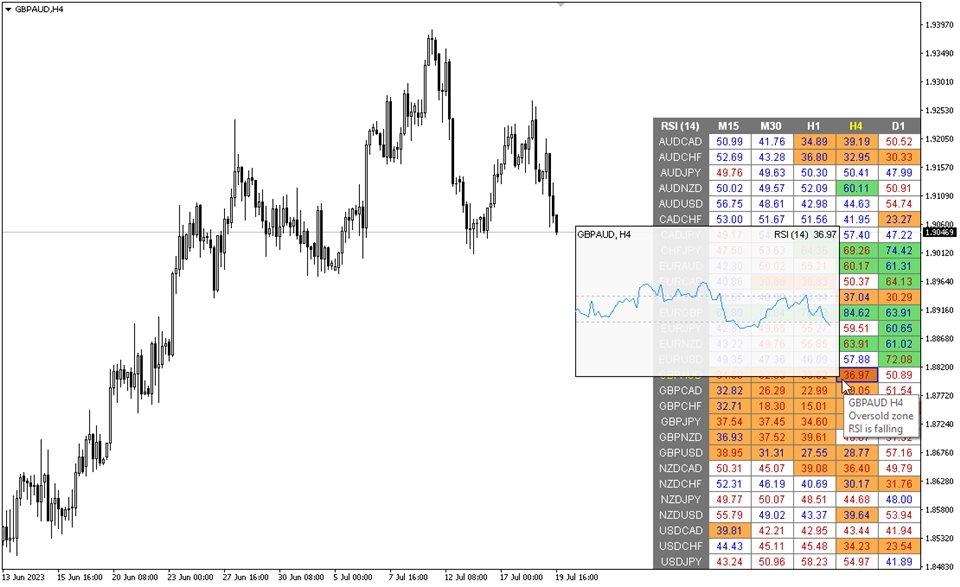
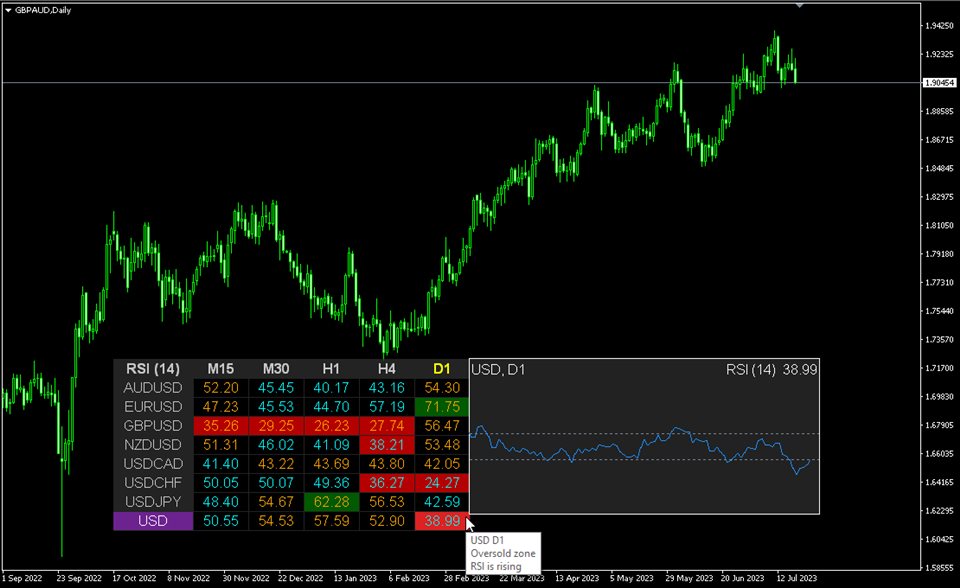
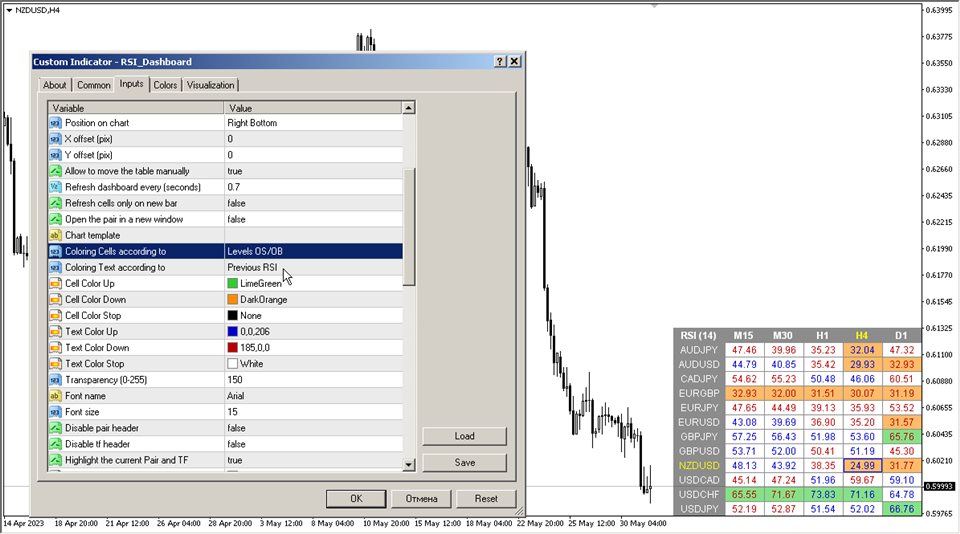
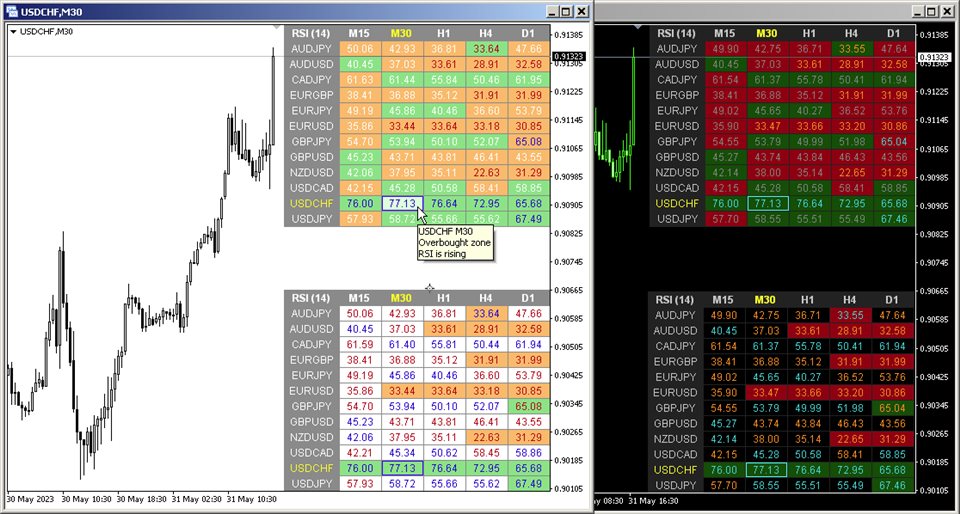
Multicurrency and multitimeframe modification of the Relative Strength Index (RSI) indicator. You can specify any desired currencies and timeframes in the parameters. Also, the panel can send notifications when crossing overbought and oversold levels. By clicking on a cell with a period, this symbol and period will be opened.


Parameters

RSI Period — averaging period.
RSI Applied price — price type.
Clear the chart at startup — clear the chart at startup.
Set of Pairs — set of symbols
       Market Watch — pairs from the "Market Watch".
       Specified manually — pairs specified manually, in the parameters "Pairs".
       Current pair — show only the current pair.
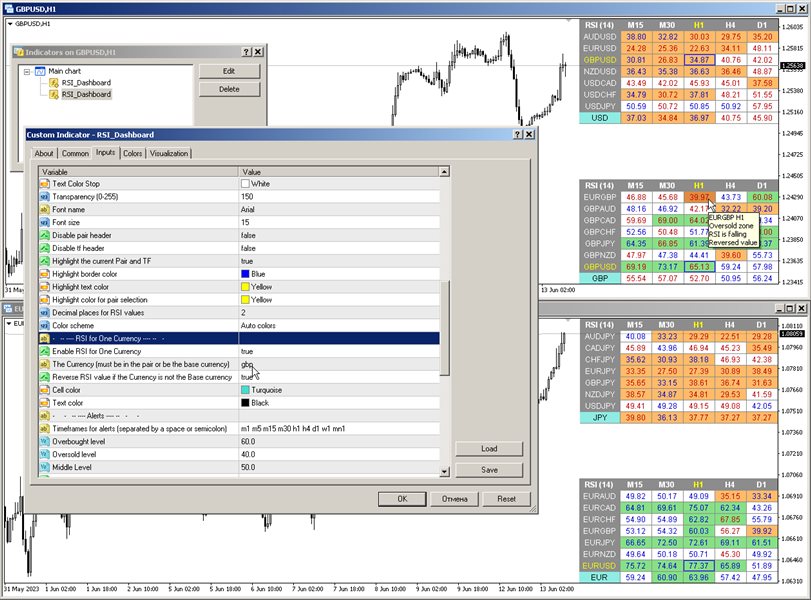
        Pairs (separated by a space or semicolon) — list of symbols separated by spaces or semicolons. The currency names should be written exactly like the broker's, keeping the case and prefix/suffix.
        Time Frames (separated by a space or semicolon) — list of timeframes separated by spaces or semicolons.
        Sort pairs — sorting the list of pairs.
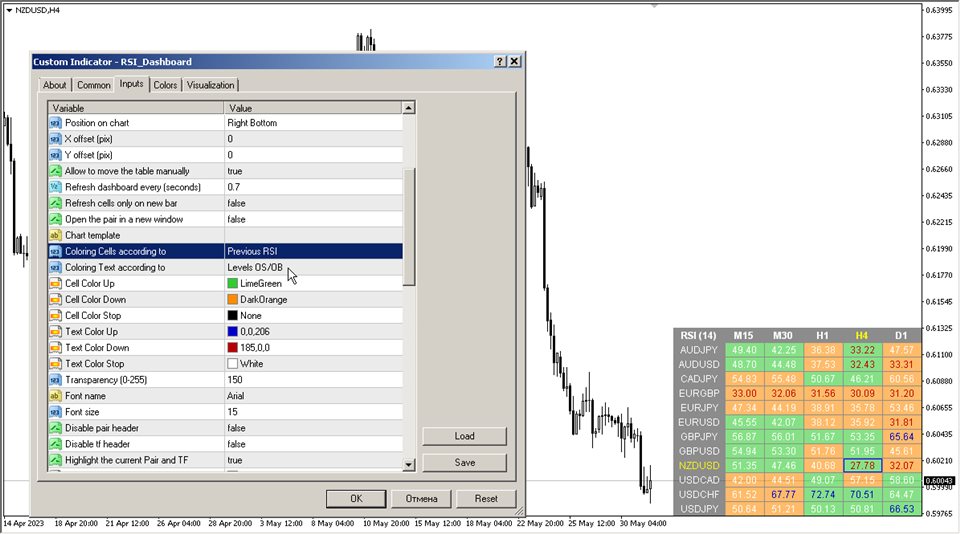
        Position on chart — corner to display the panel on the chart.
        X offset (pix) — shift the panel along the X axis;
        Y offset (pix) — shift the panel along the Y axis;
        Refresh dashboard every (seconds) — update period for all pairs and timeframes.
        Refresh cells only on new bar — cell updates (and alerts) will only occur when a new bar appears.
        Open the pair in a new window — open a symbol in a new chart window by clicking.
        Chart template — the name of the template for the chart, if the chart opens in a new window.
        Coloring the cells according to the — paint the cells of the table according to the levels of overbought/oversold or according to the direction of the previous candle.
        Color Up — cell color if the indicator increases.
        Color Down — cell color if the indicator decreases.
        Color Stop — cell color if the indicator does not change.
        Transparency (0-255) — transparency of the panel.
        Font name — font name.
        Font size — font size.
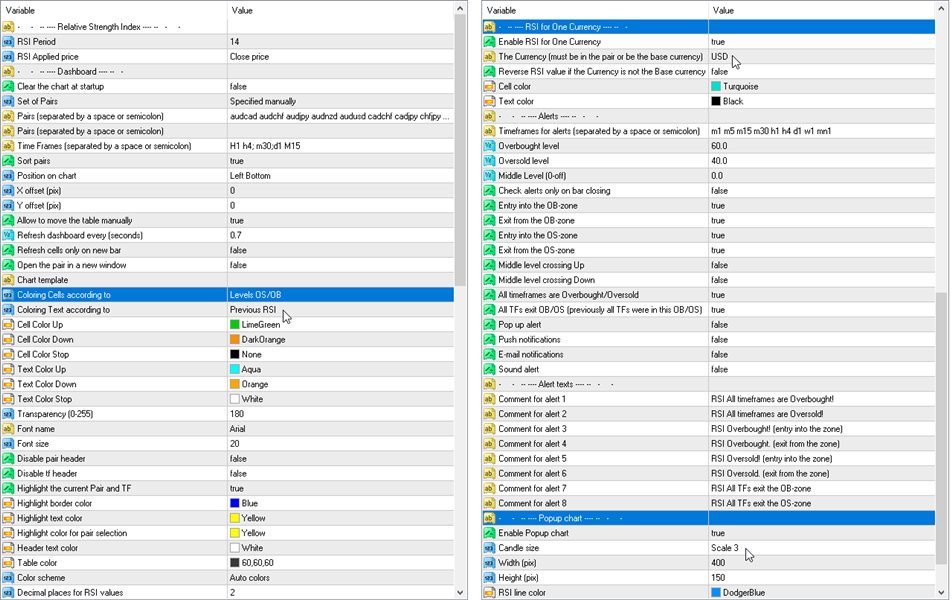
            Alerts
            Timeframes for alerts (separated by a space or semicolon) — list of periods for which the alert will be sent (separated by a space or semicolon).
            Overbought level — overbought level for alerts.
            Oversold level — oversold level for alerts.
            Check alerts only on bar closing — check level crossing only after bar closing.
            Overbought/Oversold (entry into the zone) — send alert when entering the overbought or oversold zone.
            Overbought/Oversold (exit from the zone) — send alert when leaving the overbought or oversold zone.
            All timeframes are Overbought/Oversold — alert when all periods enter the overbought or oversold zone.
            Pop up alert — pop-up alert.
            Push notifications — push notification.
            E-mail notifications — e-mail notification.
            Sound alert — sound alert.
              Reviews 5
              Mike Louw
              182
              Mike Louw 2022.10.12 15:54 
               

              Multi currency RSI dash is a great indicator to find extended market conditions, all in one place. I also use it as a mini operating system which is compact and can be nestled into a corner of a chart. Instead of having to drag symbols manually from the Market Watch window or switch between profiles, just click on any pair in the dash and the symbol changes instantly. With multiple timeframe windows, add a free ChartSync indicator and all change simultaneously. Parameter settings are extensive and the author is very accommodating. With version 3.2, I can highlight the name of a pair/s and make my own watch list. No more fumbling around...Thank you!

              Multi Disipliner
              347
              Multi Disipliner 2022.02.21 21:26 
               

              very nice. thanks

              Roberto Alencar
              1168
              Roberto Alencar 2020.05.04 15:12 
               

              The best

              Recommended products
              VPO Profile MT5
              Kyra Nickaline Watson-gordon
              Definition : VPO is a Volume Price Opportunity. Instead of using bars or candles with an Open, High, Low, and Close price, each "bar" in a Market Profile is represented by horizontal bars against the price It is called Market Profile terminology. In other words volume-price-opportunity (VPO) profiles are histograms of how many volumes were traded at each price within the span of the profile. By using a VPO chart, you are able to analyze the amount of trading activity, based on volume, for eac
              60 USD
              PZ Trend Trading MT5
              PZ TRADING SLU
              3.67 (3)
              Trend Trading is an indicator designed to profit as much as possible from trends taking place in the market, by timing pullbacks and breakouts. It finds trading opportunities by analyzing what the price is doing during established trends. [ Installation Guide | Update Guide | Troubleshooting | FAQ | All Products ] Trade financial markets with confidence and efficiency Profit from established trends without getting whipsawed Recognize profitable pullbacks, breakouts and early reversals The ind
              175 USD
              The indicator builds current quotes, which can be compared with historical ones and on this basis make a price movement forecast. The indicator has a text field for quick navigation to the desired date. Options: Symbol - selection of the symbol that the indicator will display; SymbolPeriod - selection of the period from which the indicator will take data; IndicatorColor - indicator color; Inverse - true reverses quotes, false - original view; Next are the settings of the te
              55 USD
              This indicator allows you to enjoy the two most popular products for analyzing request volumes and market deals at a favorable price: Actual Depth of Market Chart Actual Tick Footprint Volume Chart This product combines the power of both indicators and is provided as a single file. The functionality of Actual COMBO Depth of Market AND Tick Volume Chart is fully identical to the original indicators. You will enjoy the power of these two products combined into the single super-indicator! Below is
              40 USD
              DALA Forecast
              Grigorii Matsnev
              About the indicator: DALA Forecast is a universal tool for predicting the dynamics of time series of any nature. For prediction, modified methods of nonlinear dynamics analysis are used, on the basis of which a predictive model is built using machine learning methods.  To get the trial version of the indicator, you can contact me in private messages. How to use the indicator: Apply the indicator to your chosen financial instrument or indicator with the settings you need. The prediction will b
              30 USD
              This indicator is designed to determine the time of the greatest trading activity within a day. After this calculation, the indicator builds the most significant trading levels. Comparing these levels with actual price action can provide information about the strength and direction of market trends. Features of the indicator Timeframe must be below D1. Recommended timeframes: M15, M30 and H1. Timeframes above H1 can give a very rough picture. And the use of timeframes below M15 can lead to sh
              30 USD
              This indicator is the same as the popular Heiken Ashi Smoothed. The Heikin Ashi indicator for MetaTrader 5 already exists, but it has two disadvantages: It paints the candles not accurate. It's not possible to change the candle width. See also Heikin Ashi in MQL5 Code Base . In this version there are no such disadvantages.
              30 USD
              BoxChart MT5
              Evgeny Shevtsov
              5 (6)
              The market is unfair if only because 10% of participants manage 90% of funds. An ordinary trader has slim changes to stand against these "vultures". This problem can be solved. You just need to be among these 10%, learn to predict their intentions and move with them. Volume is the only preemptive factor that faultlessly works on any timeframe and symbol. First, the volume appears and is accumulated, and only then the price moves. The price moves from one volume to another. Areas of volume accumu
              33 USD
              Volume Profile V6
              Andrey Kolesnik
              4 (1)
              Market volume profile indicator.  It works on almost all instruments - currency pairs, stocks, futures, on real volumes and on ticks.  It can be set as automatic determination of the range of building a profile, for example, for a week or a month, etc.  and set the range manually by moving the borders (two vertical lines red and blue).  Shown as a bar graph.  The width of the histogram at a given level means, conventionally, the number of trades made on it.  With the "Mode level line color" para
              30 USD
              Blahtech Supply Demand MT5
              Blahtech Limited
              4.45 (11)
              Supply Demand uses previous price action to identify potential imbalances between buyers and sellers. The key is to identify the better odds zones, not just the untouched ones. Blahtech Supply Demand indicator delivers functionality previously unavailable on any trading platform. This 4-in-1 indicator not only highlights the higher probability zones using a multi-criteria strength engine, but also combines it with multi-timeframe trend analysis, previously confirmed swings and engulfing detecto
              99 USD
              A "Volume Profile" is an advanced charting indicator that displays total volume traded at every price level over a user specified time period. The main components of the volume profile are POC ( Point Of Control - the price level, at which the maximum number of contracts were executed during a selected period), VAH ( Value Area High - the highest price in the Value Area) and VAL ( Value Area Low - the lowest price in the Value Area). When we settled on the original indicator, we spent a lot o
              150 USD
              This indicator provides an original mix of WPR, VSA, and volume delta. It shows ratio of buy/sell volumes scaled on 100% range based on total volume change for a selected period. The convetional VSA (Volume Spread Analysis) studies interconnections of price action and volume change in absolute values, whereas WPR (Williams Percent Range) offers a convenient approach of price moves normalization into the fixed percentage metric: 0 - 100%. Hence overbough and oversold states are easily spotted. N
              30 USD
              US30NinjaMT5
              Satyaseelan Shankarananda Moodley
              US30 Ninja is a 5 minute scalping indicator that will let know you when there is a trade set up (buy or sell). Once the indicator gives the trade direction, you can open a trade and use a 30 pip stop loss and a 30 pip to 50 pip take profit. Please trade at own own risk. This indicator has been created solely for the US30 market and may not yield positive results on any other pair. 
              30 USD
              The Gann Box (or Gann Square) is a market analysis method based on the "Mathematical formula for market predictions" article by W.D. Gann. This indicator can plot three models of Squares: 90, 52(104), 144. There are six variants of grids and two variants of arcs. You can plot multiple squares on one chart simultaneously. Parameters Square — selection of a square model: 90 — square of 90 (or square of nine); 52 (104) — square of 52 (or 104); 144 — universal square of 144; 144 (full) — "full"
              52 USD
              Premium level is a unique indicator with more than 80% accuracy of correct predictions! This indicator has been tested for more than two months by the best Trading Specialists! The author's indicator you will not find anywhere else! From the screenshots you can see for yourself the accuracy of this tool! 1 is great for trading binary options with an expiration time of 1 candle. 2 works on all currency pairs, stocks, commodities, cryptocurrencies Instructions: As soon as the red ar
              1 100 USD
              Trend Fibonacci is a unique indicator that combines a power of Fibonacci sequences and ranges. How to read: - There are three zones --> red, gold and green - Red candlestick = downtrend - Green candlestick = uptrend   - Gold candlestick = no established trend Inputs: Per = number of bars used for calculations FirstRatio = first Fibonacci ratio (Or use any ratio you want) SecondRatio = second Fibonacci ratio (Or use any ratio you want) !! IF YOU PURCHASE THE INDICATOR, CONTACT ME FOR
              47 USD
              This indicator shows a candle combination based on dodge, dodge and pin bar. The logic of the pattern is to stand on the side of strength, after uncertainty. The indicator is universal and is useful for trading binary options, forex, ETFs, cryptocurrency, stocks. The indicator supports timeframes from M5 to MN, including non-standard TF presented in MT5. (М5,М6,М10,M12, M15, M20, M30, H1, H2, H3, H4, H6, H8, H12, D1, W1, MN). The ability to enable and disable TF is implemented. Sound alerts and
              450 USD
              Market profile was developed by Peter Steidlmayer in the second half of last century. This is a very effective tool if you understand the nature and usage. It's not like common tools like EMA, RSI, MACD or Bollinger Bands. It operates independently of price, not based on price but its core is volume. The volume is normal, as the instrument is sung everywhere. But the special thing here is that the Market Profile represents the volume at each price level. 1. Price Histogram The Price Histogram
              50 USD
              Order Book, known also as Market Book, market depth, Level 2, - is a dynamically updated table with current volumes of orders to buy and to sell specific financial instument at price levels near Bid and Ask. MetaTrader 5 provides the means for receiving market book from your broker, but in real time only, without access to its history. The indicator OrderBook Cumulative Indicator accumulates market book data online and visualizes them on the chart. In addition, the indicator can show the market
              49 USD
              This indicator is used to compare the relative strength of the trade on the chart against the other several selected symbols. By comparing the price movement of each traded variety based on the same base day, several trend lines of different directions can be seen, reflecting the strong and weak relationship between the several different traded varieties, so that we can have a clearer understanding of the market trend. For example, you can apply this indicator on a EurUSD chart and compare it
              30 USD
              VolumeDeltaBars
              Stanislav Korotky
              This indicator is a conventional analytical tool for tick volumes changes. It calculates tick volumes for buys and sells separately, and their delta on every bar, and displays volumes by price clusters (cells) within a specified bar (usually the latest one). The algorithm used internally is the same as in the indicator VolumeDeltaMT5 , but results are shown as cumulative volume delta bars (candlesticks). Analogous indicator for MetaTrader 4 exists - CumulativeDeltaBars . This is a limited substi
              30 USD
              Strong Support mt5
              Vasiliy Strukov
              5 (7)
              Support and resistance levels have long been a powerful tool for market analysis. The Strong Support indicator plots support levels based on local price minima, and resistance levels based on local price maxima. My other developments can be viewed   here It is recommended to use together with a trend indicator, for example, Gold Stuff - this will allow you to trade according to the trend and simultaneously determine the zones of consolidation or trend reversal, as well as set stop loss and
              50 USD
              Tunafish EA
              Ismaele Daniele Lodetti
              Tunafish EA is the most efficient EA on my profile. I spent a lot of time and effort to make this software sophisticated with possibilities of high potential returns while keeping the drawdown below 25%. The algorithms of the robot provide investors of any level of training with an investment opportunity that is both safe and aggressive. Tunafish EA imitating the work of the brain, capable of learning and adapting to changing conditions and predicting situations. When applied to trading in fina
              69 USD
              VolumeProfile MT5
              Robert Hess
              3.33 (6)
              Description: The Volume Profile displays detailed informations of historical trading activities at certain price levels (Market Profile). Locate the areas with the best prices in the market and get an advantage over other market participants. Support: The indicator is constantly being developed and improved. Please do not hesitate to contact me via the MQL5 Platform. I am very grateful about any Bug report, so that i can constantly improve the indicator. I appreciate any public review for this
              140 USD
              Why Our Indicators? 1. At our service, we offer the lowest prices possible without compromising on quality or features. 2. Enjoy premium features and top-notch quality trading tools at an affordable price point. 3. With up to 100 activations, you can use our tools on multiple devices without extra cost. 4. Our mission is to provide powerful trading tools to everyone, regardless of their budget. 5. Join us today and discover the best value in the market for high-quality trading tools. Current P
              30 USD
              This indicator displays filtered price information in the form of three colored histograms and one common colored line. This is a very colorful and beautiful indicator. Great for determining the strength and direction of price movement. This indicator has very simple settings: 1) choice of three options for calculating the indicator: - original, - demarker, - balance volume. 2) selection of five different periods. 3) selection of the displayed color. 4) choice of accuracy. /////////////////////
              30 USD
              The   Supply and Demand Zones indicator   is one of the best tools we have ever made. This great tool automatically draws supply and demand zones, the best places for opening and closing positions. It has many advanced features such as multi timeframe zones support, displaying the width of zones, alert notifications for retouched zones, and much more. Because of market fractality, this indicator can be used for any kind of trading. Whether you are a positional, swing, or intraday trader does no
              99 USD
              No Demand No Supply MT5
              Trade The Volume Waves Single Member P.C.
              No Demand No Supply   This indicator identifies   No Demand –No Supply candles  to your chart and plots volume bars colored according to the signal. It can be applied to all timeframes or to a specific one only. It can also be used as regular volume indicator  with exceptional future of WEIGHTED VOLUME. Furthermore is has an alert notification, sound and email when a signals occurs. The indicator does not repaint but the alert will come on two candles back due to the definition of No Demand No S
              80 USD
              Cumulative delta indicator As most traders believe, the price moves under the pressure of market buying or selling. When someone redeems an offer standing in the cup, the deal is a "buy". If someone pours into the bid standing in the cup - the deal goes with the direction of "sale". The delta is the difference between purchases and sales. A cumulative delta - the difference between the cumulative sum of purchases and sales for a certain period of time. It allows you to see who is currently contr
              50 USD
              Currency Strength Meter is the easiest way to identify strong and weak currencies. This indicator shows the relative strength of 8 major currencies + Gold: AUD, CAD, CHF, EUR, GBP, JPY, NZD, USD, XAU. Gold symbol can be changed to other symbols like XAG, XAU etc. By default the strength value is normalised to the range from 0 to 100 for RSI algorithm: The value above 60 means strong currency; The value below 40 means weak currency; This indicator needs the history data of all 28 major curren
              42 USD
              Buyers of this product also purchase
              Top indicator for MT5   providing accurate signals to enter a trade without repainting! It can be applied to any financial assets: forex, cryptocurrencies, metals, stocks, indices .  MT4 version is here It will provide pretty accurate trading signals and tell you when it's best to open a trade and close it. Watch  the video  (6:22) with an example of processing only one signal that paid off the indicator! Most traders improve their trading results during the first trading week with the help of
              125 USD
              ICT, SMC, SMART MONEY CONCEPTS, SMART MONEY, Smart Money Concept, Support and Resistance, Trend Analysis, Price Action, Market Structure, Order Blocks, BOS/CHoCH,   Breaker Blocks ,  Momentum Shift,   Supply&Demand Zone/Order Blocks , Strong Imbalance,   HH/LL/HL/LH,    Fair Value Gap, FVG,  Premium  &   Discount   Zones, Fibonacci Retracement, OTE, Buy Side Liquidity, Sell Side Liquidity, BSL/SSL Taken, Equal Highs & Lows, MTF Dashboard, Multiple Time Frame, BigBar, HTF OB, HTF Market Structur
              65 USD
              Gold Stuff mt5
              Vasiliy Strukov
              4.97 (109)
              Gold Stuff mt5 is a trend indicator designed specifically for gold and can also be used on any financial instrument. The indicator does not redraw and does not lag. Recommended time frame H1. Contact me immediately after the purchase to get the settings and a personal bonus!  SETTINGS Draw Arrow - on off. drawing arrows on the chart. Alerts -   on off audible alerts. E-mail notification - on off. email notifications. Puch-notification - on off. Push notifications. Next, adjust the color gamut.
              50 USD
              Trend Screener Pro MT5
              STE S.S.COMPANY
              4.87 (38)
              Trend Indicator, Breakthrough  unique Solution For Trend Trading And Filtering With All Important trend Features Built Inside One Tool!   It's 100% non-repainting multi-timeframe and Multi-currencies indicator that can be used on all symbols/instruments: forex, commodities, cryptocurrencies, indices and stocks. LIMITED TIME OFFER : Trend Screener Indicator is available for only 50 $ and lifetime. ( Original price 125$ )  (offer extended) Trend Screener is an efficient indicator trend following
              50 USD
              AW Trend Predictor MT5
              Alexander Nechaev
              5 (34)
              The combination of trend and breakdown levels in one system. An advanced indicator algorithm filters market noise, determines the trend, entry points, as well as possible exit levels. Indicator signals are recorded in a statistical module, which allows you to select the most suitable tools, showing the effectiveness of the signal history. The indicator calculates Take Profit and Stop Loss marks. Manual and instruction ->  HERE  / MT4 version ->  HERE How to trade with the indicator:  Trading wit
              55 USD
              This is arguably the most complete harmonic price formation auto-recognition indicator you can find for the MetaTrader Platform. It detects 19 different patterns, takes fibonacci projections as seriously as you do, displays the Potential Reversal Zone (PRZ) and finds suitable stop-loss and take-profit levels. [ Installation Guide | Update Guide | Troubleshooting | FAQ | All Products ] It detects 19 different harmonic price formations It plots primary, derived and complementary Fibonacci p
              249 USD
              Matrix Arrow Indicator MT5
              Juvenille Emperor Limited
              5 (11)
              Matrix Arrow Indicator MT5  is a unique 10 in 1 trend following   100% non-repainting  multi-timeframe indicator that can be used on all symbols/instruments:   forex,   commodities,   cryptocurrencies,   indices,   stocks .  Matrix Arrow Indicator MT5  will determine the current trend at its early stages, gathering information and data from up to 10 standard indicators, which are: Average Directional Movement Index (ADX) Commodity Channel Index (CCI) Classic Heiken Ashi candles Moving Aver
              75 USD
              Advanced Supply Demand MT5
              Bernhard Schweigert
              4.42 (12)
              Best Solution for any Newbie or Expert Trader! This indicator is a unique, high quality and affordable trading tool because we have incorporated a number of proprietary features and a new formula. With this update, you will be able to show double timeframe zones. You will not only be able to show a higher TF but to show both, the chart TF, PLUS the higher TF: SHOWING NESTED ZONES. All Supply Demand traders will love it. :) Important Information Revealed Maximize the potential of Advanced Suppl
              199 USD
              Owl Smart Levels MT5
              Sergey Ermolov
              5 (7)
              Indicator Guide   |   Owl Smart Levels Strategy   |   MT4 version  |  How to install?   |   FAQ The Owl Smart Levels Indicator is a complete trading system within the one indicator that includes such popular market analysis tools as Bill Williams' advanced fractals , Valable ZigZag which builds the correct wave structure of the market, and Fibonacci levels which mark the exact levels of entry into the market and places to take profits. For a detailed description of the trading system, see the a
              97 USD
              Profit from market structure changes as price reverses and pulls back. The market structure reversal alert indicator identifies when a trend or price move is approaching exhaustion and ready to reverse. It alerts you to changes in market structure which typically occur when a reversal or major pullback are about to happen. The indicator identifies breakouts and price momentum initially, every time a new high or low is formed near a possible exhaustion point. The indicator draws in a rectangle on
              49 USD
              TPA True Price Action indicator reveals the true price action of the market makers through 100% non-repainting signals strictly at the close of a candle! TPA shows entries and re-entries, every time the bulls are definitely stronger than the bears and vice versa. Not to confuse with red/green candles. The shift of power gets confirmed at the earliest stage and is ONE exit strategy of several. There are available now two free parts of the TPA User Guide for our customers. The first "The Basics"
              168 USD
              Volume by Price MT5
              Brian Collard
              5 (2)
              The Volume by Price Indicator for MetaTrader 5 features Volume Profile and Market Profile TPO (Time Price Opportunity). Get valuable insights out of currencies, equities and commodities data. Gain an edge trading financial markets. Volume and TPO histogram bar, line and metric charts. TPO letter and block marker charts including split structures. Positioning and styling options to suit the user's needs and context. Volume Profile and Market Profile TPO Point of Control (VPOC and TPOC), Imbalanc
              179.95 USD
              PZ Swing Trading MT5
              PZ TRADING SLU
              5 (4)
              Swing Trading is the first indicator designed to detect swings in the direction of the trend and possible reversal swings. It uses the baseline swing trading approach, widely described in trading literature. The indicator studies several price and time vectors to track the aggregate trend direction and detects situations in which the market is oversold or overbought and ready to correct. [ Installation Guide | Update Guide | Troubleshooting | FAQ | All Products ] Profit for market swings with
              175 USD
              Auto Order Block with break of structure Detect Break of Structure , Mark Order Block and draw Entry / Stop and Risk to Reward lines when Order block is touch by price with Alert. Trend is Manually set to filter signals in a direction by a button on the chart. Entry / Stop and Risk to Reward lines can also be switch on / off by button on chart. Futures Auto Mark Break of Structure Auto Mark Order block Auto Mark higher time frame Point Of  Interest ( POI ) Popup Alert when BoS , Order block
              55 USD
              Automatically draw support and resistance levels   PLUS   propulsion candle gaps on your chart, so you can see where price is likely to head next and/or potentially reverse. This indicator is designed to be used as part of the position trading methodology taught on my website (The Market Structure Trader) and displays key information for targeting and potential entries. MT4 Version:  https://www.mql5.com/en/market/product/97246/ There are 2 CORE features in the indicator and 4 additional ones:
              49 USD
              Trend Line Map Pro MT5
              STE S.S.COMPANY
              4.8 (5)
              Trend Line Map indicator is an addons for   Trend Screener Indicator . It's working as a scanner for all signals generated by Trend screener ( Trend Line Signals ) . It's a Trend Line Scanner based on Trend Screener Indicator.  If you don't have Trend Screener Pro Indicator,   the Trend Line Map Pro will not work.     LIMITED TIME OFFER : Trend Line Map Indicator is available for only 50 $ and lifetime. ( Original price 125$ ) By accessing to our MQL5 Blog,  you can find all our premium indica
              50 USD
              Support And Resistance Screener Breakthrough unique Solution With All Important levels analyzer and Markets Structures Feature Built Inside One Tool ! Our indicator has been developed by traders for traders and with one Indicator you will find all Imporant market levels with one click. LIMITED TIME OFFER : Support and Resistance Screener Indicator is available for only 50 $ and lifetime. ( Original price 125$ ) (offer extended) The available tools ( Features ) in our Indicator are :  1. HH-LL
              50 USD
              ACB Breakout Arrows MT5
              KEENBASE SOFTWARE SOLUTIONS
              5 (1)
              The ACB Breakout Arrows indicator provides a crucial entry signal in the market by detecting a special breakout pattern. The indicator constantly scans the chart for a settling momentum in one direction and provide the accurate entry signal right before the major move. Get multi-symbol and multi-timeframe scanner from here - Scanner for ACB Breakout Arrows MT 5 Key features Stoploss   and Take Profit levels are provided by the indicator. Comes with a MTF Scanner dashboard which tracks the br
              145 USD
              Blahtech VWAP - Volume Weighted Average Price (VWAP) is the ratio of price to total volume. It provides an average price over a specified time interval.  Links [  Install  |  Update  |  Documentation   ] Feature Highlights Configurable VWAP Line Sessions, intervals, anchored or continuous Previous day settlement line Standard Deviation bands Alerts at bar close or real time Automatic Broker or Tick volumes Significantly reduced CPU usage Input Parameters Max Bars   - Restrict the number of
              49 USD
              Trend Scanner mt5 GS
              Vasiliy Strukov
              5 (11)
              Trend Scanner mt5 scans market trends from Multi-Symbols and Multi-Time frames and displays it on a movable panel on the chart. It uses  Gold stuff indicator   for analysis .The trader can select multiple pairs of his choice for display.   Trend Scanner is a great tool to see the direction of the trend and can be used for manual trading or EA trading by allowing only buy or sell orders according to the trend. Real-time results can be viewed  here . Contact me immediately after the purchase to g
              50 USD
              Market Profile defines a number of day types that can help the trader to determine market behaviour. A key feature is the Value Area, representing the range of price action where 70% of trading took place. Understanding the Value Area can give traders valuable insight into market direction and establish the higher odds trade. It is an excellent addition to any system you may be using. Blahtech Limited presents their Market Profile indicator for the MetaTrader community. Inspired by Jim Dalton’s
              99 USD
              Royal Wave Pro M5
              Vahidreza Heidar Gholami
              3.67 (3)
              Royal Wave is a Trend-Power oscillator which has been programmed to locate and signal low-risk entry and exit zones. Its core algorithm statistically analyzes the market and generates trading signals for overbought, oversold and low volatile areas. By using a well-designed alerting system, this indicator makes it easier to make proper decisions regarding where to enter and where to exit trades. Features Trend-Power Algorithm Low risk Entry Zones and Exit Zones Predictions for Overbought and Over
              129 USD
              FX Power MT5
              Daniel Stein
              4.3 (23)
              Get your daily market update with details and screenshots via our Morning Briefing  here on mql5  and  on Telegram ! Do you want to become a constantly profitable 5-star forex trader? Then  get our Stein Investments trading tools  and send us a screenshot to get your personal invitation to our exclusive trading chat with 500+ members. FX Power   is the first currency strength meter with a complete history across all time frames. It analyzes the momentum and strength of all major currencies
              66 USD
              FX Volume MT5
              Daniel Stein
              4.77 (13)
              Get your daily market update with details and screenshots via our Morning Briefing  here on mql5  and  on Telegram ! Do you want to become a constantly profitable 5-star forex trader? Then  get our Stein Investments trading tools  and send us a screenshot to get your personal invitation to our exclusive trading chat with 500+ members. FX Volume is the FIRST and ONLY volume indicator that provides a REAL insight into the market sentiment from a broker's point of view. It provides awesome insig
              33 USD
              Market Structure MT5
              Reza Aghajanpour
              5 (2)
              **   All Symbols   x   All Timeframes   scan just by pressing scanner button ** *** Contact me immediately after the purchase to send you instructions and add you in "Market Structure group" for sharing or seeing experiences with other users. CURRENT PRICE $39..... Future Price $200 Introduction: Market structure is important for both new and professional traders since it can influence the liquidity and price action of a market. It’s also one of the most commonly used techniques to understand tr
              39 USD
              Legacy of Gann for MT5
              Pavel Zamoshnikov
              5 (2)
              The indicator very accurately determines the levels of the possible end of the trend and profit fixing. The method of determining levels is based on the ideas of W.D.Gann, using an algorithm developed by his follower Kirill Borovsky. Extremely high reliability of reaching levels (according to K. Borovsky  - 80-90%) Indispensable for any trading strategy – every trader needs to determine the exit point from the market! Precisely determines targets on any timeframes and any instruments (forex, met
              65 USD
              The ADR Alert Dashboard shows you at a glance where price is currently trading in relation to it's normal average daily range. You will get instant alerts via pop-up, email or push when price exceeds it's average range and levels above it of your choosing so you can jump into pullbacks and reversals quickly. The dash is designed to be placed on a blank chart and just sit in the background and alert you when levels are hit so you do not need to sit and watch it or even look at all! MT4 VERSION AV
              49 USD
              Italo Volume Indicator MT5
              Italo Santana Gomes
              4.69 (13)
              BUY INDICATOR AND GET EA FOR FREE AS A BONUS + SOME OTHER GIFTS! ITALO VOLUME INDICATOR  is the best volume indicator ever created, and why is that? The Indicator works on all time-frames and assets, indicator built after 6 years of experience on forex and many other markets. You know many volume indicators around the internet are not complete, does not help, and it's difficult to trade, but the Italo Volume Indicator is different , the Italo Volume Indicator shows the wave volume, when market
              65 USD
              AI Forecast MT5
              Leonardo Antonio Camacaro Armas
              The "AI Forecast" indicator is the result of a unique experiment in which I asked an AI how to create the best indicator to anticipate the market. The AI suggested measuring the past history of the price and its reactions to different levels, and then calculating the probabilities of the price reaction in the future. With this idea, I designed with the help of another AI the "AI Forecast" indicator, which adapts to any MetaTrader chart and shows you three lines: one for entry and two for poss
              150 USD
              The ADR Reversal Indicator shows you at a glance where price is currently trading in relation to it's normal average daily range. You will get instant alerts via pop-up, email or push when price exceeds it's average range and levels above it of your choosing so you can jump into pullbacks and reversals quickly. The indicator draws horizontal lines on the chart at the average daily range extremes and also extensions above those levels which have mathematical probabilities attached to them of pric
              49 USD
              More from author
              Multi-currency and multi-timeframe Heikin Ashi indicator. Shows the current state of the market. On the scanner panel you can see the direction, strength and number of bars of the current trend. The Consolidation/Reversal candles are also shown using color. You can specify any desired currencies and periods in the parameters. Also, the indicator can send notifications when the trend changes or when reversal and consolidation candles (dojis) appear. By clicking on a cell, this symbol and period w
              30 USD
              ZigZag Lines MTF for MT5
              Taras Slobodyanik
              5 (7)
              Multitimeframe ZigZag indicator. It displays the support/resistance lines and their breakouts, as well as draws the current targets of the market. It can also display lines of the Fractals indicator and candles from other periods (up to Quarterly).  The indicator redraws the last (current) point, and in some cases can change the last 2-3 points. All lines are drawn as objects (not indicator buffers, but there is a possibility to receive the data for the EA ). When used in an Expert Advisor,
              35 USD
              Multicurrency and multitimeframe modification of the Stochastic Oscillator. You can specify any desired currencies and timeframes in the parameters. The indicator displays the current values and intersections of the lines — Signal and Main. Also, the indicator can send notifications when crossing overbought and oversold levels. By clicking on a cell with a period, this symbol and period will be opened. Parameters %K Period — the period of the K line. %D Period — the period of the D line. Slow
              35 USD
              Pro Sessions MT5
              Taras Slobodyanik
              This is an indicator of trading sessions  that can display all levels (Open-High-Low-Close) for four sessions. Sessions can be drawn with lines or rectangles (empty or filled), lines can be extended to the next session.   You can easily hide/show each session by pressing hotkeys (by default '1', '2', '3', '4'). You can see ASR (Average Session Range) lines  (default hotkey 'A'). This is similar to the ADR calculation, only it is calculated based on the last X-sessions, which allows you to see t
              35 USD
              Multicurrency and multitimeframe indicator of the Standard Deviation Channel. Displays the current direction of the market. On the panel, you can see breakouts and touches (by price) of the levels of the linear regression channel. In the parameters, you can specify any desired currencies and timeframes. Also, the indicator can send notifications when levels are touched. By clicking on a cell, this symbol and period will be opened. «Standard Deviation Channel is built on base of Linear Regressio
              30 USD
              Multi-currency and multi-timeframe Heikin Ashi indicator. Shows the current state of the market. On the scanner panel you can see the direction, strength and number of bars of the current trend. The Consolidation/Reversal candles are also shown using color. You can specify any desired currencies and periods in the parameters. Also, the indicator can send notifications when the trend changes or when reversal and consolidation candles (dojis) appear. By clicking on a cell, this symbol and period w
              30 USD
              ADX Dashboard
              Taras Slobodyanik
              5 (3)
              ADX indicator is used to determine the trend and its strength. The direction of the price is shown by the +DI and -DI values, and the ADX value shows the strength of the trend. If +DI is above -DI, then the market is in an uptrend, if on the contrary, it is a downtrend. If ADX is below 20, then there is no definite direction. As soon as the indicator breaks this level, a medium-strength trend begins. Values above 40 indicate a strong trend (a downtrend or an uptrend). Multicurrency and multit
              35 USD
              Multicurrency and multitimeframe modification of the indicator Bollinger Bands. On the dashboard you can see breakouts and touches of the Bollinger Bands. In the parameters you can specify any desired currencies and timeframes. The indicator can also send notifications when touching Bollinger Bands. By clicking on a cell with a period, this symbol and period will be opened. Parameters Bollinger Bands Settings Averaging period — averaging period for calculating the indicator. Standard deviati
              30 USD
              Easy Grider
              Taras Slobodyanik
              4.5 (2)
              The EA creates an order grid using labels. Opening and closing of the grid is done either automatically by the system signals or manually. In the same grid can be both Limit and Stop orders. It is possible to reverse the grid on specified condition. You can enter the breakdown/rebound from established levels. All types of Sell limit, Buy limit, Buy stop, Sell stop orders are supported. The grid is rebuilt with a single click. The stop loss and take profit lines can be easily modified. You are fr
              150 USD
              Multicurrency and multitimeframe modification of the Stochastic Oscillator. You can specify any desired currencies and timeframes in the parameters. The indicator displays the current values and intersections of the lines — Signal and Main. Also, the indicator can send notifications when crossing overbought and oversold levels. By clicking on a cell with a period, this symbol and period will be opened. Parameters %K Period — the period of the K line. %D Period — the period of the D line. Slow
              35 USD
              Lines Profit Loss
              Taras Slobodyanik
              4.76 (17)
              The indicator displays profit (loss) on the current symbol. You can freely drag and drop the line to display the current profit or loss. Parameters Calculation in money or in points — calculate the profit/loss in points or money. Add pending orders to calculate — take pending orders into account in calculations. Magic Number (0 - all orders on symbol) — magic number, if it is necessary to evaluate specific orders. Offset for first drawing (points from the average price) — offset of the line fr
              FREE
              ZigZag Lines MTF
              Taras Slobodyanik
              4.11 (9)
              Multitimeframe ZigZag indicator. It displays the support/resistance lines and their breakouts, as well as draws the current targets of the market. It can also display lines of the Fractals indicator and candles from other periods (up to Quarterly).  The indicator redraws the last (current) point, and in some cases can change the last 2-3 points. All lines are drawn as objects (not indicator buffers, but there is a possibility to receive the data for the EA ). When used in an Expert Advisor,
              35 USD
              Lines Profit Loss MT5
              Taras Slobodyanik
              4.6 (10)
              The indicator displays profit (loss) on the current symbol. You can freely drag and drop the line to display the current profit or loss. Parameters Calculation in money or in points — calculate the profit/loss in points or money. Add pending orders to calculate — take pending orders into account in calculations. Magic Number (0 - all orders on symbol) — magic number, if it is necessary to evaluate specific orders. Offset for first drawing (points from the average price) — offset of the line f
              FREE
              News Dashboard MT4
              Taras Slobodyanik
              4.33 (6)
              This dashboard displaying current news from ForexFactory.com (calendar FFC) and from the Investing.com website . You can sort news by impact and by country, and display them on the chart with one click. By holding down the 'Ctrl' key, you can select several different 'currencies' or 'impacts' to sort. Also, this utility shows not only the forecast, but also the actual values ​​after they appear on the site. You can set a separate notification for each news. You can read the news using your EA
              49 USD
              Multicurrency and multitimeframe modification of the Relative Strength Index (RSI) indicator. You can specify any desired currencies and timeframes in the parameters. Also, the panel can send notifications when crossing overbought and oversold levels. By clicking on a cell with a period, this symbol and period will be opened. Parameters RSI Period — averaging period. RSI Applied price — price type. Clear the chart at startup — clear the chart at startup. Set of Pairs — set of symbols —
              30 USD
              Multicurrency and multitimeframe indicator Inside Bar (IB). In the parameters, you can specify any desired currencies and timeframes. The indicator displays the last found Inside Bar (and Mother Bar) pattern, the current price position and the breakout of the levels of the Mother and Inside Bars. You can set the size and color for bars and text in the cells. The indicator can also send notifications when levels are broken. By clicking on a cell with a period, the specified symbol and period wil
              30 USD
              ADX indicator is used to determine the trend and its strength. The direction of the price is shown by the +DI and -DI values, and the ADX value shows the strength of the trend. If +DI is above -DI, then the market is in an uptrend, if on the contrary, it is a downtrend. If ADX is below 20, then there is no definite direction. As soon as the indicator breaks this level, a medium-strength trend begins. Values above 40 indicate a strong trend (a downtrend or an uptrend). Multicurrency and multit
              35 USD
              Pro Sessions MT4
              Taras Slobodyanik
              3 (1)
              This is an indicator of trading sessions  that can display all levels (Open-High-Low-Close) for four sessions. Sessions can be drawn with lines or rectangles (empty or filled), lines can be extended to the next session.   You can easily hide/show each session by pressing hotkeys (by default '1', '2', '3', '4'). You can see ASR (Average Session Range) lines  (default hotkey 'A'). This is similar to the ADR calculation, only it is calculated based on the last X-sessions, which allows you to see t
              35 USD
              MA Dashboard MT5
              Taras Slobodyanik
              5 (1)
              Multicurrency and multitimeframe modification of the indicator Moving Average (MA). On the dashboard you can see the current state of the indicator - breakouts and touches (by price) of the Fast MA and Slow MA, as well as the intersection of the MA lines between each other. In the parameters you can specify any desired currencies and timeframes. Also, the indicator can send notifications about the price touching the lines and about their crossing. By clicking on a cell with a period, this symbol
              30 USD
              Inside Bar MT4
              Taras Slobodyanik
              4 (4)
              The indicator determines the inside bar and marks its High/Low. It is plotted based on the closed candles (does not redraw). The identified inside bar can be displayed on the smaller periods. You may set a higher period (to search for the inside bar) and analyze on a smaller one. Also you can see the levels for Mother bar. Indicator Parameters Period to find Inside Bar — the period to search for the inside bar. If a specific period is set, the search will be performed in that period. Type of i
              30 USD
              ZigZag Dashboard for MT4
              Taras Slobodyanik
              5 (3)
              Multicurrency and multitimeframe modification of the ZigZag indicator. Displays the current direction of the market, the height of the last movement, the number of bars in this movement and the breaking of the previous point of the ZigZag. You can specify any desired currencies and timeframes in the parameters. Also, the panel can send notifications when the ZigZag changes direction or when there was a breakthrough of the previous point. By clicking on a cell with a period, this symbol and pe
              35 USD
              Gann Square of 144
              Taras Slobodyanik
              4.43 (7)
              The Gann Box (or Gann Square) is a market analysis method based on the "Mathematical formula for market predictions" article by W.D. Gann. This indicator can plot three models of Squares: 90, 52(104), 144. There are six variants of grids and two variants of arcs. You can plot multiple squares on one chart simultaneously. Parameters Square — selection of a square model: 90 — square of 90 (or square of nine); 52 (104) — square of 52 (or 104); 144 — universal square of 144; 144 (full) — "full"
              49 USD
              MA Dashboard
              Taras Slobodyanik
              4.5 (2)
              Multicurrency and multitimeframe modification of the indicator Moving Average (MA). On the dashboard you can see the current state of the indicator - breakouts and touches (by price) of the Fast MA and Slow MA, as well as the intersection of the MA lines between each other. In the parameters you can specify any desired currencies and timeframes. Also, the indicator can send notifications about the price touching the lines and about their crossing. By clicking on a cell with a period, this symbol
              30 USD
              Levels of Timeframes
              Taras Slobodyanik
              5 (1)
              The indicator shows the High/Low /Open/Close   Levels from other (and non-standard) timeframes - Year, 6 Months, 4 Months, 3 Months, 2 Months, Month, Week, Day, 6-8-12 Hours. You can also set the shift for opening candles and build virtual candles. "Period separators" for one of these timeframes is available in the form of vertical lines. Alerts can be configured for breakouts of the current or previous levels. You can also shift all levels to the right by one period. That is, the High/Low of
              30 USD
              The indicator shows the High/Low /Open/Close   Levels from other (and non-standard) timeframes - Year, 6 Months, 4 Months, 3 Months, 2 Months, Month, Week, Day, 4-6-8-12 Hours. You can also set the shift for opening candles and build virtual candles. "Period separators" for one of these timeframes is available in the form of vertical lines. Alerts can be configured for breakouts of the current or previous levels. You can also shift all levels to the right by one period. That is, the High/Low
              34 USD
              Time Scale for MT5
              Taras Slobodyanik
              5 (9)
              The indicator draws the time scale on the chart. You can specify the time offset, adjust the size and font to display on the chart. You can also select the desired format for displaying the date and time. Parameters Hours (time shift) — time shift (hours); Minutes (time shift) — time shift (minutes); Show time on mouse — show time under the pointer; Precise time scale  — calculate the time between bars; Hide MT's time scale — hide the standard scale; Scale date format —  format for the date
              FREE
              Fractals Dashboard MT4
              Taras Slobodyanik
              5 (3)
              Multicurrency and multitimeframe modification of the Fractals indicator. Displays the last two fractals — their sequence (and which one is broken), or the distance between them. You can specify any desired currencies and timeframes in the parameters. Also, the panel can send notifications on a fractal's breakout. By clicking on a cell with a period, this symbol and period will be opened. Parameters Calculation of fractals based on  — fractal search mode; —   standart indicator   — by the stan
              30 USD
              This dashboard displays current news from three sources: from the ForexFactory.com website (FFC calendar), from the Investing.com website and the Economic Calendar from mql5.com. You can sort news by impact and by country, and display them on the chart with one click. By holding down the 'Ctrl' key, you can select several different 'currencies' or 'impacts' to sort. Also, this utility shows not only the forecast, but also the actual values ​​after they appear on the site. You can set a separate
              59 USD
              Angle High Low
              Taras Slobodyanik
              The indicator calculates the angle between the Highs, Lows and Closes of neighboring bars. The angle can be measured in degrees or radians. A linear chart or a histogram is drawn in a subwindow. You can set the scale for the calculation — floating or fixed. For use in the EA, you need to specify a fixed scale. Parameters Angular measure — degrees or radians. Scale mode for calculation — scaling mode. Free scale — free transformation, the indicator will calculate values each time the chart scal
              FREE
              Angle Dashboard
              Taras Slobodyanik
              5 (1)
              This is a multicurrency and multitimeframe indicator that calculates the angle between two points. Points for measuring the angle can be taken from the ZigZag (the last two points), or from the Moving Average (between two given bars), or it can be the closing prices of bars. Angle measurement is possible in degrees or in radians. You can select the scale for the calculation. For a better understanding of the indicator, you can study the free Angle High Low indicator. In the parameters you can
              30 USD
              Filter:
              Mike Louw
              182
              Mike Louw 2022.10.12 15:54 
               

              Multi currency RSI dash is a great indicator to find extended market conditions, all in one place. I also use it as a mini operating system which is compact and can be nestled into a corner of a chart. Instead of having to drag symbols manually from the Market Watch window or switch between profiles, just click on any pair in the dash and the symbol changes instantly. With multiple timeframe windows, add a free ChartSync indicator and all change simultaneously. Parameter settings are extensive and the author is very accommodating. With version 3.2, I can highlight the name of a pair/s and make my own watch list. No more fumbling around...Thank you!

              toastatacke
              104
              toastatacke 2022.09.05 16:58 
               

              First look is great and it works well. In further updates would be very nice if the Text color is changeable so it is usable with dark background in MT and a button for fast hiding and showing the indicator

              Multi Disipliner
              347
              Multi Disipliner 2022.02.21 21:26 
               

              very nice. thanks

              Roberto Alencar
              1168
              Roberto Alencar 2020.05.04 15:12 
               

              The best

              lilychu1911
              49
              lilychu1911 2019.09.02 05:27 
               

              Great indicator to monitor RSI for all timeframes in one place. Thank you.

              Reply to review
              Version 3.60 2023.06.01
              1) Fixed text color when clicking on the pair name - "Alerts On".
              Version 3.50 2023.05.31
              1) Added "Coloring Text according to" parameter.
              2) Added tooltips.
              3) Changed the color scheme.
              4) Added "Color scheme" parameter.
              Version 3.40 2023.05.19
              1) Added parameter "Decimal places for RSI values".
              Version 3.30 2022.11.29
              1) Fixed bug with "Alert mode combined in a row".
              Version 3.20 2022.10.11
              1) Added parameter: "Highlight color for pair selection".
              Version 3.10 2022.10.11
              1) Added the ability to enable/disable alerts for each Symbol when clicking on the name of the Pair. If no Pair is selected then alerts are enabled for all Symbols.
              Version 3.0 2022.09.20
              1) Disabled stopping the indicator in case of an error starting the RSI. Now there will be a repeated attempt to launch the RSI.
              Version 2.90 2022.09.09
              1) Separate parameters for alerts for each zone (separately for entering the zone and exiting the zone).
              2) Added parameters and alerts for the Middle level.
              Version 2.80 2022.09.08
              1) Added parameters to change table colors.
              Version 2.70 2022.04.18
              1) Added a parameter to highlight the current Pair and TF.
              Version 2.60 2021.08.24
              1) Fixed a bug when launching many indicators with the "Current pair" parameter.
              Version 2.50 2021.04.16
              1) Added parameter "Allow to move the table manually". Now, after double-clicking on the table headers, you can move it with the mouse. The binding to the corner of the chart remained unchanged.
              Version 2.40 2021.03.19
              1) Added options to disable the table headers.
              Version 2.30 2021.02.17
              1) Added the "Refresh cells only on new bar" parameter.
              Version 2.20 2020.06.08
              1) Recompilation for the new MT5 build.
              Version 2.10 2020.03.19
              1) Separate settings for alerts so that you can disable each separately.
              Version 2.0 2019.11.22
              1) Added parameters for changing the text of alerts.
              Version 1.90 2019.11.06
              1) Changed the alert algorithm when the indicator starts.
              Version 1.80 2019.10.26
              1) Added periods for alerts - "Timeframes for alerts".
              2) Added parameter for clearing the chart at startup - "Clear the chart at startup".
              3) Added center alignment of the panel - "Centered".
              4) Added offsets for the panel - "X offset (pix)" and "Y offset (pix)".
              5) Reverse the order of pairs of "Market Watch" without sorting.
              Version 1.70 2019.02.21
              1) Added an alert to exit the overbought / oversold zone.
              2) Added parameter: "Check alerts only on bar closing".
              Version 1.60 2018.11.06
              1) Added an alert when all timeframes are oversold or overbought.
              Version 1.50 2018.10.15
              The color scheme has been fixed, now a white scheme is used for background colors other than black.
              Version 1.40 2018.07.09
              1) Added the "Set of Pairs" parameter to select the symbols of the Market Watch.
              2) Added parameter "Chart template". The specified template will be applied when opening a chart.
              3) Code optimization.
              Version 1.30 2018.03.23
              1) Added one more option for the list of pairs - "Pairs". One line can contain up to 256 characters.
              2) Now the names of pairs can be set in both upper and lower case. If the name contains both cases, then the exact name should be specified.
              3) Code optimization.
              Version 1.20 2018.02.19
              1) Added parameter: Coloring the cells according to the Levels or to the Previous candle.
              2) Added the ability to run several indicators on one chart.
              Version 1.10 2018.02.05
              1) Removed automatic change of the letter case. Now the currency names should be written exactly like the broker's, keeping the case and prefix/suffix.
              2) Added a tooltip for each cell.