Dashboard RSI Multicurrency
- Indicators
- Version: 5.70
- Updated: 19 July 2026
- Activations: 10

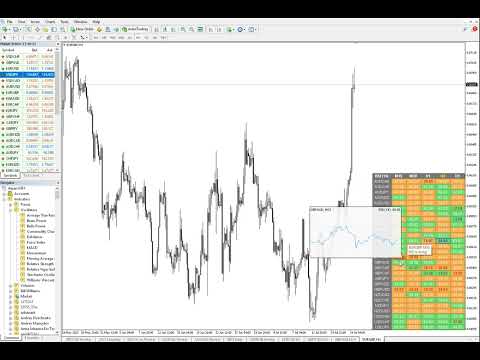
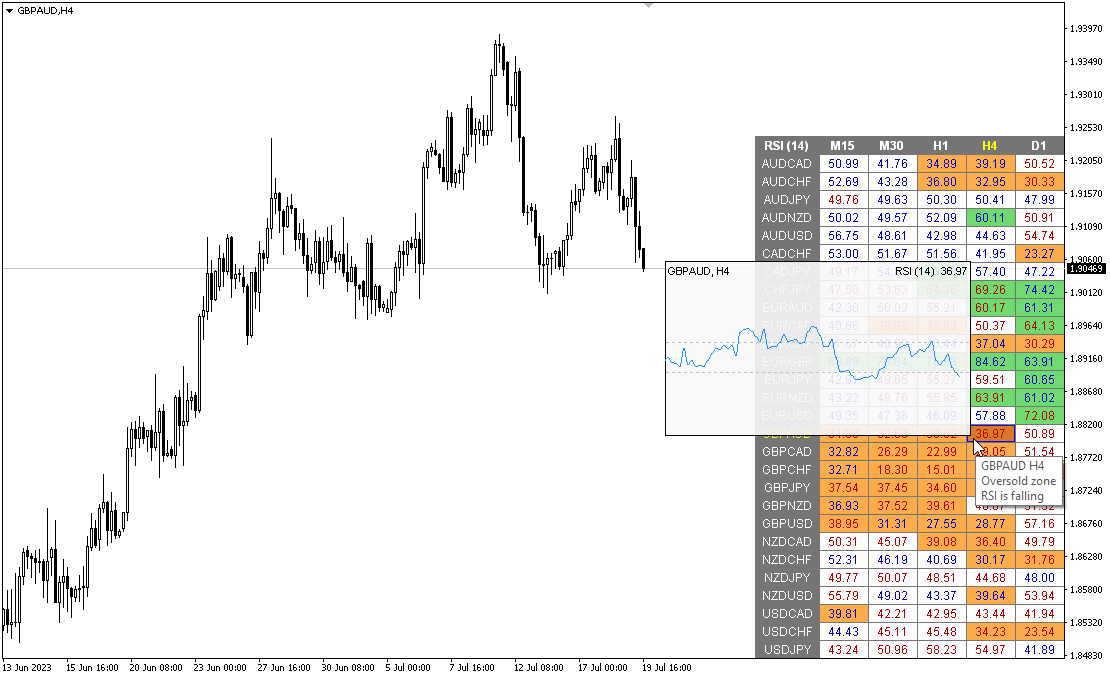
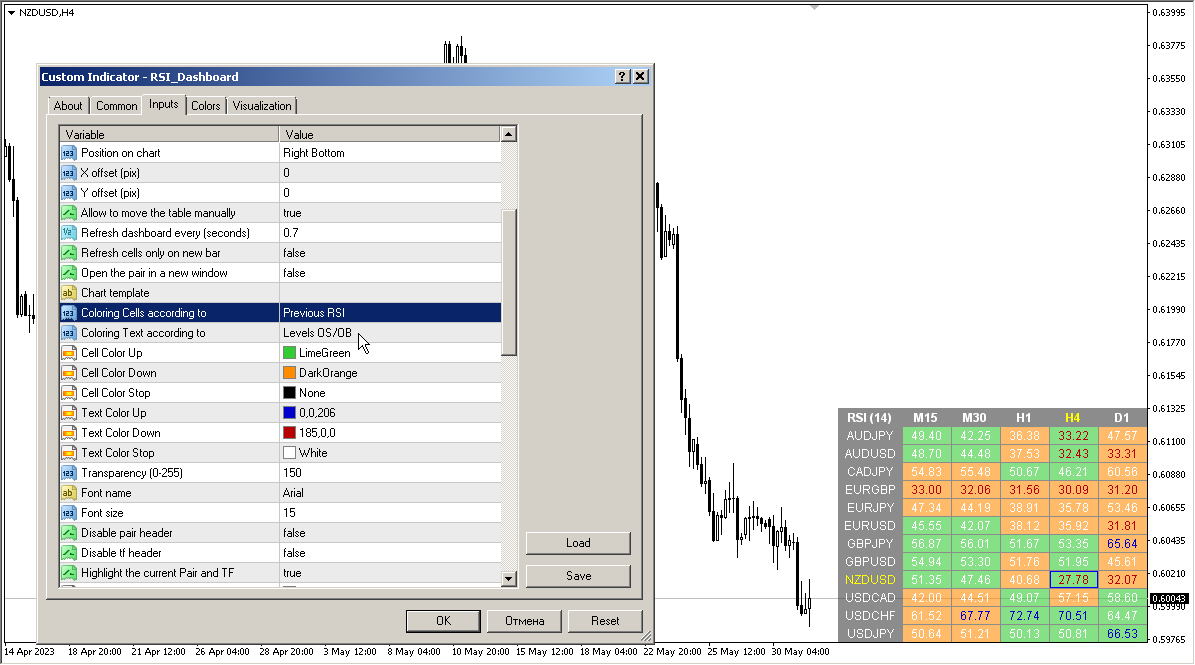
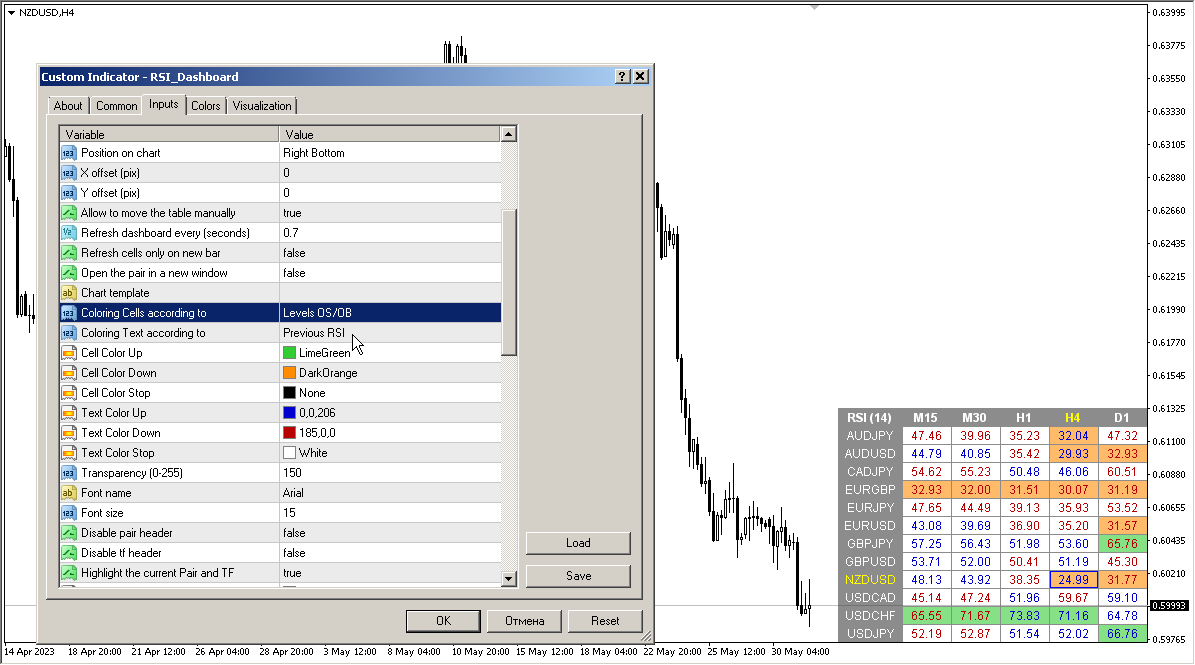
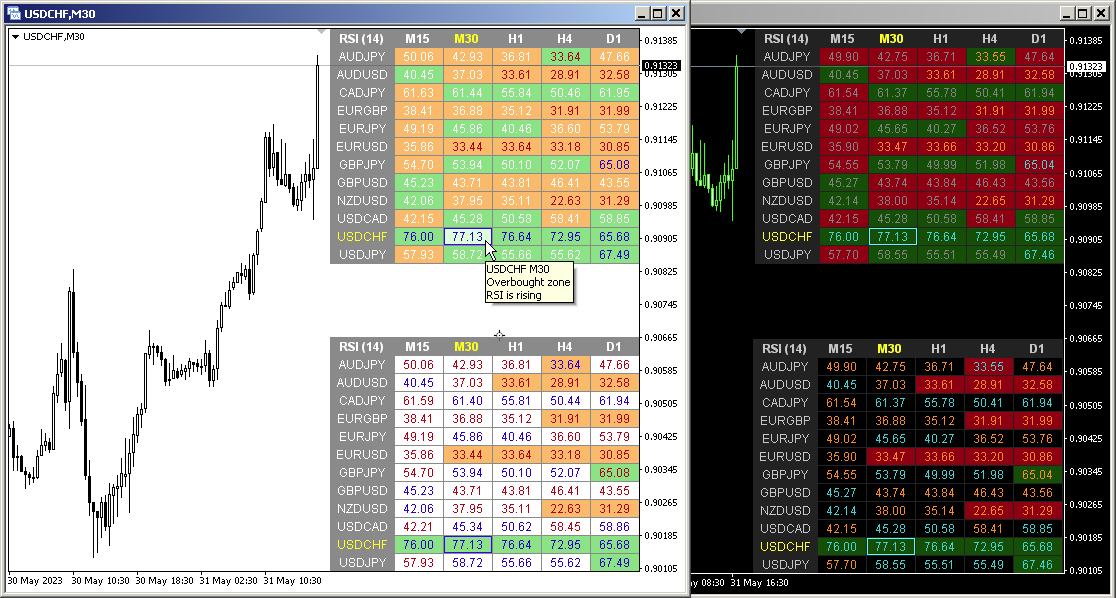
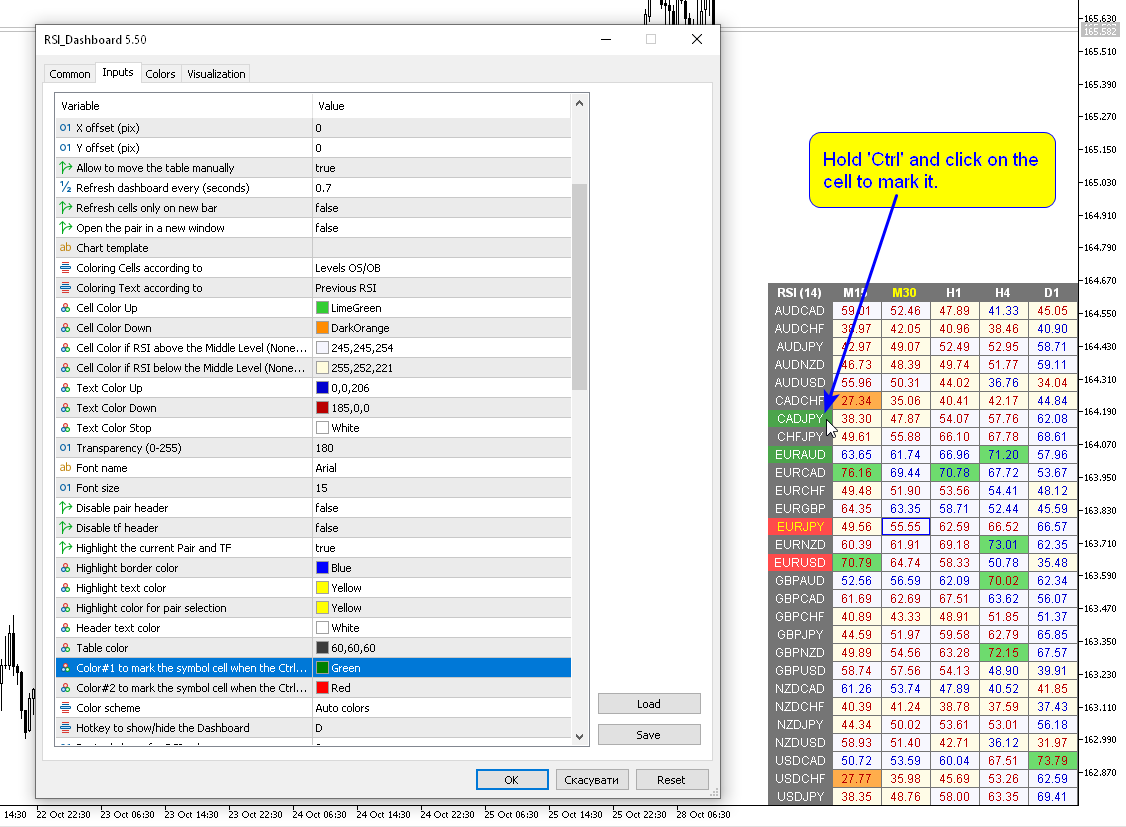
Multicurrency and multi timeframe modification of the Relative Strength Index (RSI) indicator — RSI Dashboard . You can specify any desired currencies and timeframes in the parameters. Also, the panel can send notifications when crossing overbought and oversold levels. By clicking on a cell with a period, this symbol and period will be opened. This is MTF Scanner.
The key to hide the dashboard from the chart is "D" by default
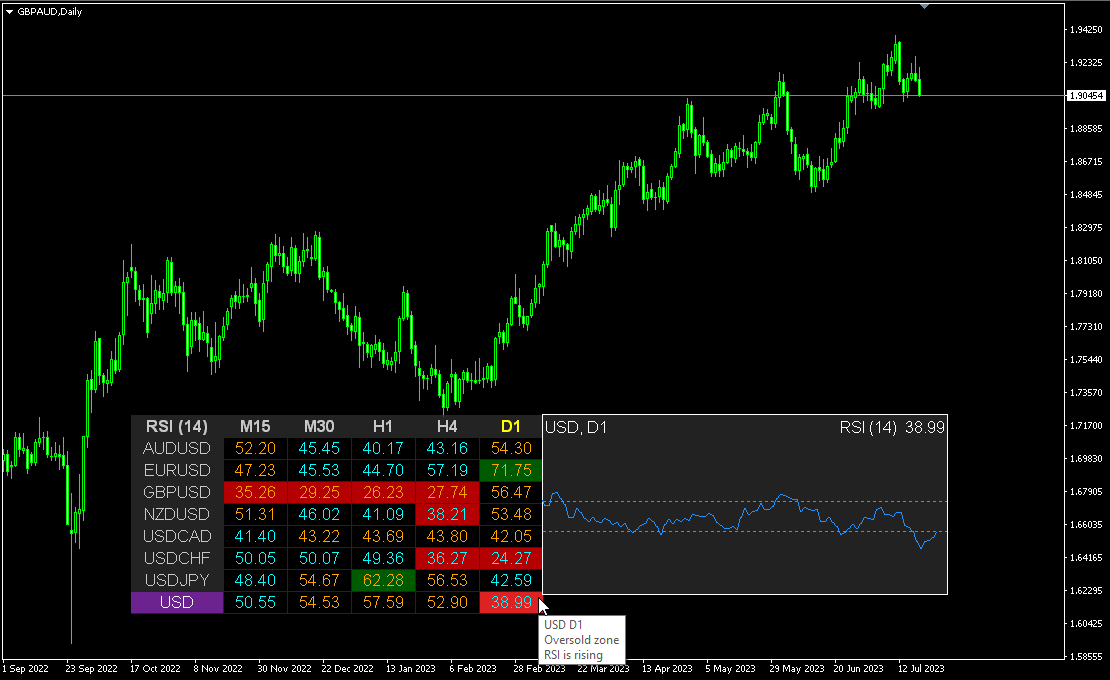
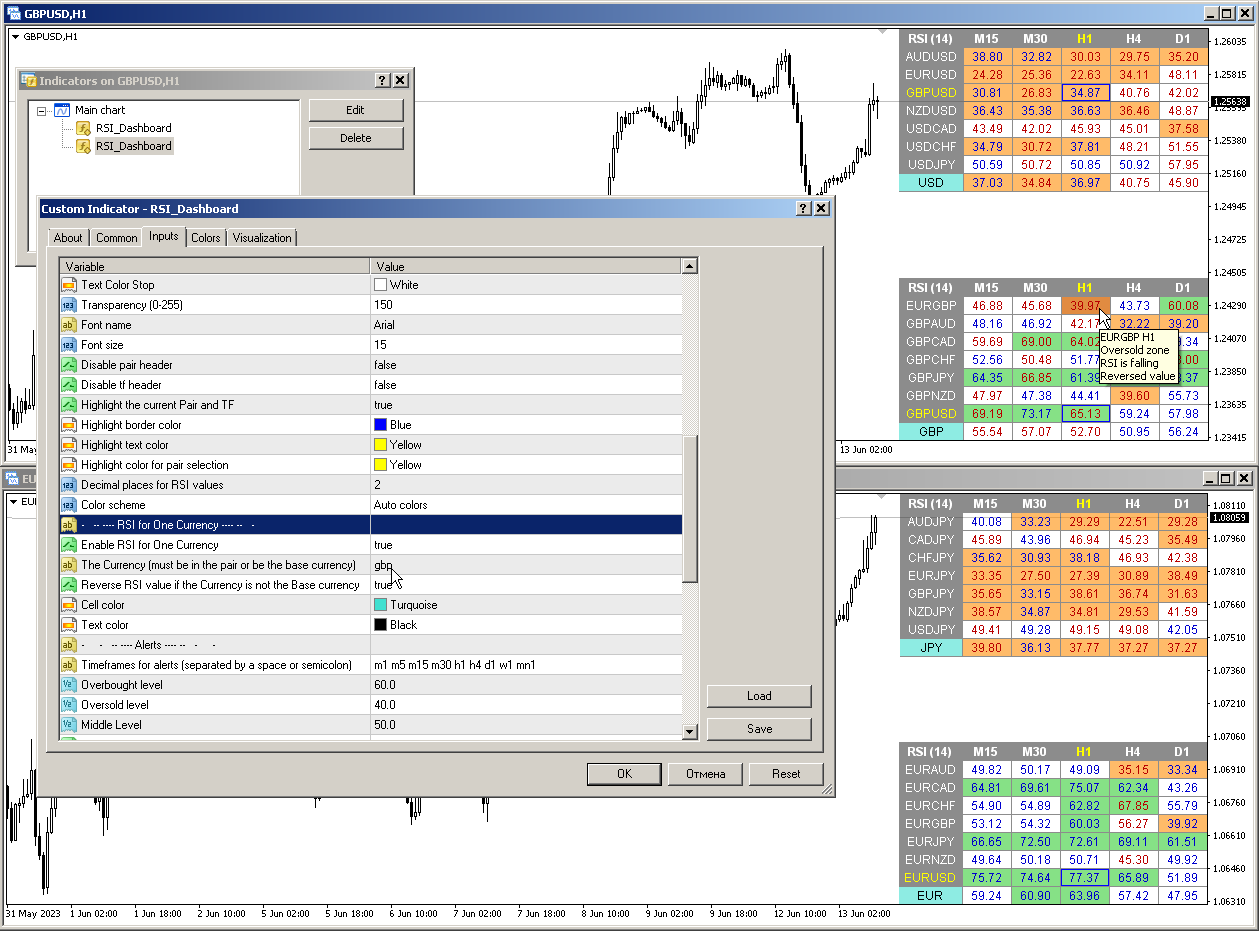
Similar to the Currency Strength Meter (CSM), the Dashboard can automatically select pairs that contain a specified currency, or those pairs that have that currency as their base currency. The indicator searches for Currency in all pairs that are specified in the “Set of Pairs”; other pairs are ignored. And based on these pairs, the total RSI for this currency is calculated. And you can see how strong or weak that currency is.
Parameters
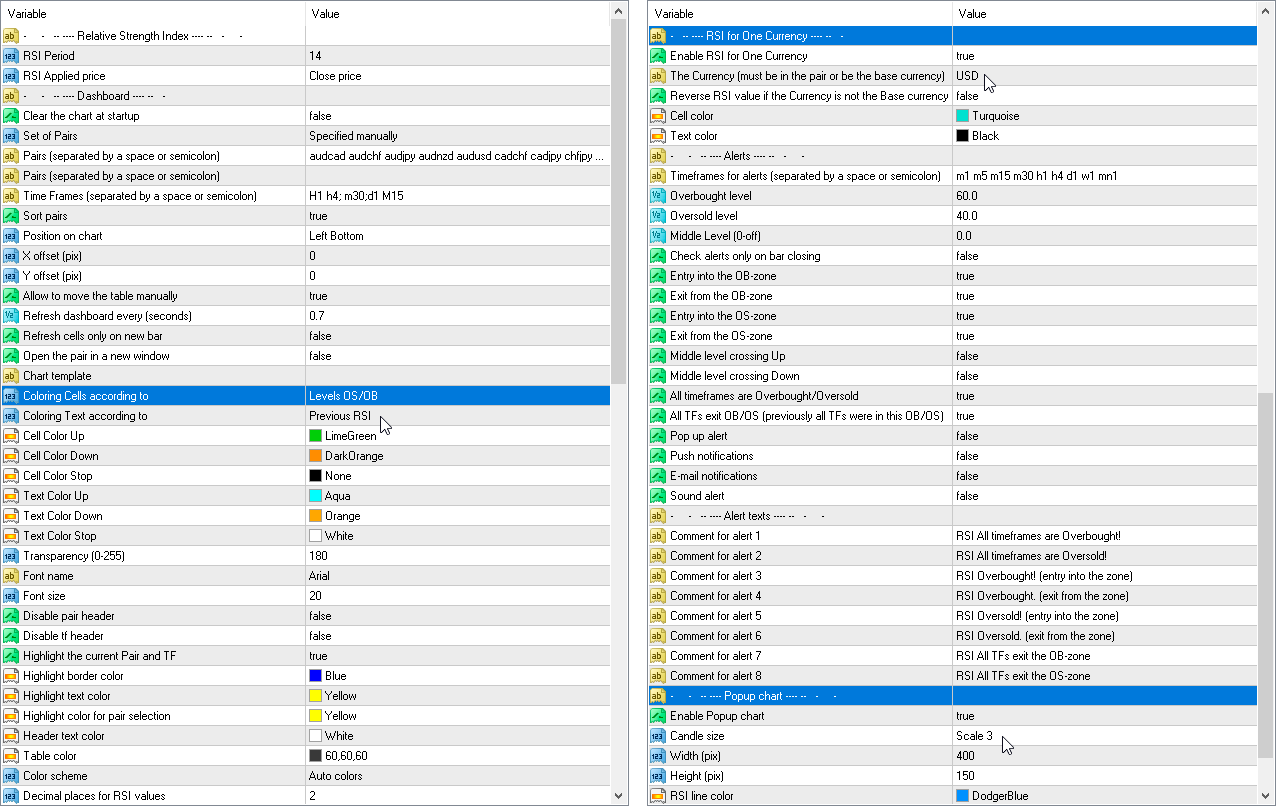
RSI Period — averaging period.RSI Applied price — price type.
Clear the chart at startup — clear the chart at startup
Set of Pairs — set of symbols
— Market Watch — pairs from the "Market Watch" of the MT.
— Specified manually — pairs specified manually, in the parameters "Pairs".
— Current pair — show only the current pair.
Time Frames (separated by a space or semicolon) — list of timeframes separated by spaces or semicolons (multi timeframe).
Sort pairs — sorting the list of pairs.
Position on chart — corner to display the panel on the chart.
X offset (pix) — shift the panel along the X axis;
Y offset (pix) — shift the panel along the Y axis;
Refresh dashboard every (seconds) — update period for all pairs and timeframes.
Refresh cells only on new bar — cell updates (and alerts) will only occur when a new bar appears.
Open the pair in a new window — open a symbol in a new chart window by clicking.
Chart template — the name of the template for the chart, if the chart opens in a new window.
Coloring the cells according to the — paint the cells of the table according to the levels of overbought/oversold or according to the direction of the previous candle.
Color Up — cell color if the indicator increases.
Color Down — cell color if the indicator decreases.
Color Stop — cell color if the indicator does not change.
Transparency (0-255) — transparency of the panel.
Font name — font name.
Font size — font size.
Timeframes for alerts (separated by a space or semicolon) — list of periods for which the alert will be sent (separated by a space or semicolon).
Overbought level — overbought level for alerts.
Oversold level — oversold level for alerts.
Middle Level
Check alerts only on bar closing — check level crossing only after bar closing.
Push notifications — push notification.
E-mail notifications — e-mail notification.
Sound alert — sound alert.


hello I have RSI dashboard and Stochastic dashbord. I need something for alert system. I really like your dashboards. But I need something more useful. If you can add it I will be very happy.. Example: When the RSI is over 70 on the H1 and at the same time The RSI is under the 30 on the M1 , Can be an alert for it ? When the RSI is under 30 on the H1 and at the same time The RSI is over the 70 on the M1 , Can be an alert for it ? I mean that when a timeframe is over 70 and the other timeframe is under 30 , there will be an alert for it