MA Dashboard MT5
- Indicators
- Version: 4.10
- Updated: 19 July 2026
- Activations: 10

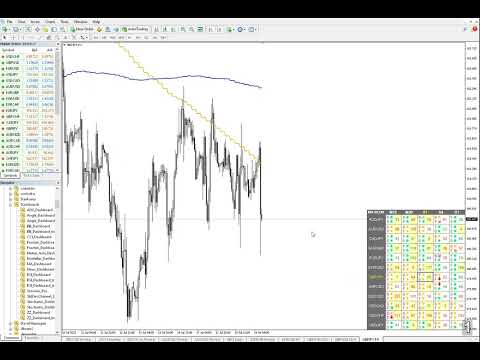
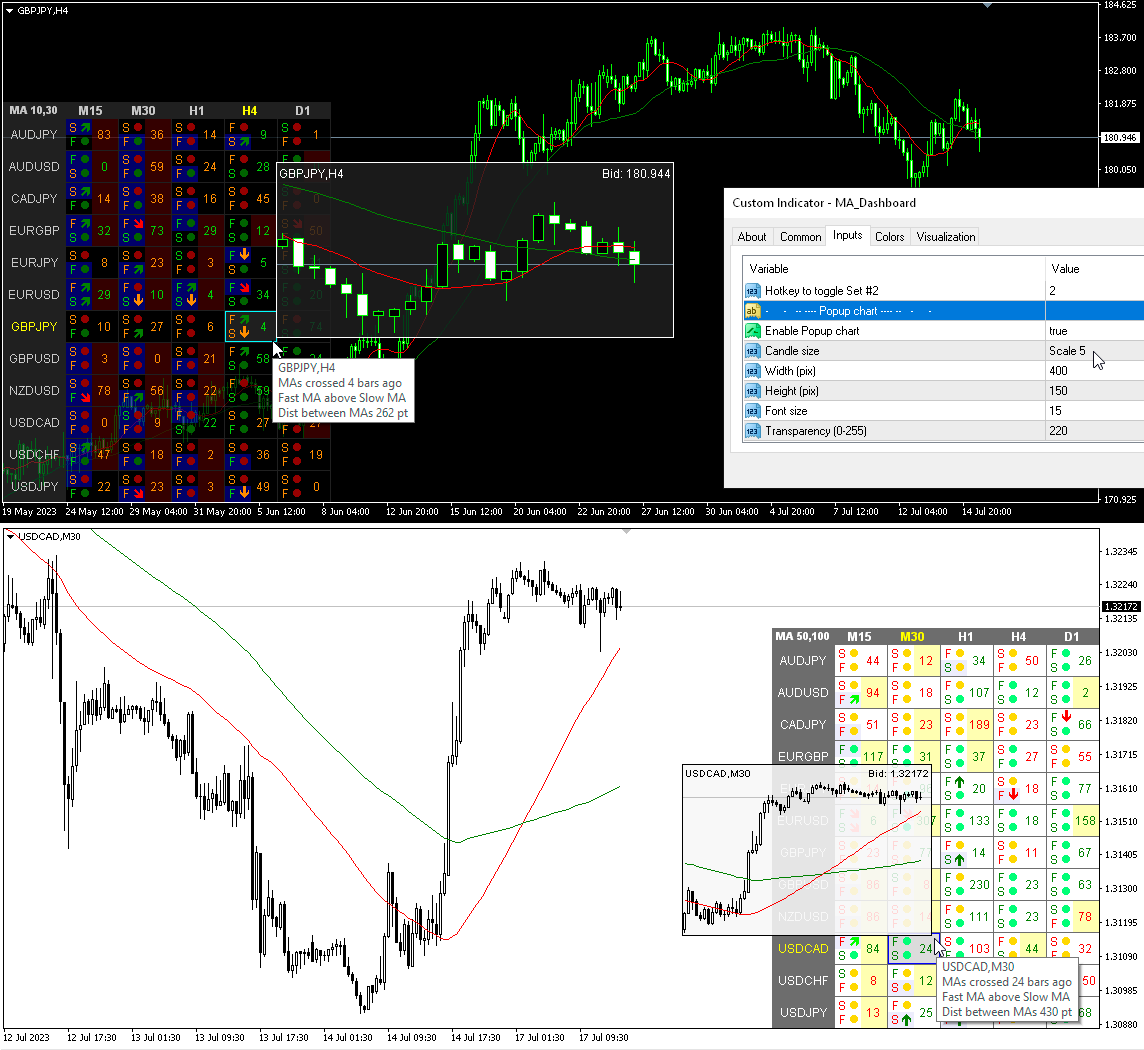
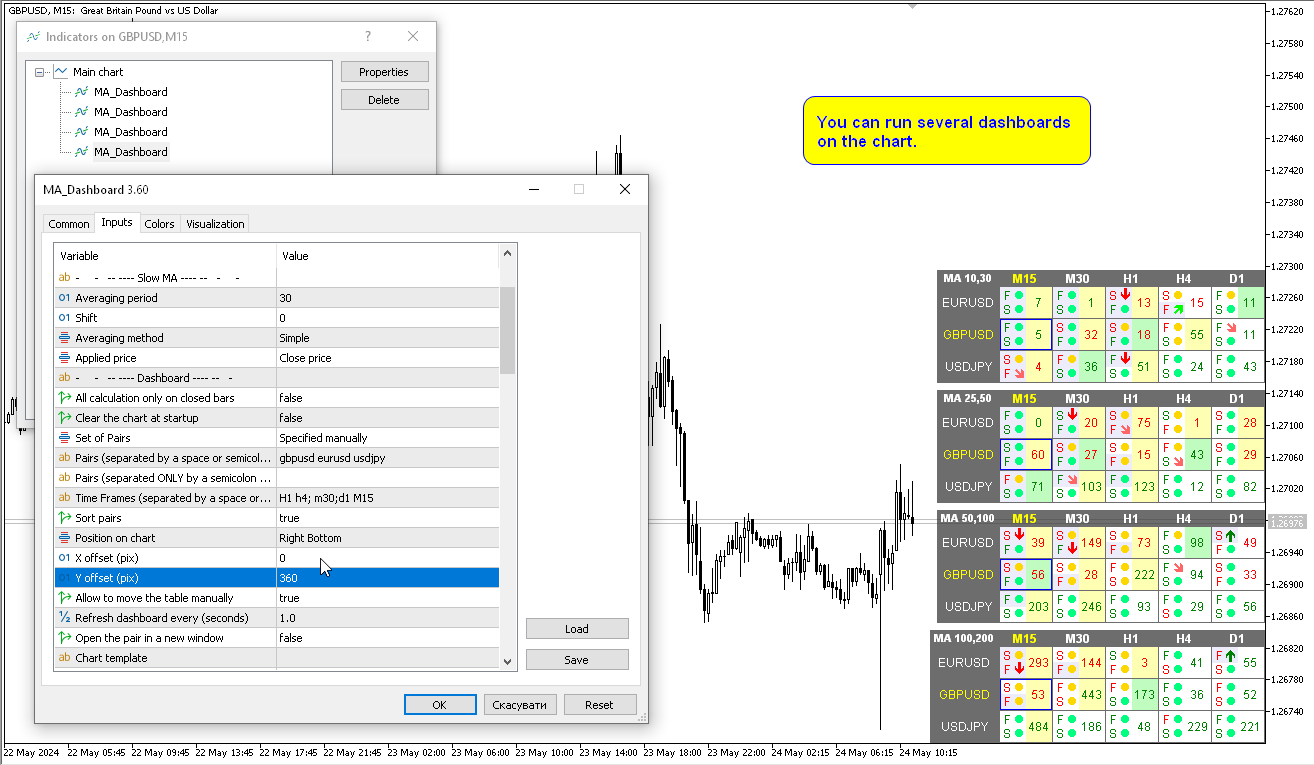
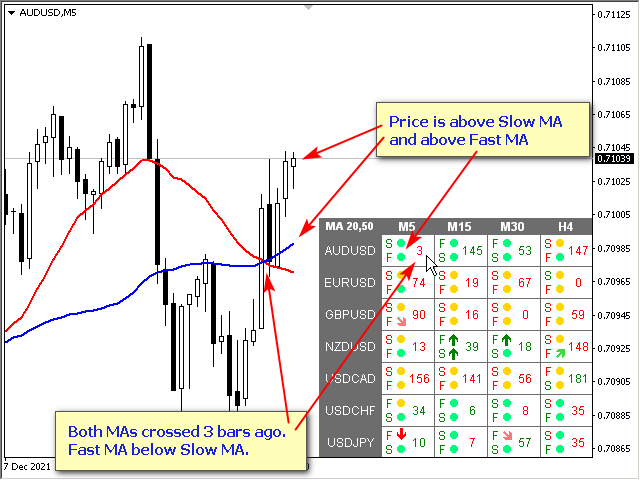
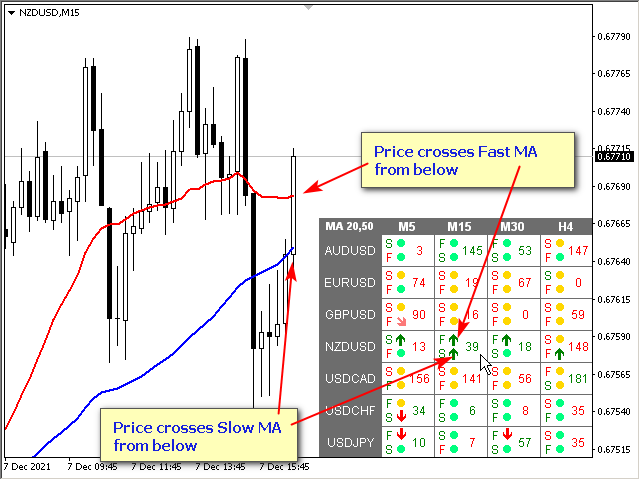
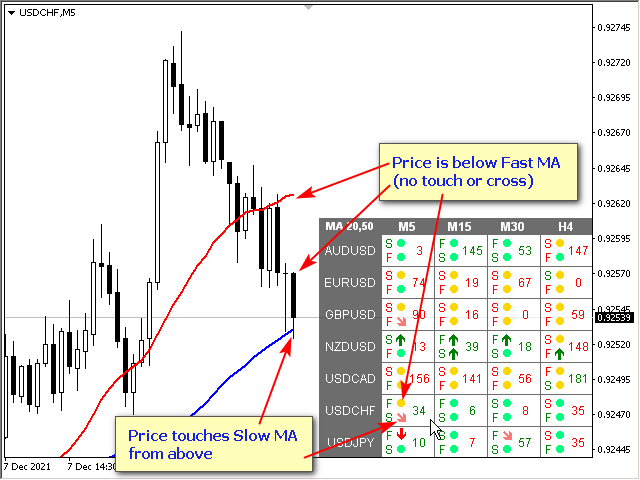
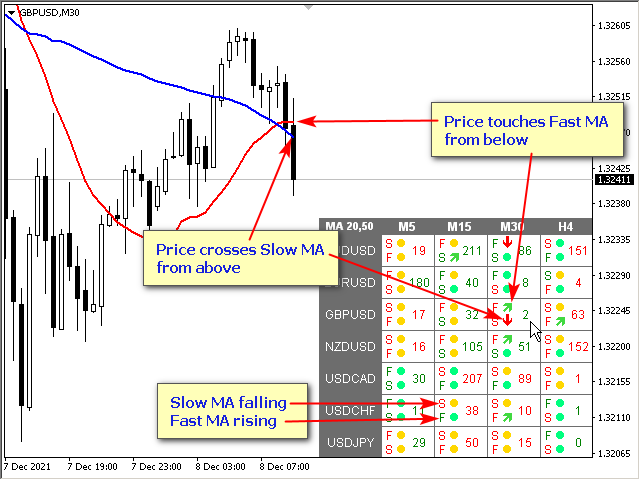
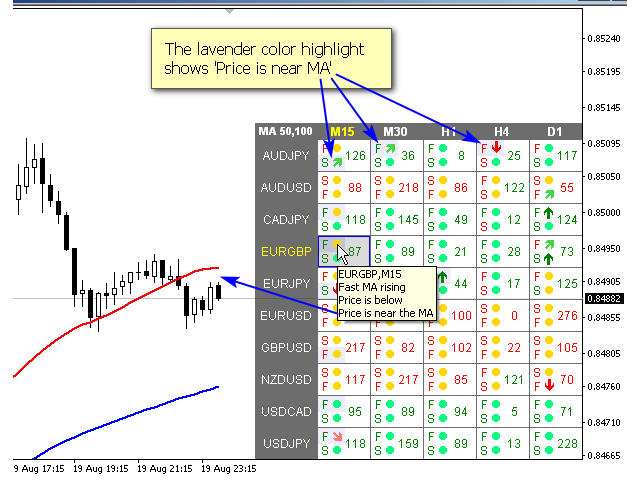
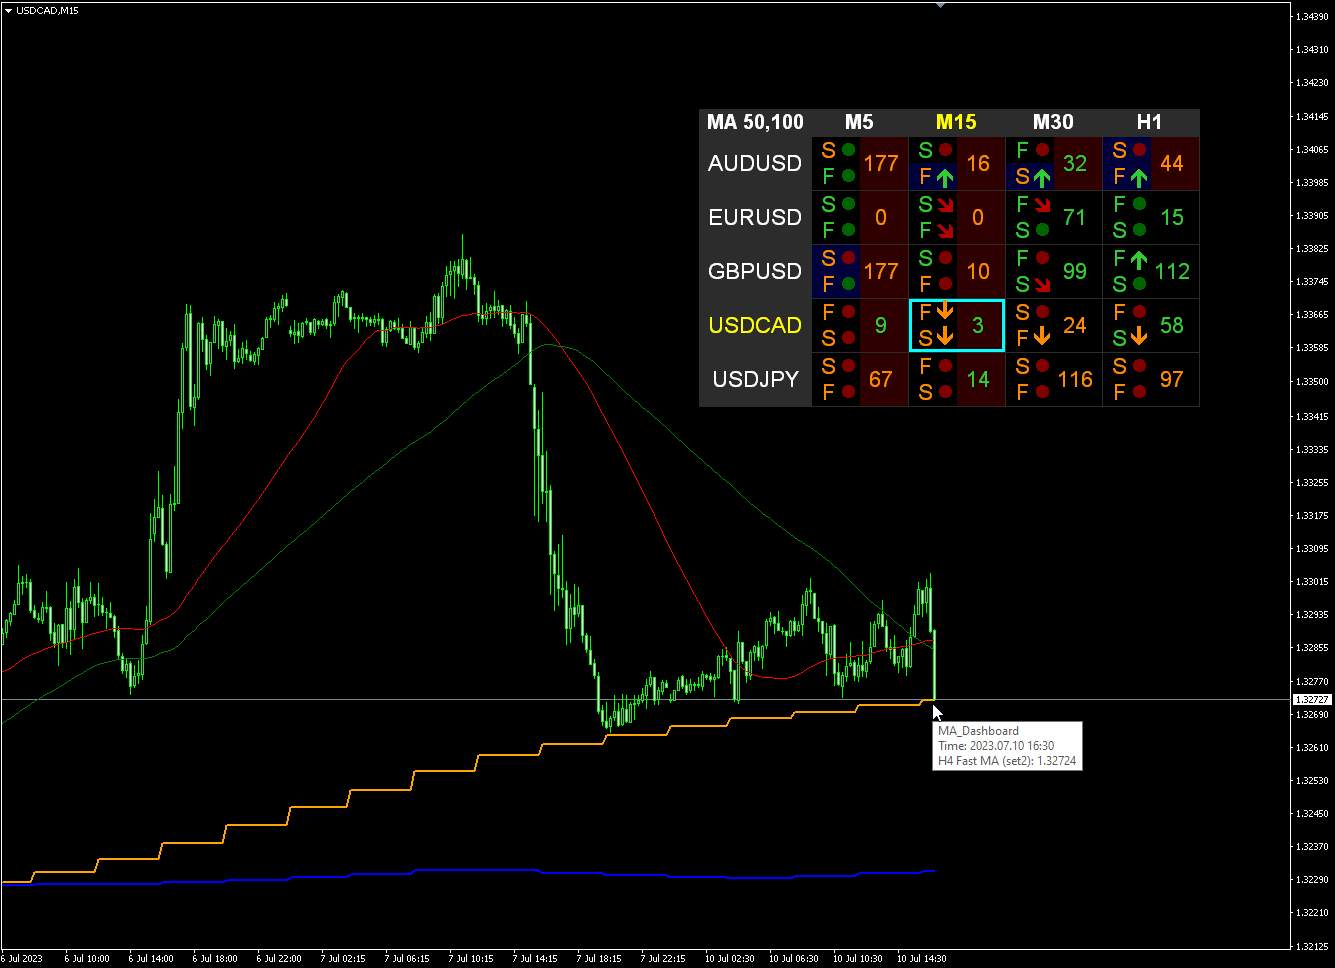
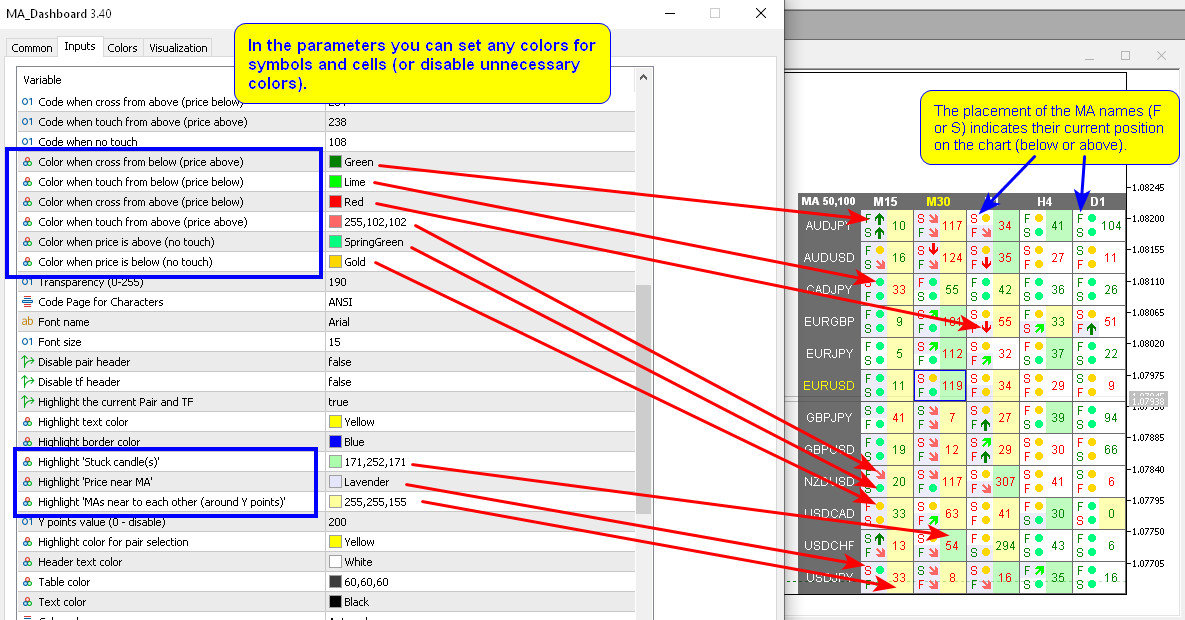
Multicurrency and multitimeframe modification of the indicator Moving Average (MA). On the dashboard you can see the current state of the indicator - breakouts and touches (by price) of the Fast MA and Slow MA, as well as the intersection of the MA lines between each other (moving average crossover). In the parameters you can specify any desired currencies and timeframes. Also, the indicator can send notifications about the price touching the lines and about their crossing. By clicking on a cell with a period, this symbol and period will be opened. This is MTF Scanner. You can run several dashboards on the chart.
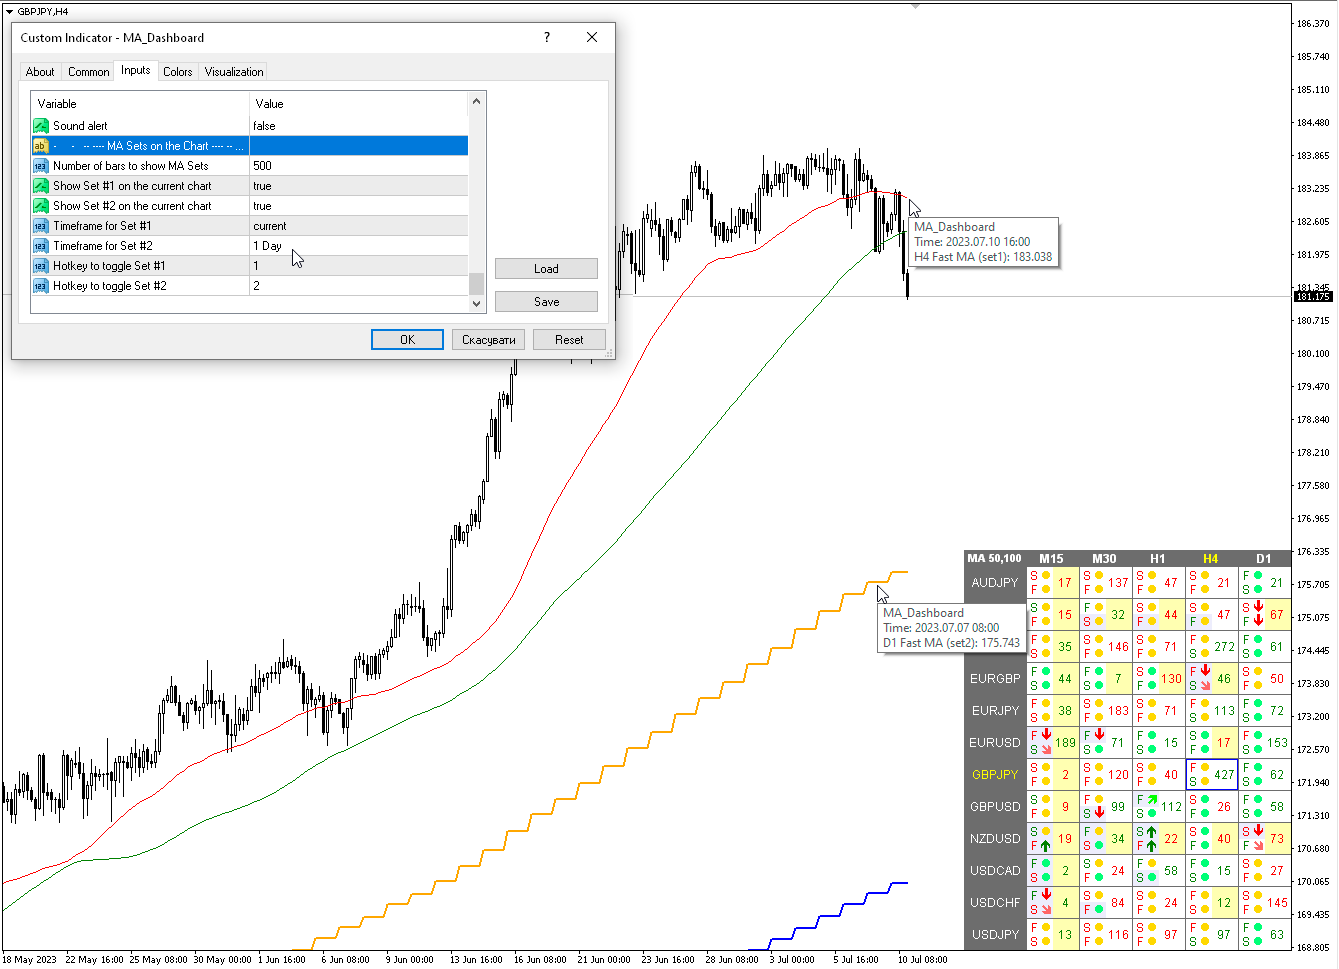
The indicator displays Fast MA and Slow MA lines on the current chart. You can select the MA timeframe for the chart and watch MA from other timeframes (MTF MA). The hotkeys for the two sets of MA are "1" and "2" by default.
The key to hide the dashboard from the chart is "D" by default
Parameters
Max number of bars to look for 'MA cross' (0 - don't search) — If this parameter is 0, the column with the cross will not be displayed in the table.
Fast MA
Averaging period.
Shift.
Averaging method.
Applied price.
Averaging period.
Shift.
Averaging method.
Applied price.
All calculation only on closed bar.
Clear the chart at startup — clear the chart at startup.
Set of Pairs
— Market Watch — pairs from the "Market Watch" of the MT.Pairs (separated by a space or semicolon) — list of symbols separated by spaces or semicolons. The currency names should be written exactly like the broker's, keeping the case and prefix/suffix.
— Specified manually — pairs specified manually, in the parameters "Pairs".
— Current pair — show only the current pair.
Time Frames (separated by a space or semicolon) — list of timeframes separated by spaces or semicolons (multi timeframe).
Sort pairs — sorting the list of pairs.
Position on chart — corner to display the panel on the chart.
X offset (pix) — shift the panel along the X axis;
Y offset (pix) — shift the panel along the Y axis;
Refresh dashboard every (seconds) — update period for all pairs and timeframes.
Open the pair in a new window — open a symbol in a new chart window by clicking.
Chart template — the name of the template for the chart, if the chart opens in a new window.
Code when cross from below (price above);
Code when touch from below (price below);
Code when cross from above (price below);
Code when touch from above (price above);
Code when no touch;
Transparency (0-255);
Font name;
Font size.
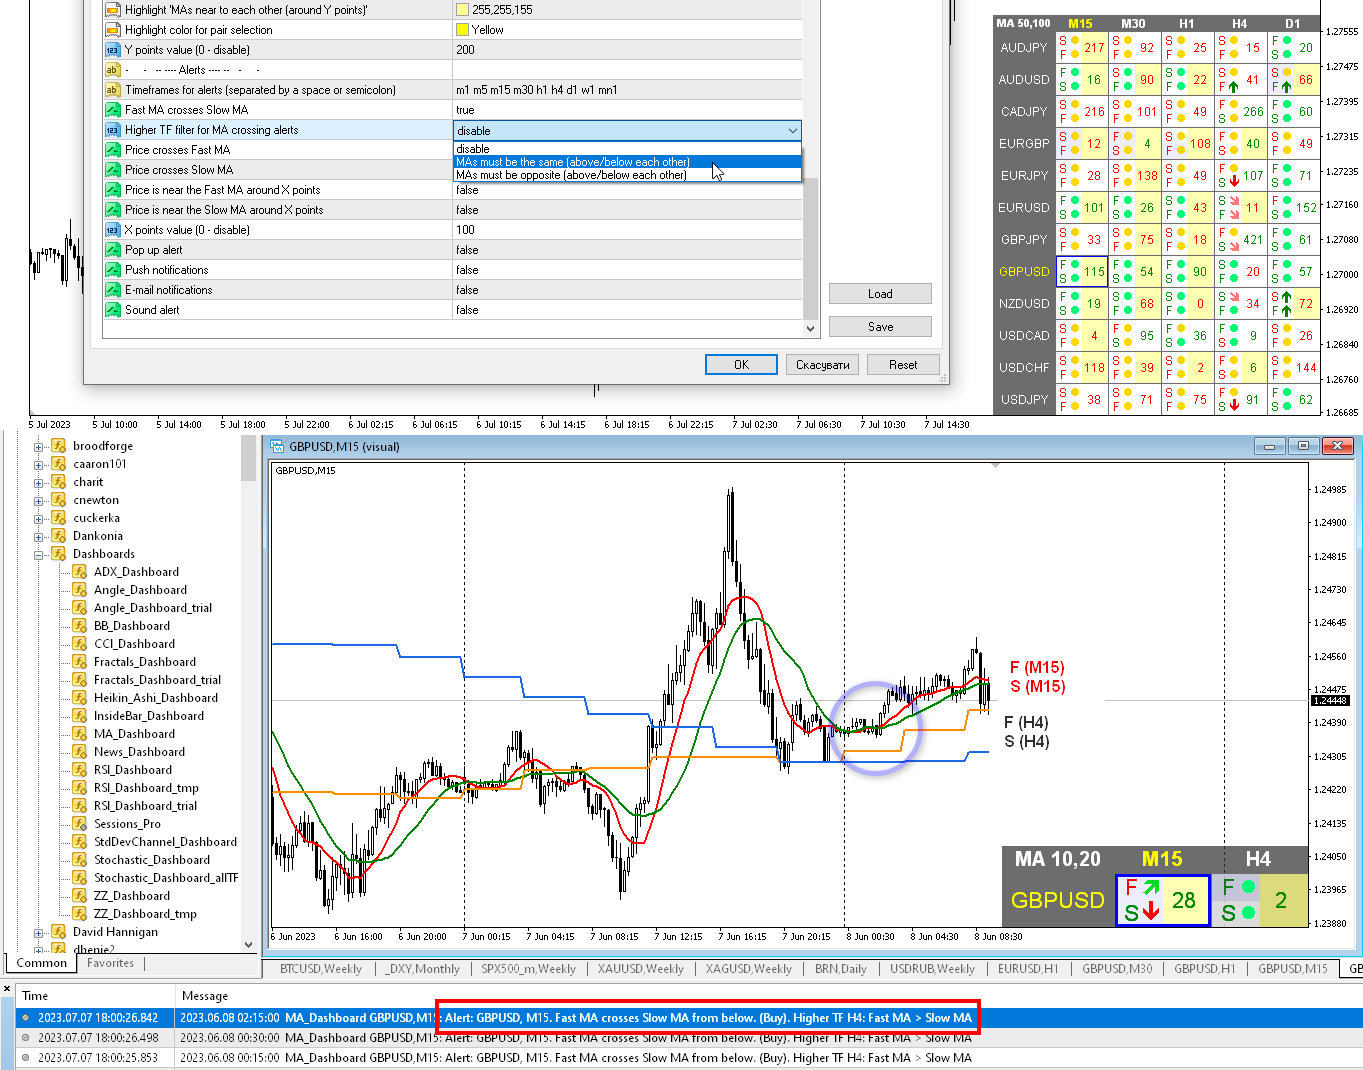
- disable
- MAs must be the same (above/below each other)
- MAs must be opposite (above/below each other)
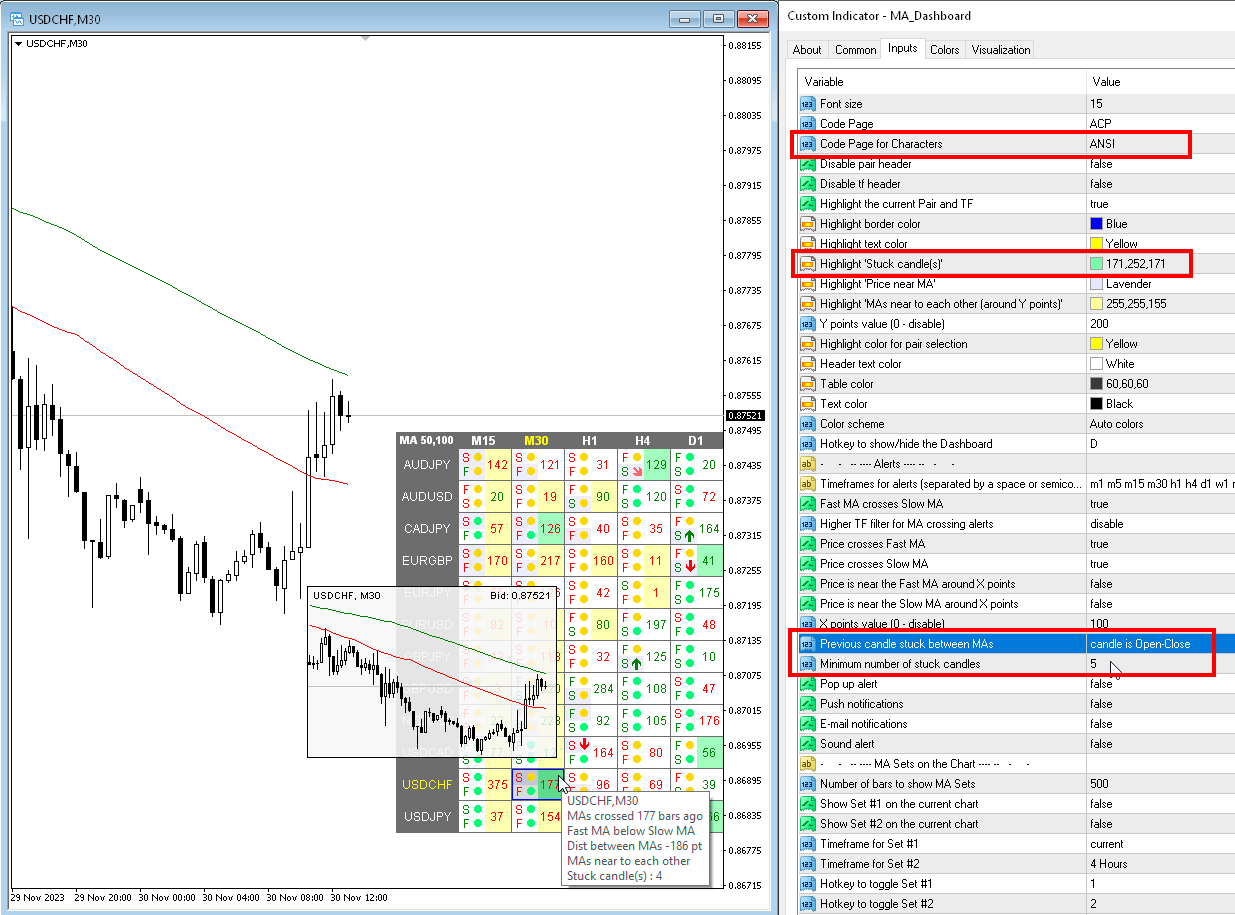
Previous candle stuck between MAs — If the previous candles are between two MAs, then you can receive an alert about this or see it in the table.


I bought this indicator a few days ago and I can say it is really very use- and helpful !! As A. Forex already told it would be a good idea to integrate the MT5-standard indicators "Double Exponential Moving Average" and "Triple Exponential Moving Average" to this wonderful tool. To me I am using this both indicators constantly.