• Overview
  • Reviews (2)
  • Comments (67)
  • What's new

ZigZag Dashboard for MT5

5
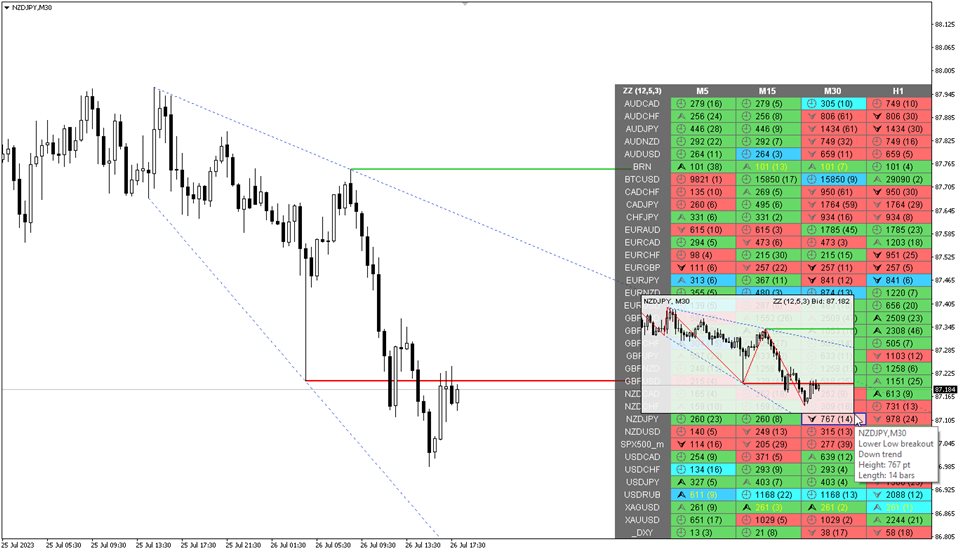
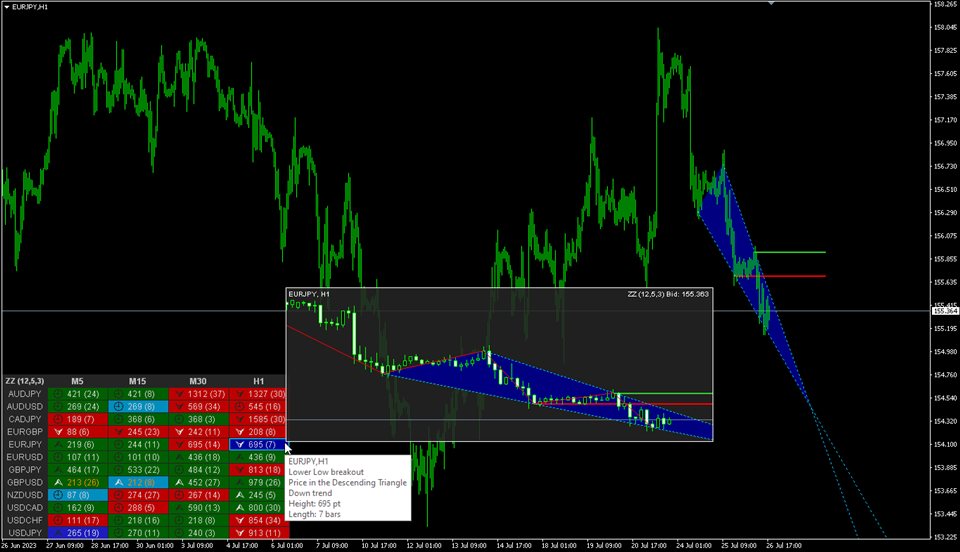
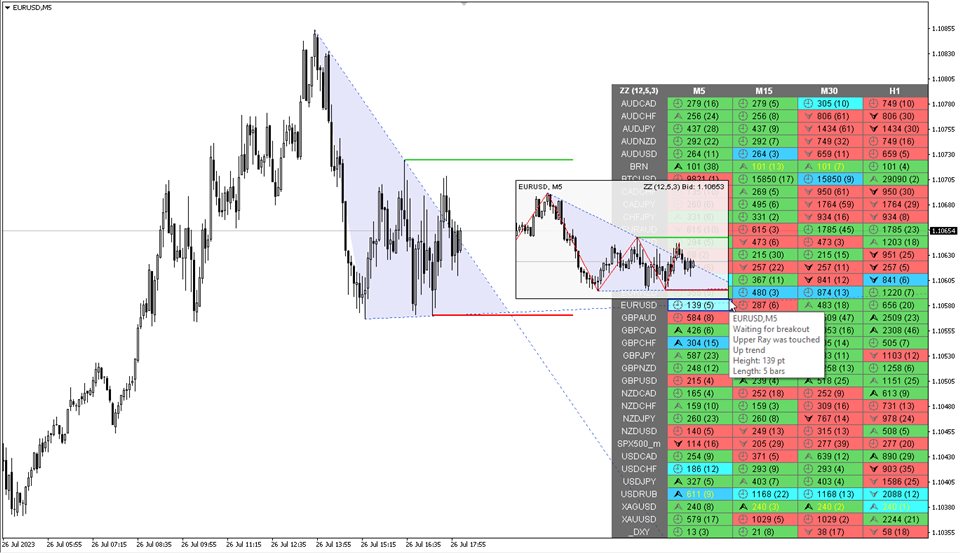
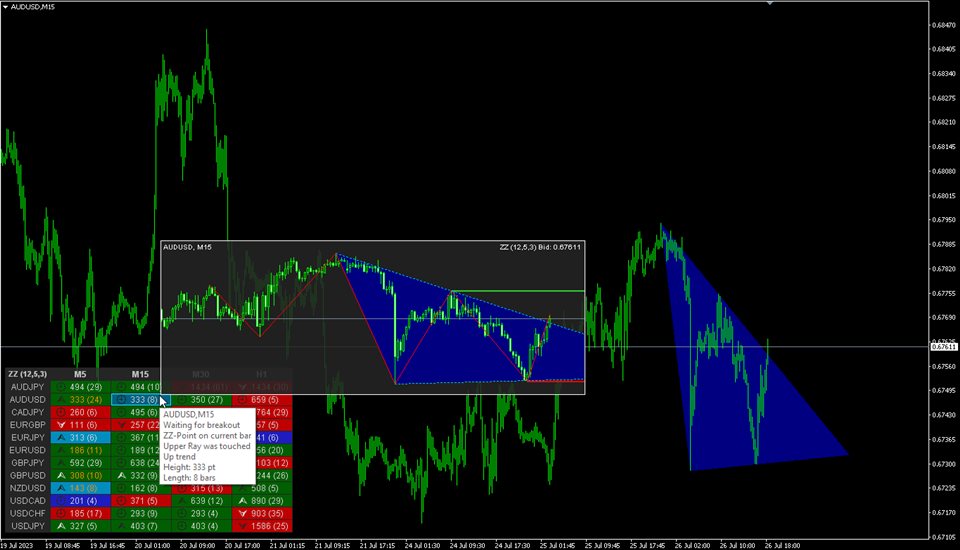
Multicurrency and multitimeframe modification of the ZigZag indicator. Displays the current direction of the market, the height of the last movement, the number of bars in this movement and the breaking of the previous point of the ZigZag. This is MTF Scanner.

You can specify any desired currencies and timeframes in the parameters. Also, the panel can send notifications when the ZigZag changes direction or when there was a breakthrough of the previous point. By clicking on a cell with a period, this symbol and period will be opened.

Parameters

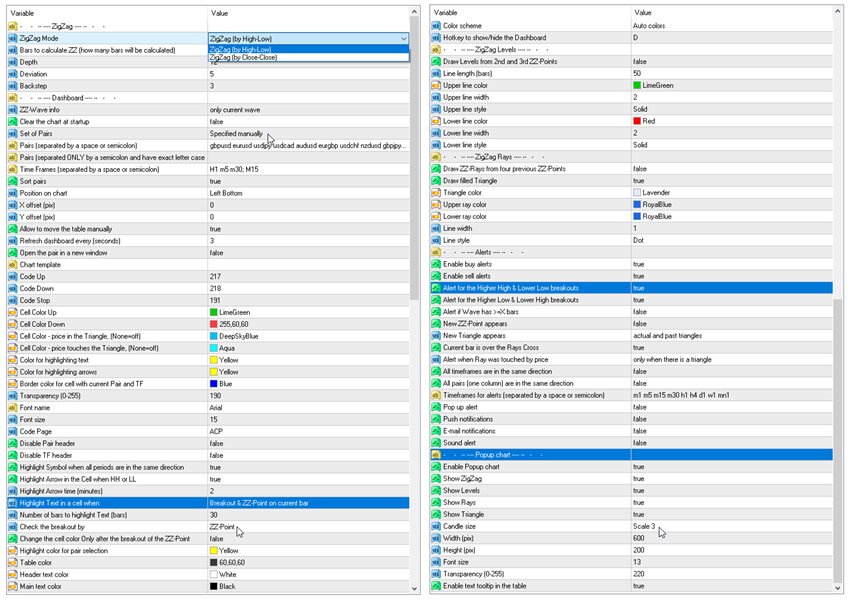
Depth — the minimum number of candlestick, for which Zigzag will not draw the second maximum (or minimum), if the last one is Deviation less (or greater) than the previous one;
Deviation — the minimum number of points between the Highs/Lows of two adjacent candlesticks for the Zigzag to form a local top/bottom;
Backstep — the minimum number of candlesticks between the local Highs/Lows;
Bars to calculate ZZ — the number of bars in the history for finding ZigZag points;
ZZ-wave info — what information about the wave, to show in the table — only the current wave or the current + previous one;
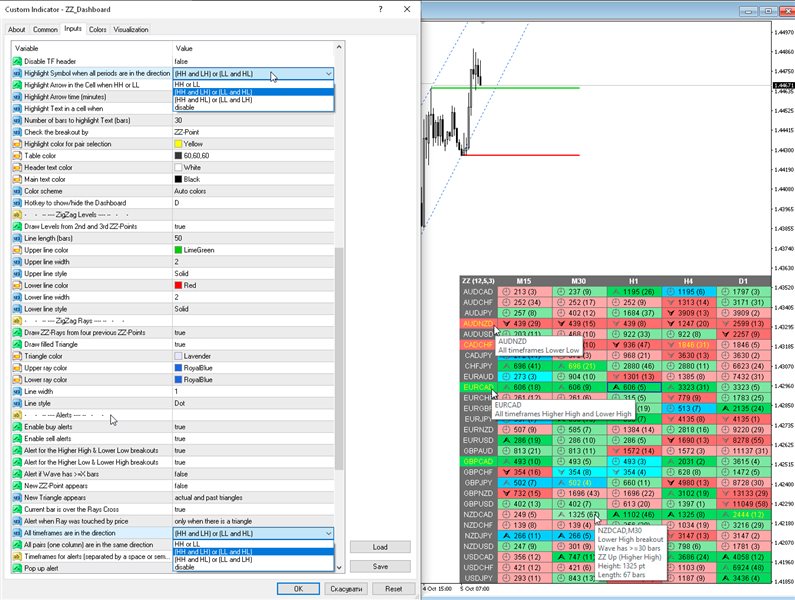
Highlight the symbol when all periods are in the same direction;
Symbol highlight time (minutes, 0-all the time);
Highlight cells mode
    — Wave has >=X bars — highlight cells in which the number of bars is greater than or equal to X;
      Breakout & ZZ-pt on current bar — highlight cells when the previous ZigZag point is broken (the ZZ-point is on the current bar);
      ZZ-pt on current bar — highlight cells when a ZZ-point appears on the current bar. The new or changed wave;
      Price touched ZZ-Ray — highlight cells when the ZigZag ray is touched by the price;
      disable - disable cell highlighting;
      Number of bars to highlight cells (bars) — how many bars should be in the ZigZag wave to highlight the cell;
      Clear the chart at startup — clear the chart at startup.
      Set of Pairs — set of symbols
          Market Watch — pairs from the "Market Watch". Do not use too many symbols, this may cause the indicator to slow down;
          Specified manually — pairs specified manually, in the parameters "Pairs";
          Current pair;
          Pairs (separated by a space or semicolon) — list of symbols separated by spaces or semicolons. The currency names should be written exactly like the broker's, keeping the case and prefix/suffix.
          Time Frames (separated by a space or semicolon) — list of timeframes separated by spaces or semicolons (multi timeframe).
          Sort pairs — sorting the list of pairs.
          Position on chart — corner to display the panel on the chart.
          X offset (pix) — shift the panel along the X axis;
          Y offset (pix) — shift the panel along the Y axis;
          Refresh dashboard every (seconds) — update period for all pairs and timeframes.
          Open the pair in a new window — open a symbol in a new chart window by clicking.
          Chart template — the name of the template for the chart, if the chart opens in a new window.
          Color Up — cell color if the indicator increases.
          Color Down — cell color if the indicator decreases.
          Color Highlight — text highlight color.
          Transparency (0-255) — transparency of the panel.
          Font name.
          Font size.
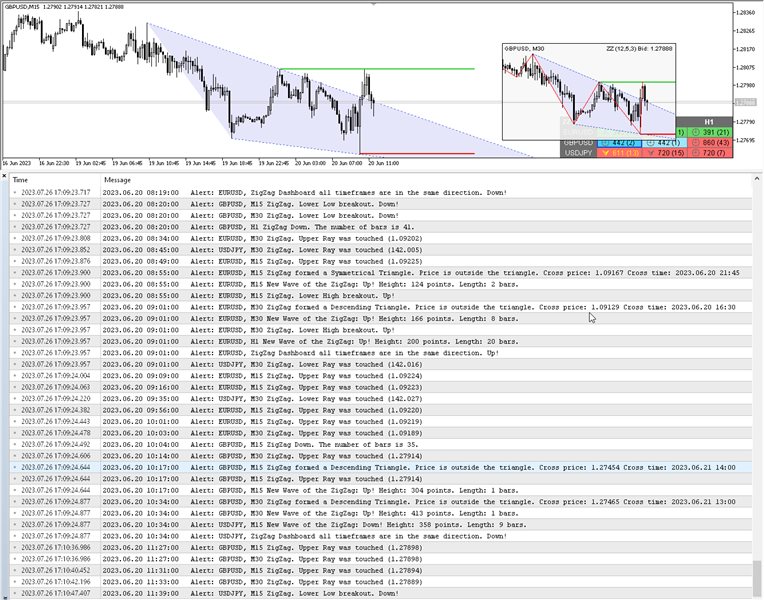
            Alerts
            Timeframes for alerts (separated by a space or semicolon) — list of periods for which the alert will be sent (separated by a space or semicolon).
            Alert if wave has >= X bars — alert if the ZigZag wave has a number of bars greater than or equal to X.
            Alert for the Higher High & Lower Low breakouts — alert if the previous HH or LL is broken.
            Alert for the Higher Low & Lower High breakouts —  alert if the previous HL or LH is broken.
            New ZZ-Point appears — alert if a new ZigZag point appears.
            New Triangle appears.
            Current bar is over the Rays Cross.
            Alert when Ray was touched by price.
            All timeframes are in the same direction.
            All pairs (one column) are in the same direction.

            All timeframes are in the same direction — alert when all timeframes are in the same direction.
            All pairs (one column) are in the same direction.
            Pop up alert.
            Push notifications.
            E-mail notifications.
            Sound alert.


            Reviews 2
            Alexander Eduardo Camarena Hermoso
            300
             

            Excelente indicador, lo mejor que eh visto, mil gracias

            clausejmbm123
            346
            clausejmbm123 2020.11.23 22:02 
             

            I am really pleased with this dashboard. It took my trading to the next level. The support is great. I requested a few changes on the system, which were realized on the same day. I am looking forward to buying the same dashboard for MT4. Thank you very much for this amazing tool. I really appreciate it.

            Recommended products
            Engulfing Candlestick Bulkowski The engulfing candlestick is a well-known candle pattern composed of two candles. This indicator for showing engulfing candlestick that describe by Thomas Bulkowski. If you need for MetaTrader 4 version, please visit here: https://www.mql5.com/en/market/product/34193 Feature Highlights Show bullish engulfing and bearish engulfing. Customizable "Up Symbol". Customizable "Down Symbol". Customizable symbol distance from candlestick. Customizable "Down Color". Cus
            30 USD
            Fractal Channel Breakout MT5
            KEENBASE SOFTWARE SOLUTIONS
            KT Fractal Channel Breakout draws a continuous channel by connecting the successive Up and Down fractals. It provides alerts and also plots the Up and Down arrows representing the bullish and bearish breakout of the fractal channel. Features If you use Bill Williams fractals in your technical analysis, you must also include it in your trading arsenal. It can be very effective and useful for stop-loss trailing. A new market trend often emerges after a fractal channel breakout in a new directi
            30 USD
            The indicator determines the state of the market: trend or flat. The state of the market is determined by taking into account volatility. The flat (trading corridor)is displayed in yellow. The green color shows the upward trend. The red color shows the downward trend. The height of the label corresponds to the volatility in the market. The indicator does not redraw . Settings History_Size   - the amount of history for calculation. Period_Candles  - the number of candles to calculate the
            73 USD
            A Good , Easy , Readable and handy indicator for experienced and professional traders. It gives bounded signals between zero and one. Easy for investors to comprehend. It gives near and longer trading outlook to investors and helps them to find good opportunities. Indicator gives zero signal on price downturns and signal value equals to one on price upturns.   Once again a new type of indicator and rangebound between zero and one .
            30 USD
            TrendDetect
            Pavel Gotkevitch
            The Trend Detect indicator combines the features of both trend indicators and oscillators. This indicator is a convenient tool for detecting short-term market cycles and identifying overbought and oversold levels. A long position can be opened when the indicator starts leaving the oversold area and breaks the zero level from below. A short position can be opened when the indicator starts leaving the overbought area and breaks the zero level from above. An opposite signal of the indicator can
            30 USD
            Rwanda
            Tatiana Savkevych
            The main application of the Rwanda indicator is to generate buy and sell signals. Displays the Rwanda indicator signals on the price function chart using a mathematical approach. The indicator determines the long-term and short-term trend. The best result is given by the combination of the indicator with fundamental news, it can act as a news filter, that is, it can show how the market reacts to this or that news. With this indicator, you can predict future values. The indicator is designed t
            69 USD
            ATR Profesional
            Ignacio Agustin Mene Franco
            ATR Professional. is an indicator similar to the bollinger, but this back is more advanced to scalp and long in h4 or h1, It has its bands, the strategy is that it marks entry when the candle leaves the band, or does it bounce on the upper roof or lower floor, works for all seasons! works for forex markets and synthetic indices also crypto! Good profit! World Investor.
            50 USD
            Deviation trend
            VLADISLAV AKINDINOV
            Indicator of trend deviation with a static level. The deviation coefficient is set for the trend histogram. Signals are the intersection of the level trend histogram in the direction of the trend or during a trend reversal - the option is selected in the indicator settings by the "Revers" parameter. There are all the necessary settings for the design of the indication and sending messages to mail or a mobile terminal. All input parameters have an intuitive name. Analog for MT4: https://www.mql5.
            30 USD
            Trend Side - a technical indicator for determining the trend. It is a set of several full-fledged trading strategies. The indicator uses an advanced trend filtering system, has a statistical panel, calculates entry and exit levels, and calculates the dynamic Trailing Stop level. Suitable for any type of symbols, never redraws its signals and results. A comprehensive tool for professional trend trading. The set of the Trend Side indicator also includes Andrews Trend Scanner - a multi-currency
            50 USD
            LevelPAttern MT5 is a technical indicator based on the daily levels and Price Action patterns. The indicator is based on the standard ZigZag indicator + reversal candlestick pattens, such as Star, Hammer (also knows as Pin bar), Engulfing and others. The indicator generates audio and text notifications when a pattern is formed and a level is touched. It also supports sending email and push notifications. Indicator operation features It is suitable for working with any CFD and FOREX trading ins
            150 USD
            Introducing the Advanced SR Indicator. An indicator designed to help you identify the most crucial KEYLEVELs on your chart. Your Problem: You're unsure how to pinpoint significant price areas. You're drawing supply and demand or support and resistance zones like 99% of other traders. You find your drawn SD and SR zones ineffective. You're uncertain about the safety of your entry and exit points. Advanced SR will address all these issues. With an algorithm that employs volume to determine
            50 USD
            Owl Smart Levels MT5
            Sergey Ermolov
            4.42 (33)
            MT4 version  |  How to install?   |   FAQ The Owl Smart Levels Indicator is a complete trading system within the one indicator that includes such popular market analysis tools as Bill Williams' advanced fractals , Valable ZigZag which builds the correct wave structure of the market, and Fibonacci levels which mark the exact levels of entry into the market and places to take profits. Detailed description of the strategy Instructions for working with the indicator Advisor-assistant in trading Owl
            97 USD
            This is Gekko's Strong Bars indicator. It produces signals when there is a strong bullish or bearish bar, for that it uses three different conditions: 1 - when the current bar is higher/lower than the last x bars (x is an input parameter), 2 - when the current bar size is higher than the average size of the last x bars (x is an input parameter) and 3 - when the current bar has a short candle tail (shadow). Inputs Plot Strong Bar Arrows for the past X Historical Bars: number of historical bars
            50 USD
            The Trendline Automatic indicator is an advanced technical analysis tool specifically designed to assist traders in identifying critical levels in the financial markets through the automatic drawing of support and resistance trendlines on price charts. With its automatic capabilities, this indicator saves traders time and effort in analyzing price movements, allowing them to focus on making better trading decisions. Key Features : Automatic Drawing of Trendlines : This indicator allows traders t
            30 USD
            Trade Extractor MT5
            Philip Pankaj Suthagar
            2 (1)
            TRADE EXTRACTOR   is the fastest self-learning AI Algorithm, which will learn any market situation with ease.As a Manual trader, I came across the difficulty of finding the right parameter and the right condition to trade. There are infinite combinations of indicators and objects(trendlines, gann grid, fibo levels etc) which as an human, I can’t decide their winning rate or performance. Many claim to have a winning strategy but won’t have enough statistical support to prove their claims. Due to
            89 USD
            ACB Breakout Arrows MT5
            KEENBASE SOFTWARE SOLUTIONS
            5 (1)
            The ACB Breakout Arrows indicator provides a crucial entry signal in the market by detecting a special breakout pattern. The indicator constantly scans the chart for a settling momentum in one direction and provide the accurate entry signal right before the major move. Get multi-symbol and multi-timeframe scanner from here - Scanner for ACB Breakout Arrows MT 5 Key features Stoploss   and Take Profit levels are provided by the indicator. Comes with a MTF Scanner dashboard which tracks the br
            145 USD
            KT 4 Timeframe Trend MT5
            KEENBASE SOFTWARE SOLUTIONS
            The KT 4 Time Frame Trend is an invaluable forex indicator for traders seeking to identify the trend direction across 4-time frames accurately. This innovative indicator allows users to simultaneously observe and analyze price trends across four different timeframes. Whether you're a beginner or an experienced trader, this tool offers an enhanced understanding of trend dynamics, leading to improved trading strategies on your trading platform. The capability to concurrently monitor multiple timef
            30 USD
            R747 BreakLevels is smart indicator that automatically detects Support and Resistance levels on actual market trend. Strength of levels can be easily adjusted by changing parameter LevelsStrength in range of 2 (weak levels) and 50 (strong levels). This indicator is accessible in EA via iCustom functions and is fully customizable by user. There is possibility to send Push notifications and Alerts of newly found levels. Follow this link to get all detailed information: >> LINK << Features Adju
            30 USD
            Faradenza
            Tatiana Savkevych
            The main application of the Faradenza indicator is to generate buy and sell signals. The indicator tracks the market trend with unrivaled reliability, ignoring sharp market fluctuations and noise around the average price. Determining the market trend is an important task for traders. The Faradenza indicator implements an advanced algorithm for visualizing the market trend. It catches the trend and shows favorable moments of entering the market with arrows. The main purpose of the indicator is to
            109 USD
            HIGH and LOW OTT
            Mohammad Taher Halimi Tabrizi
            This product is converted form Trading View of Kivanc Ozbilgic to be used on MT5 and below are descriptions of developer on Trading View: Anıl Özekşi's latest development on his precious OTT - Optimized Trend Tracker: In this version, there are two lines of OTT which are derived from HIGHEST price values (HOTT) and LOVEST price values (LOTT) which were originally sourced to CLOSE values on default OTT. Another significant difference is there is no Support Line (Moving Average) in this ver
            35 USD
            ZigZag with Fibonacci
            Rafael Caetano Pinto
            This indicator uses the metaquotes ZigZag indicator as base to plot fibonacci extension and fibonacci retracement based in the Elliot waves. A fibonacci retracement will be plotted on every wave draw by the ZigZag. A fibonacci extension will be plotted only after the 2nd wave. Both fibonacci will be updated over the same wave tendency. Supporting until 9 consecutive elliot waves. Parameters: Depth: How much the algorithm will iterate to find the lowest and highest candles Deviation: Amoun
            30 USD
            Oscillator trading signals - это динамический индикатор, определяющий состояние к продолжению тенденции роста или падению цены торгового инструмента и отсечению зон с нежелательной торговлей. Индикатор состоит из 2 линий осцилляторов. Медленная и быстрая сигнальная линия.  Шкала отображения перевернутая. Зоны вблизи 0 свидетельствуют о тенденции роста цены валютной пары. Зоны -100 свидетельствуют о падении цены валютной пары. На основном графике в виде стрелок отображается потенциально выгодные
            50 USD
            Higher High Lower Low MT5
            KEENBASE SOFTWARE SOLUTIONS
            KT Higher High Lower Low marks the following swing points with their respective S/R levels: Higher High: The swing high made by the price that is higher than the previous high. Lower High: The swing high made by the price that is lower than the previous high. Lower Low: The swing low made by the price that is lower than the previous low.  Higher Low: The swing low made by the price that is higher than the previous low.   Features The intensity of swing high and swing low can be adjusted by cha
            30 USD
            Trade history
            Andriy Konovalov
            5 (3)
            The indicator plots charts of profit taken at the Close of candles for closed (or partially closed) long and short positions individually. The indicator allows to filter deals by the current symbol, specified expert ID (magic number) and the presence (absence) of a substring in a deal comment, to set the start time and the periodicity of profit reset (daily, weekly or monthly) to calculate the profit chart. The indicator also displays the floating (not fixed) profit of the opened positions at th
            30 USD
            Fibrillar
            Vitalii Zakharuk
            It is very easy to use the Fibrillar indicator, since the simplest is to look at the chart and act according to the indications of the colored arrows. The algorithm takes into account the measurement of prices, and this method also focuses on measuring each of the price drops (H / C, H / O, LC, LO) - which gives more detailed information, but also more averaged. When calculating this indicator, logarithmic gains are first calculated at the closing price, which allows you to filter out the tre
            66 USD
            An customize Indicator by which you can have Triple moving averages at close prices and send push notification on each crossing.  This indicator is especially useful when you are doing manual trading. Notes: Cation: forex trading is a very risky business,...              don't invest the money you cannot bear to lose.             the probability of losing is high ... more high aaaand exponentially high.... something like EMA enjoy losing with us...
            30 USD
            Liquidity Oscillator
            Paolo Scopazzo
            5 (1)
            A powerful oscillator that provide Buy and Sell signals by calculating the investor liquidity. The more liquidity the more buy possibilities. The less liquidity the more sell possibilities. Please download the demo and run a backtest! HOW IT WORKS: The oscillator will put buy and sell arrow on the chart in runtime only . Top value is 95 to 100 -> Investors are ready to buy and you should follow. Bottom value is 5 to 0 -> Investors are ready to sell and you should follow. Alert + sound will app
            39 USD
            Your Trend Friend
            Luigi Nunes Labigalini
            The trend is your friend! Look at the color of the indicator and trade on that direction. It does not  repaint. After each candle is closed, that's the color of the trend. You can focus on shorter faster trends or major trends, just test what's most suitable for the symbol and timeframe you trade. Simply change the "Length" parameter and the indicator will automatically adapt. You can also change the color, thickness and style of the lines. Download and give it a try! There are big movements
            99 USD
            WT Vwap Bands
            Ricardo Almeida Branco
            The WT Vwap Bands indicator is an indicator that combines price and volume, helping to show whether the price is within the "fair price", overbought or oversold. The indicator code was designed for performance and has already been tested in a real trading account. In addition to the visual inputs (color, thickness and line style), the user can define a% value that depends on the price. The default values work with the most distant band at 1% of the price and then dividing this distan
            40 USD
            This indicator scans the 1-3 Trendline pattern . The indicator is a 100 % non repaint low risk breakout system . The patterns are formed around swing high and swing lows which make them a low risk pattern with high reward. PATTERN BACKGROUND The 1-3 Trendline Breakout pattern is formed by four(4) points which are composed of three (3) primary points and the pattern neck. A trendline is always formed by the point 1 and the neck of the pattern . When price breaks out of the trendline formed ,
            89 USD
            Buyers of this product also purchase
            Description: First of all Its worth emphasizing here that this Trading System is Non-Repainting, Non-Redrawing and Non-Lagging Indicator, Which makes it ideal from both manual and robot trading.  For limited time only 50% OFF,  Now 100$ only. 4 purchases left & the price increases to 200$ Contact me right after the purchase to share with you the user manual. The “Smart Trend Trading System MT5” is a comprehensive trading solution tailored for new and experienced traders. It combines over 10 pre
            100 USD
            How many times have you bought a trading indicator with great back-tests, live account performance proof with fantastic numbers and stats all over the place but after using it, you end up blowing your account? You shouldn't trust a signal by itself, you need to know why it appeared in the first place, and that's what RelicusRoad Pro does best! NOW $147 (increasing to $499 after a few updates) - UNLIMITED ACCOUNTS (PCs or MACs) **  User Manual + Strategies + Training Videos + Private Group with
            147 USD
            TrendMaestro5
            Stefano Frisetti
            note: this indicator is for METATRADER4, if you want the version for METATRADER5 this is the link:  https://www.mql5.com/it/market/product/108106 TRENDMAESTRO recognizes a new TREND in the bud, he never makes mistakes. The certainty of identifying a new TREND is priceless. DESCRIPTION TRENDMAESTRO identifies a new TREND in the bud, this indicator examines the volatility, volumes and momentum to identify the moment in which there is an explosion of one or more of these data and therefore the mome
            397 USD
            Trend Screener Pro MT5
            STE S.S.COMPANY
            4.88 (52)
            Unlock the Power of  Trends trading with Trend Screener Indicator: Your Ultimate Trend Trading Solution powered by fuzzy logic and Multi-currencies System ! Elevate your trend trading with Trend Screener, the revolutionary trend indicator powered by   fuzzy logic.  It is a powerful trend-following indicator that combines over  13 premium tools and features and 3 trading strategies  , making it a versatile choice to   make your Metatrader a Trend Analyzer. LIMITED TIME OFFER : Trend Screener Indi
            50 USD
            FX Power MT5 NG
            Daniel Stein
            5 (2)
            Trading GOLD, and currencies, with the dog walk strategy  - super smart Trading GOLD, and currencies, with the breakout strategy  - super easy Get your daily market update with details and screenshots via our Morning Briefing  here on mql5  and  on Telegram ! FX Power MT5 NG  is the next generation of our long-time very popular currency strength meter, FX Power.  And what does this next-generation strength meter offer? Everything you have loved about the original FX Power  PLUS GOLD/XAU s
            169 USD
            Gold Stuff mt5
            Vasiliy Strukov
            4.9 (137)
            Gold Stuff mt5 is a trend indicator designed specifically for gold and can also be used on any financial instrument. The indicator does not redraw and does not lag. Recommended time frame H1. Contact me immediately after the purchase to get   personal bonus! Settings  and manual   here   SETTINGS Draw Arrow - on off. drawing arrows on the chart. Alerts -   on off audible alerts. E-mail notification - on off. email notifications. Puch-notification - on off. Push notifications. Next, adjust the co
            50 USD
            Quantum Heiken Ashi PRO MT5
            Bogdan Ion Puscasu
            5 (4)
            Introducing the Quantum Heiken Ashi PRO charts with integrated alerts Designed to provide clear insights into market trends, the Heiken Ashi candles are renowned for their ability to filter out noise and eliminate false signals. Say goodbye to confusing price fluctuations and hello to a smoother, more reliable chart representation. What makes the Quantum Heiken Ashi PRO truly unique is its innovative formula, which transforms traditional candlestick data into easy-to-read colored bars. Red and g
            99.99 USD
            Top indicator for MT5   providing accurate signals to enter a trade without repainting! It can be applied to any financial assets:   forex, cryptocurrencies, metals, stocks, indices .  Watch  the video  (6:22) with an example of processing only one signal that paid off the indicator! MT4 version is here It will provide pretty accurate trading signals and tell you when it's best to open a trade and close it. Most traders improve their trading results during the first trading week with the help of
            125 USD
            IX Power   finally brings the unbeatable precision of FX Power to non-Forex symbols. It accurately determines the intensity of short, medium and long-term trends in your favourite indices, stocks, commodities, ETFs, and even cryptocurrencies. You can   analyse everything   your terminal has to offer. Try it out and experience how   your timing improves significantly   when trading. Read about our latest strategic development -  Easy scalping with IX Power IX Power Key Features 100% precise
            99 USD
            FX Volume MT5
            Daniel Stein
            4.93 (14)
            Get your daily market update with details and screenshots via our Morning Briefing  here on mql5  and  on Telegram ! FX Volume is the FIRST and ONLY volume indicator that provides a REAL insight into the market sentiment from a broker's point of view. It provides awesome insights into how institutional market participants, like brokers, are positioned in the Forex market, much faster than COT reports. Seeing this information directly on your chart is the real game-changer and breakthrough solu
            249 USD
            ICT, SMC, SMART MONEY CONCEPTS, SMART MONEY, Smart Money Concept, Support and Resistance, Trend Analysis, Price Action, Market Structure, Order Blocks, BOS/CHoCH,   Breaker Blocks ,  Momentum Shift,   Supply&Demand Zone/Order Blocks , Strong Imbalance,   HH/LL/HL/LH,    Fair Value Gap, FVG,  Premium  &   Discount   Zones, Fibonacci Retracement, OTE, Buy Side Liquidity, Sell Side Liquidity, BSL/SSL Taken, Equal Highs & Lows, MTF Dashboard, Multiple Time Frame, BigBar, HTF OB, HTF Market Structur
            65 USD
            Description: First of all Its worth emphasizing here that this Trading Tool is Non-Repainting, Non-Redrawing and Non-Lagging Indicator, Which makes it ideal for professional trading and expert advisers. For limited time only 40% OFF,  Now 60$ only. 4 purchases left & the price increases to 100$ Attention, the application might not work in the strategy tester,    Try Demo here before you buy:   here . The Smart Price Action Concepts Indicator is a very powerful tool for both new and experienced
            60 USD
            Profit from market structure changes as price reverses and pulls back. The market structure reversal alert indicator identifies when a trend or price move is approaching exhaustion and ready to reverse. It alerts you to changes in market structure which typically occur when a reversal or major pullback are about to happen. The indicator identifies breakouts and price momentum initially, every time a new high or low is formed near a possible exhaustion point. The indicator draws in a rectangle on
            49 USD
            ICT, SMC, Smart Money Concept, Support and Resistance, Trend Analysis, Price Action, Market Structure, Order Blocks,   Breaker Blocks ,  Momentum Shift, Strong Imbalance,   HH/LL/HL/LH,    Fair Value Gap, FVG,  Premium  &   Discount   Zones, Fibonacci Retracement, OTE, Buyside Liquidity, Sellside Liquidity,  Liquidity Voids, Market Sessions ,Market Time,   , NDOG, NWOG,Silver Bullet,ict template  In the financial market, accurate market analysis is crucial for investors. To help investors better
            39 USD
            Auto Order Block with break of structure based on ICT and Smart Money Concepts Futures Break of Structure ( BoS )             Order block ( OB )            Higher time frame Order block / Point of Interest ( POI )    shown on current chart           Fair value Gap ( FVG ) / Imbalance   ,  MTF      ( Multi Time Frame )    Volume Imbalance     ,  MTF          vIMB Gap’s Equal High / Low’s     ,  MTF             EQH / EQL Liquidity               Current Day High / Low           HOD /
            53 USD
            AW Trend Predictor MT5
            AW Trading Software Limited
            4.75 (51)
            The combination of trend and breakdown levels in one system. An advanced indicator algorithm filters market noise, determines the trend, entry points, as well as possible exit levels. Indicator signals are recorded in a statistical module, which allows you to select the most suitable tools, showing the effectiveness of the signal history. The indicator calculates Take Profit and Stop Loss marks. Manual and instruction ->  HERE  / MT4 version ->  HERE How to trade with the indicator:  Trading wit
            55 USD
            Advanced Supply Demand MT5
            Bernhard Schweigert
            4.46 (13)
            Best Solution for any Newbie or Expert Trader! This indicator is a unique, high quality and affordable trading tool because we have incorporated a number of proprietary features and a new formula. With this update, you will be able to show double timeframe zones. You will not only be able to show a higher TF but to show both, the chart TF, PLUS the higher TF: SHOWING NESTED ZONES. All Supply Demand traders will love it. :) Important Information Revealed Maximize the potential of Advanced Suppl
            199 USD
            Matrix Arrow Indicator MT5
            Juvenille Emperor Limited
            5 (14)
            Matrix Arrow Indicator MT5  is a unique 10 in 1 trend following   100% non-repainting  multi-timeframe indicator that can be used on all symbols/instruments:   forex,   commodities,   cryptocurrencies,   indices,   stocks .  Matrix Arrow Indicator MT5  will determine the current trend at its early stages, gathering information and data from up to 10 standard indicators, which are: Average Directional Movement Index (ADX) Commodity Channel Index (CCI) Classic Heiken Ashi candles Moving Aver
            75 USD
            FX Trend MT5
            Daniel Stein
            4.63 (35)
            Get your daily market update with details and screenshots via our Morning Briefing  here on mql5  and  on Telegram ! Do you want to become a constantly profitable 5-star forex trader? Then  get our Stein Investments trading tools  and send us a screenshot to get your personal invitation to our exclusive trading chat with 500+ members. FX Trend displays the trend direction, duration, intensity and the resulting trend rating for all time frames in real time. You'll see at a glance at which dir
            66 USD
            TPSproTREND PrO MT5
            Roman Podpora
            5 (1)
            TPSpro TRENDPRO  - is a trend indicator that automatically analyzes the market and provides information about the trend and each of its changes, as well as giving signals for entering trades without redrawing! The indicator uses each candle, analyzing them separately. referring to different impulses - up or down impulse. Exact entry points into transactions for currencies, crypto, metals, stocks, indices!  -    To maximize the potential and learn how to trade using this indicator, read the full
            135 USD
            Blahtech Supply Demand MT5
            Blahtech Limited
            4.57 (14)
            Was: $299  Now: $99   Supply Demand uses previous price action to identify potential imbalances between buyers and sellers. The key is to identify the better odds zones, not just the untouched ones. Blahtech Supply Demand indicator delivers functionality previously unavailable on any trading platform. This 4-in-1 indicator not only highlights the higher probability zones using a multi-criteria strength engine, but also combines it with multi-timeframe trend analysis, previously confirmed swings
            99 USD
            Best Solution for any Newbie or Expert Trader! This Indicator is a unique, high quality and affordable trading tool because we have incorporated a number of proprietary features and a new formula. With only ONE chart you can read Currency Strength for 28 Forex pairs! Imagine how your trading will improve because you are able to pinpoint the exact trigger point of a new trend or scalping opportunity? User manual:   click here That's the first one, the original! Don't buy a worthless wannabe clone
            128 USD
            Strong Support mt5
            Vasiliy Strukov
            5 (9)
            Support and resistance levels have long been a powerful tool for market analysis. The Strong Support indicator plots support levels based on local price minima, and resistance levels based on local price maxima. My other developments can be viewed   here It is recommended to use together with a trend indicator, for example, Gold Stuff - this will allow you to trade according to the trend and simultaneously determine the zones of consolidation or trend reversal, as well as set stop loss and
            50 USD
            Smart Peak Bottom
            Xiaoyu Huang
            5 (2)
            This is a clear indicator for judging tops and bottoms, and it works well for Oscillating market. Promotional price 49$ → 59$ features good at judging tops and bottoms No redrawing, no drifting Fast calculation, no lag Rich reminder mode Multiple parameters and colors can be adjusted parameter "======== Main ========" HighLowPeriod1 = 9 HighLowPeriod2 = 60 HighLowPeriod3 = 34 HighLowEMAPeriod = 4 MASignalPeriod = 5 "======== Notify ========" UseAlertNotify = true; UseMetaQuotesIDNotify =
            49 USD
            Stargogs Spike Catcher
            Lorenzo Edward Beukes
            4.71 (7)
            Stargogs Spike Catcher V3.12 This Indicator is Developed To milk the BOOM and CRASH indices . Send me Message if you need any help with the indicator.  CHECK OUT THE STARGOGS SPIKE CATCHER EA/ROBOT V3: CLICK HERE ALSO CHECK OUT SECOND TO NONEFX SPIKE CATCHER:   CLICK HERE STARGOGS SPIKE CATCHER V3.12 WHATS NEW! Brand New Strategy. This is the Indicator you need for 2023. The Indicator Gives you an Entry at a time when conditions are met enter on every arrow and exit when it gives an X. New Tren
            100 USD
            ICT Template MT5
            David Perk
            4.33 (6)
            ICT Template Indicator visualizes and automatically updates all important ICT elements for Scalpers, Day and Swing traders. It allows you too keep your chart clean and bring any elements by just one click to the buttons. Thanks to mobile notifications on external liquidity levels, you will not miss any opportunity and you don't have to sit behind the screens whole day. Each element has fully customizable colours, width, line types, max timeframe to be shown etc... so you can really tweak your ch
            49 USD
            Introducing the Heracles Indicator. This indicator makes trading easy without the need for analysis. It automatically identifies build-up zones, entry points, and provides clear take profit levels. The Heracles Indicator will alert you and display signal arrows when the price reaches the buy or sell entry points, also suggesting three take profit levels. It is suitable for both novice and professional traders. Channel Support:   Click Here MT4 Version:   Click Here Recommendations: Tim
            75.99 USD
            I recommend you to read the   product's blog  (manual) from start to end so that   it is clear from the beginning what the indicator offers. This multi time frame and multi symbol indicator identifies double top/bottom, head & shoulder, pennant/triangle and flag patterns. It is also possible to setup alerts only when a neckline/triangle/flagpole breakout has occured (neckline breakout = confirmed signal for top/bottoms and head & shoulders). The indicator can also be used in single chart mode.
            59 USD
            Royal Scalping Indicator M5
            Vahidreza Heidar Gholami
            5 (8)
            My products are currently 50% off. Explore them and build your own strategy. Royal Scalping Indicator is an advanced price adaptive indicator designed to generate high-quality trading signals. Built-in multi-timeframe and multi-currency capabilities make it even more powerful to have configurations based on different symbols and timeframes. This indicator is perfect for scalp trades as well as swing trades. Royal Scalping is not just an indicator, but a trading strategy itself. Features Price A
            69 USD
            Reversal First Impulse levels (RFI)   - are the   maximum volume   levels/areas that turn the market around, so they play a critical role in future trading decisions. The logic behind the movement of any chart is that the price moves from the first impulse level (RFI) to the first impulse level (RFI) of the past trend. The first impulse level (RFI) is the most powerful level during a trend reversal, which forms a reversal zone. The first impulse level from the reversal of the previous movement i
            125 USD
            More from author
            Multicurrency and multitimeframe modification of the Stochastic Oscillator. You can specify any desired currencies and timeframes in the parameters. The panel displays the current values and intersections of the lines — Signal and Main (stochastics crossover). Also, the indicator can send notifications when crossing overbought and oversold levels. By clicking on a cell with a period, this symbol and period will be opened. This is MTF Scanner. The key to hide the dashboard from the chart is "D"
            37.50 USD
            ZigZag Lines MTF
            Taras Slobodyanik
            4.2 (10)
            Multitimeframe ZigZag indicator. It displays the support/resistance lines and their breakouts, as well as draws the current targets of the market. It can also display lines of the Fractals indicator and candles from other periods (up to Quarterly).  The indicator redraws the last (current) point, and in some cases can change the last 2-3 points. All lines are drawn as objects (not indicator buffers, but there is a possibility to receive the data for the EA ). When used in an Expert Advisor,
            35 USD
            Multicurrency and multitimeframe modification of the Relative Strength Index (RSI) indicator. You can specify any desired currencies and timeframes in the parameters. Also, the panel can send notifications when crossing overbought and oversold levels. By clicking on a cell with a period, this symbol and period will be opened. This is MTF Scanner. The key to hide the dashboard from the chart is "D" by default. Similar to the Currency Strenghth Meter, the Dashboard can automatically select pairs
            37.50 USD
            Heikin Ashi Dashboard
            Taras Slobodyanik
            5 (3)
            Multi-currency and multitimeframe Heikin Ashi indicator. Shows the current state of the market. On the scanner panel you can see the direction, strength and number of bars of the current trend. The Consolidation/Reversal candles are also shown using color. You can specify any desired currencies and periods in the parameters. Also, the indicator can send notifications when the trend changes or when reversal and consolidation candles (dojis) appear. By clicking on a cell, this symbol and period wi
            37.50 USD
            Pro Sessions MT5
            Taras Slobodyanik
            This is an indicator of trading sessions  that can display all levels (Open-High-Low-Close) for four sessions . The indicator can also predict session levels. Sessions can be drawn with lines or rectangles (empty or filled), lines can be extended to the next session. You can easily hide/show each session by pressing hotkeys (by default '1', '2', '3', '4'). You can see ASR (Average Session Range) lines  (default hotkey 'A'). This is similar to the ADR calculation, only it is calculated based on
            35 USD
            ADX Dashboard
            Taras Slobodyanik
            5 (3)
            ADX indicator is used to determine the trend and its strength. The direction of the price is shown by the +DI and -DI values, and the ADX value shows the strength of the trend. If +DI is above -DI, then the market is in an uptrend, if on the contrary, it is a downtrend. If ADX is below 20, then there is no definite direction. As soon as the indicator breaks this level, a medium-strength trend begins. Values above 40 indicate a strong trend (a downtrend or an uptrend). Multicurrency and multit
            37.50 USD
            Pro Sessions MT4
            Taras Slobodyanik
            4 (2)
            This is an indicator of trading sessions  that can display all levels (Open-High-Low-Close) for four sessions. The indicator can also predict session levels. Sessions can be drawn with lines or rectangles (empty or filled), lines can be extended to the next session. You can easily hide/show each session by pressing hotkeys (by default '1', '2', '3', '4'). You can see ASR (Average Session Range) lines  (default hotkey 'A'). This is similar to the ADR calculation, only it is calculated based on t
            35 USD
            Multicurrency and multitimeframe indicator of the Standard Deviation Channel. Displays the current direction of the market. On the panel, you can see breakouts and touches (by price) of the levels of the linear regression channel. In the parameters, you can specify any desired currencies and timeframes. Also, the indicator can send notifications when levels are touched. By clicking on a cell, this symbol and period will be opened. This is MTF Scanner. The key to hide the dashboard from the char
            37.50 USD
            Heikin Ashi Dashboard MT5
            Taras Slobodyanik
            5 (1)
            Multi-currency and multitimeframe Heikin Ashi indicator. Shows the current state of the market. On the scanner panel you can see the direction, strength and number of bars of the current trend. The Consolidation/Reversal candles are also shown using color. You can specify any desired currencies and periods in the parameters. Also, the indicator can send notifications when the trend changes or when reversal and consolidation candles (dojis) appear. By clicking on a cell, this symbol and period wi
            37.50 USD
            MA Dashboard
            Taras Slobodyanik
            4.5 (2)
            Multicurrency and multitimeframe modification of the indicator Moving Average (MA). On the dashboard you can see the current state of the indicator - breakouts and touches (by price) of the Fast MA and Slow MA, as well as the intersection of the MA lines between each other (moving average crossover) . In the parameters you can specify any desired currencies and timeframes. Also, the indicator can send notifications about the price touching the lines and about their crossing. By clicking on a cel
            37.50 USD
            ZigZag Lines MTF for MT5
            Taras Slobodyanik
            5 (7)
            Multitimeframe ZigZag indicator. It displays the support/resistance lines and their breakouts, as well as draws the current targets of the market. It can also display lines of the Fractals indicator and candles from other periods (up to Quarterly).  The indicator redraws the last (current) point, and in some cases can change the last 2-3 points. All lines are drawn as objects (not indicator buffers, but there is a possibility to receive the data for the EA ). When used in an Expert Advisor,
            35 USD
            ZigZag Dashboard for MT4
            Taras Slobodyanik
            5 (3)
            Multicurrency and multitimeframe modification of the ZigZag indicator. Displays the current direction of the market, the height of the last movement, the number of bars in this movement and the breaking of the previous point of the ZigZag. This is MTF Scanner. You can specify any desired currencies and timeframes in the parameters. Also, the panel can send notifications when the ZigZag changes direction or when there was a breakthrough of the previous point. By clicking on a cell with a perio
            37.50 USD
            MA Dashboard MT5
            Taras Slobodyanik
            5 (4)
            Multicurrency and multitimeframe modification of the indicator Moving Average (MA). On the dashboard you can see the current state of the indicator - breakouts and touches (by price) of the Fast MA and Slow MA, as well as the intersection of the MA lines between each other (moving average crossover). In the parameters you can specify any desired currencies and timeframes. Also, the indicator can send notifications about the price touching the lines and about their crossing. By clicking on a cell
            37.50 USD
            Lines Profit Loss MT5
            Taras Slobodyanik
            4.54 (13)
            The indicator displays profit (loss) on the current symbol. You can freely drag and drop the line to display the current profit or loss. Parameters Calculation in money or in points — calculate the profit/loss in points or money. Add pending orders to calculate — take pending orders into account in calculations. Magic Number (0 - all orders on symbol) — magic number, if it is necessary to evaluate specific orders. Offset for first drawing (points from the average price) — offset of the line f
            FREE
            Time Scale for MT5
            Taras Slobodyanik
            4.85 (13)
            The indicator draws the time scale on the chart. You can specify the time offset, adjust the size and font to display on the chart ( it is displaying your local time on your chart instead of MT time ). You can also select the desired format for displaying the date and time. You may be interested in my other product , which contains a more advanced version of the Time Scale . Parameters Hours (time shift) — time shift (hours); Minutes (time shift) — time shift (minutes); Show time on mouse — sh
            FREE
            Magnifier Ruler Crosshair
            Taras Slobodyanik
            5 (1)
            The indicator has three main tools: Magnifier (Zoom chart), Ruler  ( Time and Price scales ),   and Crosshair. You can move it all around with your mouse and customize different formats for  displaying , customize   size and color of each element. The Magnifier (zoom chart) allows you to display candles from any time frame and at different scales. Default hotkeys: 'Q' - higher timeframe, 'A' - lower timeframe, 'W' - decrease candle size, 'S' - increase candle size, 'Z' - show/hide zoom chart.
            37.50 USD
            Lines Profit Loss
            Taras Slobodyanik
            4.78 (18)
            The indicator displays profit (loss) on the current symbol. You can freely drag and drop the line to display the current profit or loss. Parameters Calculation in money or in points — calculate the profit/loss in points or money. Add pending orders to calculate — take pending orders into account in calculations. Magic Number (0 - all orders on symbol) — magic number, if it is necessary to evaluate specific orders. Offset for first drawing (points from the average price) — offset of the line fr
            FREE
            Multicurrency and multitimeframe modification of the Relative Strength Index (RSI) indicator. You can specify any desired currencies and timeframes in the parameters. Also, the panel can send notifications when crossing overbought and oversold levels. By clicking on a cell with a period, this symbol and period will be opened. This is MTF Scanner. The key to hide the dashboard from the chart is "D" by default. Similar to the Currency Strenghth Meter, the Dashboard can automatically select pairs c
            37.50 USD
            The indicator has three main tools: Magnifier (Zoom chart), Ruler  ( Time and Price scales ),   and Crosshair. You can move it all around with your mouse and customize different formats for  displaying , customize   size and color of each element. The Magnifier (zoom chart) allows you to display candles from any time frame and at different scales. Default hotkeys: 'Q' - higher timeframe, 'A' - lower timeframe, 'W' - decrease candle size, 'S' - increase candle size, 'Z' - show/hide zoom chart.
            37.50 USD
            CCI Dashboard for MT4
            Taras Slobodyanik
            5 (3)
            Multicurrency and multitimeframe modification of the Commodity Channel Index (CCI) indicator. You can specify any desired currencies and timeframes in the parameters. Also, the panel can send notifications when crossing overbought and oversold levels. By clicking on a cell with a period, this symbol and period will be opened. This is MTF Scanner. The key to hide the dashboard from the chart is "D" by default. Parameters CCI Period — averaging period. CCI Applied price — price type. Clear
            37.50 USD
            Multicurrency and multitimeframe modification of the indicator Bollinger Bands. On the dashboard you can see breakouts and touches of the Bollinger Bands. In the parameters you can specify any desired currencies and timeframes. The indicator can also send notifications when the price touches the Bollinger Bands, when the current volatility changes (expands or falls), and when the price touches all the bands. By clicking on a cell with a period, this symbol and period will be opened. This is MTF
            37.50 USD
            This dashboard displays current news from three sources: from the ForexFactory.com website (FFC calendar), from the Investing.com website and the Economic Calendar from mql5.com. You can sort news by impact and by country, and display them on the chart with one click. By holding down the 'Ctrl' key, you can select several different 'currencies' or 'impacts' to sort. Also, this utility shows not only the forecast, but also the actual values ​​after they appear on the site. You can set a separate
            59 USD
            Easy Grider for MT5
            Taras Slobodyanik
            5 (1)
            The EA creates an order grid using labels. Opening and closing of the grid is done either automatically by the system signals or manually. In the same grid can be both Limit and Stop orders. It is possible to reverse the grid on specified condition. You can enter the breakdown/rebound from established levels. All types of Sell limit, Buy limit, Buy stop, Sell stop orders are supported. The grid is rebuilt with a single click. The stop loss and take profit lines can be easily modified. You are f
            150 USD
            Multicurrency and multitimeframe modification of the Stochastic Oscillator. You can specify any desired currencies and timeframes in the parameters. The panel displays the current values and intersections of the lines — Signal and Main (stochastics crossover). Also, the indicator can send notifications when crossing overbought and oversold levels. By clicking on a cell with a period, this symbol and period will be opened. This is MTF Scanner. The key to hide the dashboard from the chart is "D"
            37.50 USD
            Inside Bar Dashboard
            Taras Slobodyanik
            5 (1)
            Multicurrency and multi-timeframe indicator Inside Bar (IB). In the parameters, you can specify any desired currencies and timeframes. The panel displays the last found Inside Bar (and Mother Bar) pattern, the current price position and the breakout of the levels of the Mother and Inside Bars. You can set the size and color for bars and text in the cells. The indicator can also send notifications when levels are broken. By clicking on a cell with a period, the specified symbol and period will b
            37.50 USD
            Fractals Dashboard MT5
            Taras Slobodyanik
            5 (2)
            Multicurrency and multitimeframe modification of the Fractals indicator. Displays the last two fractals — their sequence (and which one is broken), or the distance between them. You can specify any desired currencies and timeframes in the parameters. Also, the panel can send notifications on a fractal's breakout. By clicking on a cell with a period, this symbol and period will be opened. This is MTF Scanner. The key to hide the dashboard from the chart is "D" by default. Parameters Calculatio
            37.50 USD
            News Dashboard MT4
            Taras Slobodyanik
            4.33 (6)
            This dashboard displaying current news from ForexFactory.com (calendar FFC) and from the Investing.com website . You can sort news by impact and by country, and display them on the chart with one click. By holding down the 'Ctrl' key, you can select several different 'currencies' or 'impacts' to sort. Also, this utility shows not only the forecast, but also the actual values ​​after they appear on the site. You can set a separate notification for each news. You can read the news using your EA
            49 USD
            Symbol Manager for MT5
            Taras Slobodyanik
            5 (1)
            Symbol Manager or Grid Manager, designed to group orders into one position (by symbol and by direction). This utility will be useful to multi-currency traders, who can have multiple orders on several pairs. You will be able to see the total number of lots, the total profit, and set virtual stop loss and virtual take profit. To set a real TP (or SL), you must first set the virtual value, and then enter the command in this cell: "set". If you want to set real TP/SL for all orders at once, then en
            40 USD
            ADX Dashboard MT5
            Taras Slobodyanik
            5 (1)
            ADX indicator is used to determine the trend and its strength. The direction of the price is shown by the +DI and -DI values, and the ADX value shows the strength of the trend. If +DI is above -DI, then the market is in an uptrend, if on the contrary, it is a downtrend. If ADX is below 20, then there is no definite direction. As soon as the indicator breaks this level, a medium-strength trend begins. Values above 40 indicate a strong trend (a downtrend or an uptrend). Multicurrency and multit
            37.50 USD
            Multicurrency and multitimeframe modification of the indicator Bollinger Bands. On the dashboard you can see breakouts and touches of the Bollinger Bands. In the parameters you can specify any desired currencies and timeframes. The indicator can also send notifications when the price touches the Bollinger Bands, when the current volatility changes (expands or falls), and when the price touches all the bands. By clicking on a cell with a period, this symbol and period will be opened. This is MTF
            37.50 USD
            Filter:
            Alexander Eduardo Camarena Hermoso
            300
             

            Excelente indicador, lo mejor que eh visto, mil gracias

            clausejmbm123
            346
            clausejmbm123 2020.11.23 22:02 
             

            I am really pleased with this dashboard. It took my trading to the next level. The support is great. I requested a few changes on the system, which were realized on the same day. I am looking forward to buying the same dashboard for MT4. Thank you very much for this amazing tool. I really appreciate it.

            Reply to review
            Version 4.60 2023.11.30
            1) Added alert "Previous and Current waves have the same number of bars".
            2) Added the "Code Page for Characters" parameter. If your system uses a different encoding (for example, Chinese or Japanese), then you may need to change this setting in order to see the characters correctly in the dashboard.
            Version 4.50 2023.11.11
            1) Added automatic shifting of the dashboard to the foreground.
            Version 4.40 2023.10.05
            1) Added cell fill colors for Higher High (HH), Lower High (LH), Higher Low (HL), Lower Low (LL).
            2) Added highlighting parameters for a Symbol (Pair) if all timeframes contain the specified combination HH-LH-HL-LL.
            3) Added alert parameters for a Symbol (Pair) if all timeframes contain the specified combination HH-LH-HL-LL.
            4) Tooltips have been changed.
            Version 4.30 2023.09.03
            1) Added "Hotkey to enable/disable the Popup chart" parameter for "Popup chart".
            2) Added "Y-offset (pix)" parameter for "Popup chart".
            3) Added a Dashboard recovery check when running multiple copies on the same chart.
            Version 4.20 2023.08.25
            1) Returned the deletion of the dashboard from the chart at startup.
            Version 4.10 2023.08.18
            1) Optimization of pop-up windows for MT5.
            Version 4.0 2023.07.26
            1) Various alerts have been added for the Triangle. Also cell fill colors when the price is in the Triangle.
            2) Added more tooltips, fixed some text descriptions.
            3) Added "Color scheme" parameter.
            4) Added a hotkey to hide the dashboard, by default "D".
            5) Added "Popup chart" parameters. Now, when you hover the mouse over the cells, you can see a pop-up chart from this timeframe.
            6) The condition of the list of pairs for the second parameter has been changed. Pairs in the second parameter must be typed only with a semicolon and must be in exact case. "Pairs (separated ONLY by a semicolon and have exact letter case)"
            7) Code optimization and bug fixes.
            Version 3.90 2023.06.11
            1) Added the ability to enable/disable alerts for each Symbol when clicking on the name of the Pair. If no Pair is selected then alerts are enabled for all Symbols.
            Version 3.80 2022.12.10
            1) Changed description of some parameters and tooltips.
            Version 3.70 2022.09.21
            1) Added parameters for displaying rays at the last ZigZag points ("Draw ZZ-Rays").
            2) Added alerts for Rays (Alert when Ray was touched by price).
            3) Added a new mode of text highlighting in a cell (Highlight Text in a cell when Price touched ZZ-Ray).
            4) Added different colors for highlighting text and arrows.
            5) Renamed some parameters for better understanding.
            6) Changed the selection of the cell with the current Symbol/TF.
            7) Added more description to tooltips.
            Version 3.60 2022.08.19
            1) Added a parameter to highlight the arrow in the cell at "Higher High breakout" and "Lower Low breakout".
            Version 3.50 2022.06.24
            1) Added a description of the parameters of the ZZ in the upper cell.
            Version 3.40 2022.04.09
            1) Cell selection is disabled if there is one pair and one timeframe in the table.
            Version 3.30 2022.03.18
            1) Added parameter: 'Alert for the Higher High & Lower Low breakouts'.
            2) Added parameter: 'Alert for the Higher Low & Lower High breakouts'.
            3) Added tooltip for cells.
            4) Changed the color of the arrows for different breakouts.
            Version 3.20 2021.08.24
            1) Fixed a bug when launching many indicators with the "Current pair" parameter.
            Version 3.10 2021.08.06
            1) Added parameter "Change the cell brightness of current TF & Symbol (from -50 to 50)".
            Version 3.0 2021.04.16
            1) Added parameter "Allow to move the table manually".
            Version 2.80 2021.04.10
            1) Added calculation modes: "ZigZag (High-Low)" and "ZigZag (Close)".
            2) Now, after double-clicking on the table headers, you can move it with the mouse. The binding to the corner of the chart remained unchanged.
            Version 2.70 2021.04.08
            1) Added a parameter: Change the cell color only after the breakout of the ZZ-point.
            Version 2.60 2021.03.19
            1) Added options to disable the table headers.
            Version 2.50 2021.02.27
            1) Added parameter: "Draw lines from 2nd and 3rd points".
            Version 2.40 2021.02.20
            1) Added parameters: "Enable buy alerts" and "Enable sell alerts".
            Version 2.30 2020.12.08
            1) Added alert "All pairs (one column) are in the same direction".
            Version 2.20 2020.11.21
            1) Added parameter: "Symbol highlight time (minutes, 0-all the time)".
            Version 2.10 2020.11.19
            1) Added parameter: "Highlight symbol when all periods are in the same direction".
            Version 2.0 2020.11.18
            1) Added alert when all timeframes show in the same direction.
            Version 1.80 2020.11.15
            1) For the parameter "Set of Pairs" added the option "Current pair".
            2) Added cell highlighting modes.
            Version 1.70 2020.06.08
            1) Recompilation for the new MT5 build.
            Version 1.60 2020.03.06
            1) Added cell highlighting if the number of bars in the wave >= X bars.
            2) Added alert if the number of bars in the wave >= X bars.
            Version 1.50 2019.10.27
            1) Added periods for alerts - "Timeframes for alerts".
            2) Added parameter for clearing the chart at startup - "Clear the chart at startup".
            3) Added center alignment of the panel - "Centered".
            4) Added offsets for the panel - "X offset (pix)" and "Y offset (pix)".
            5) Reverse the order of pairs of "Market Watch" without sorting.
            Version 1.40 2019.05.01
            1) Added parameter: "Bars to calculate ZZ".
            2) Fixed incorrect display for high Depth.
            Version 1.30 2019.02.19
            1) Added modes for alerts.
            2) Added the option to display information about the previous wave.
            Version 1.20 2018.11.04
            1) Added arrows showing the breaking through of the previous point and the corresponding alerts.
            2) The number of bars is displayed in accordance with the cross on the MT toolbar.
            Version 1.10 2018.11.04
            1) Added the number of bars in the ZigZag.