Dashboard Stochastic Multicurrency

5

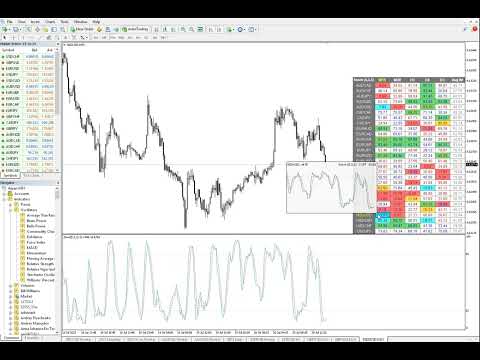
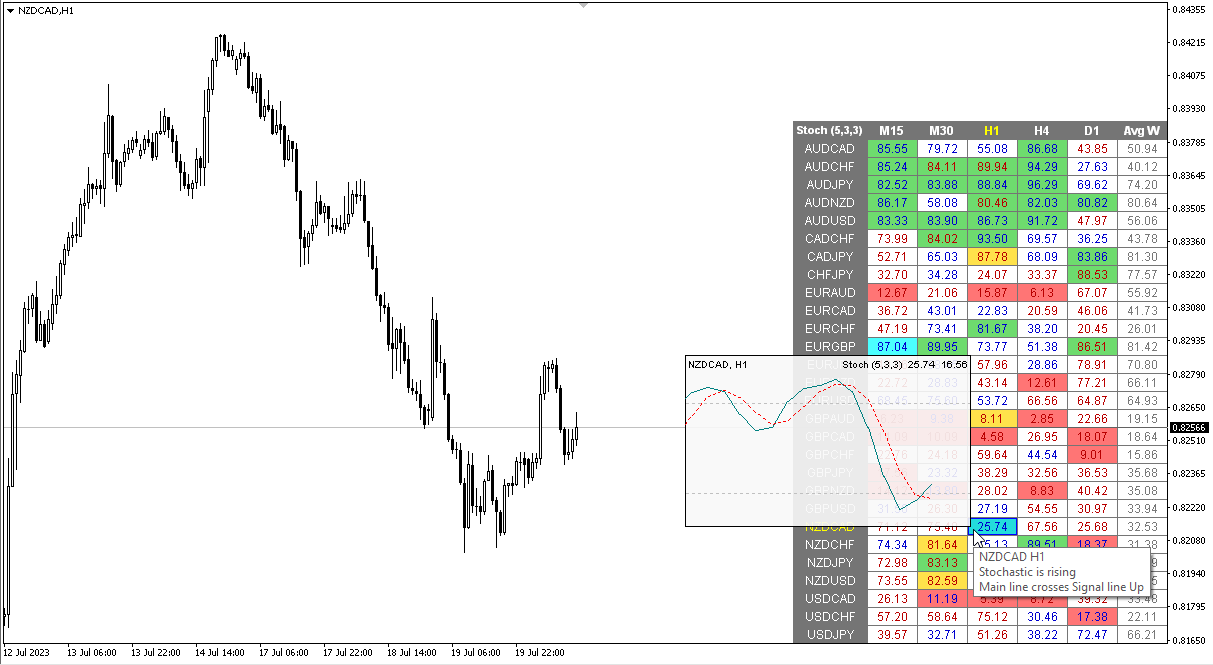
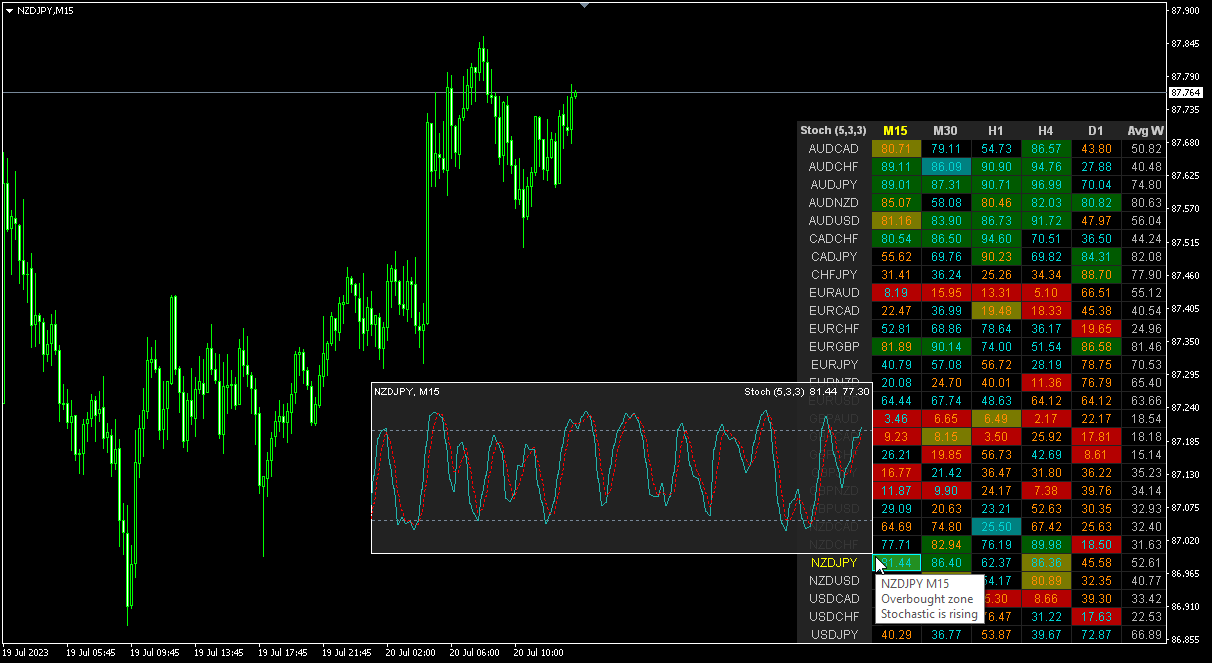
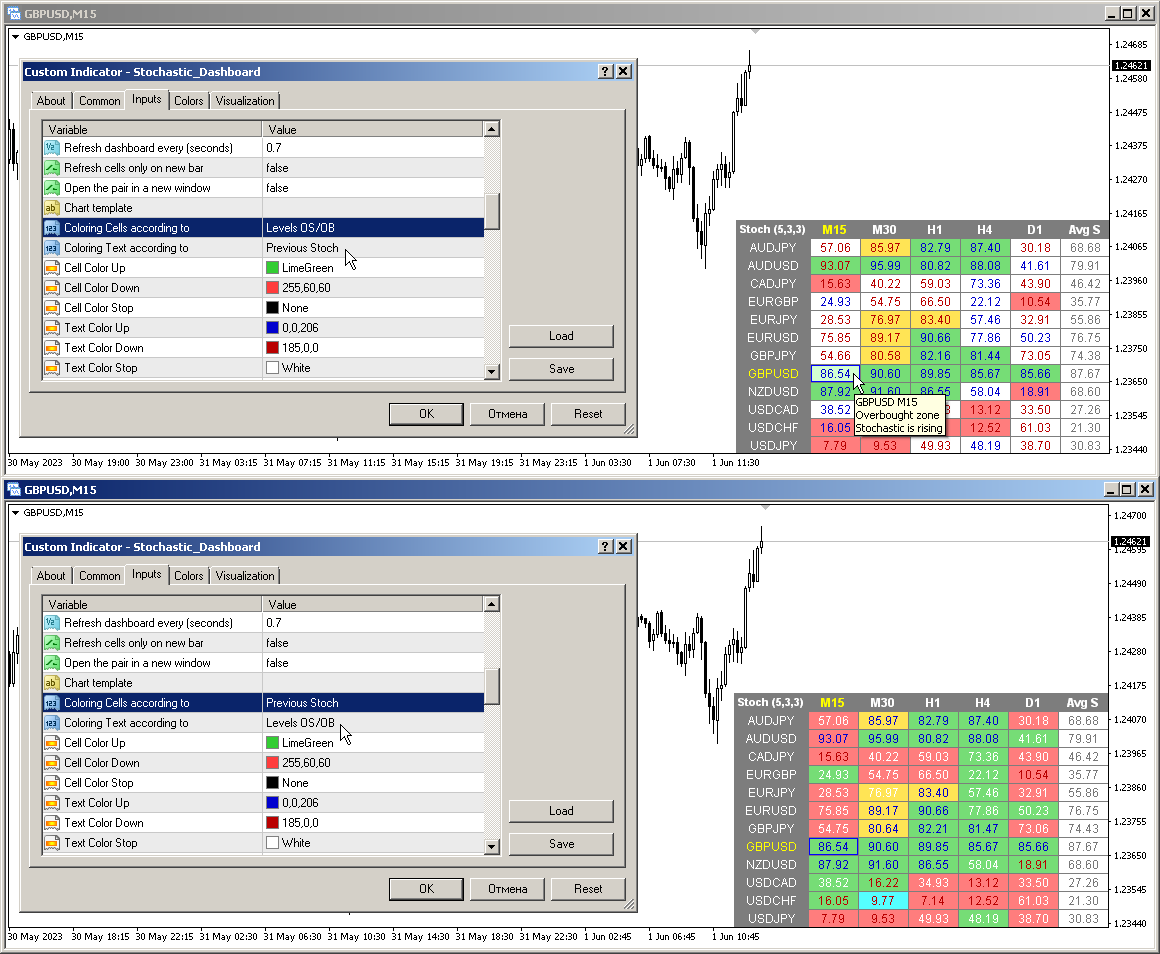
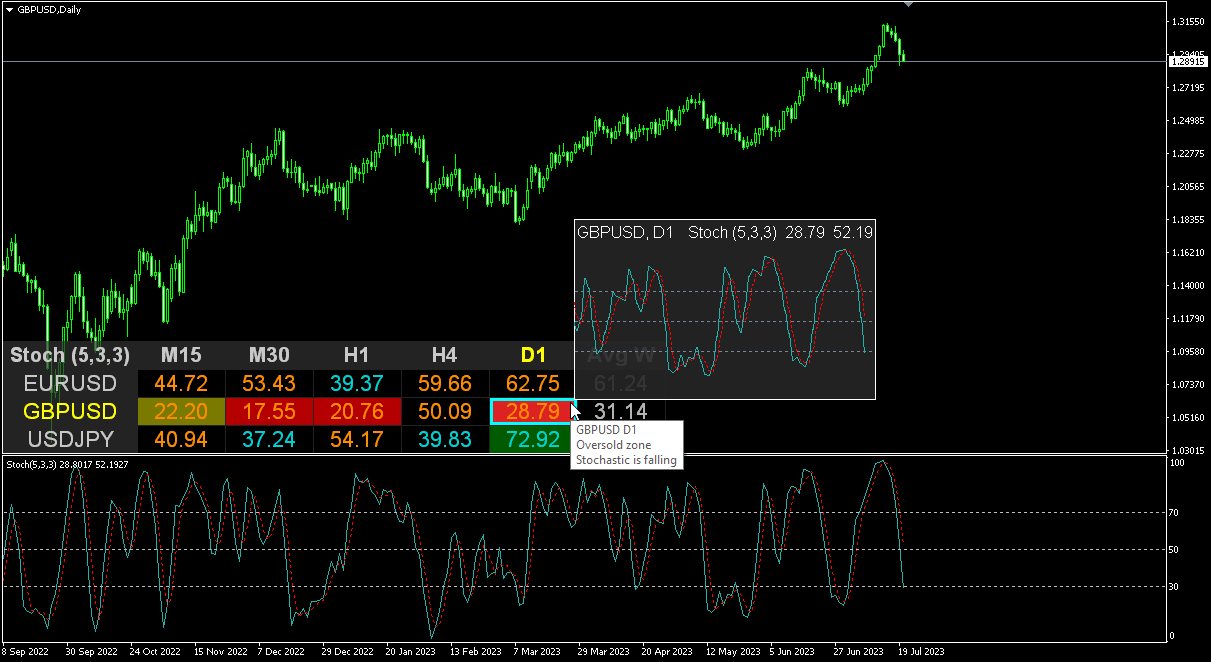
Multicurrency and multitimeframe modification of the Stochastic Oscillator — Stochastic Dashboard . You can specify any desired currencies and timeframes in the parameters. The panel displays the current values and intersections of the lines — Signal and Main (stochastics crossover). Also, the indicator can send notifications when crossing overbought and oversold levels. By clicking on a cell with a period, this symbol and period will be opened. This is MTF Scanner.

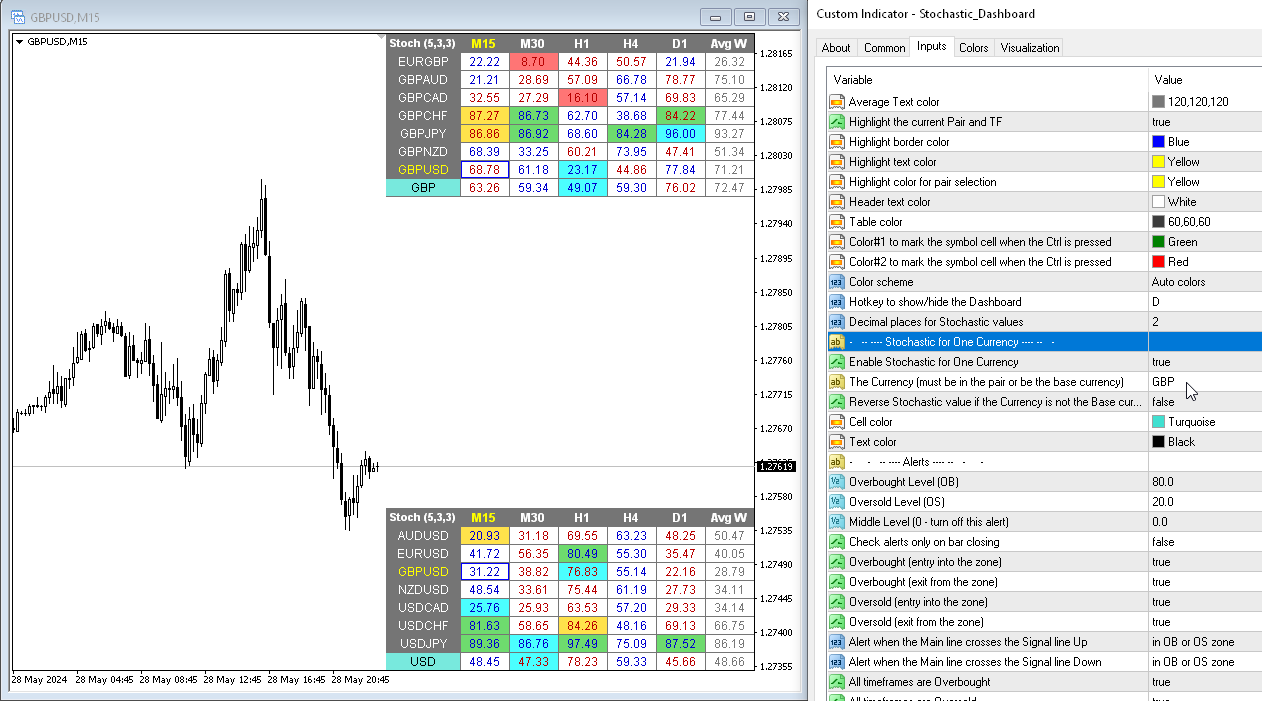
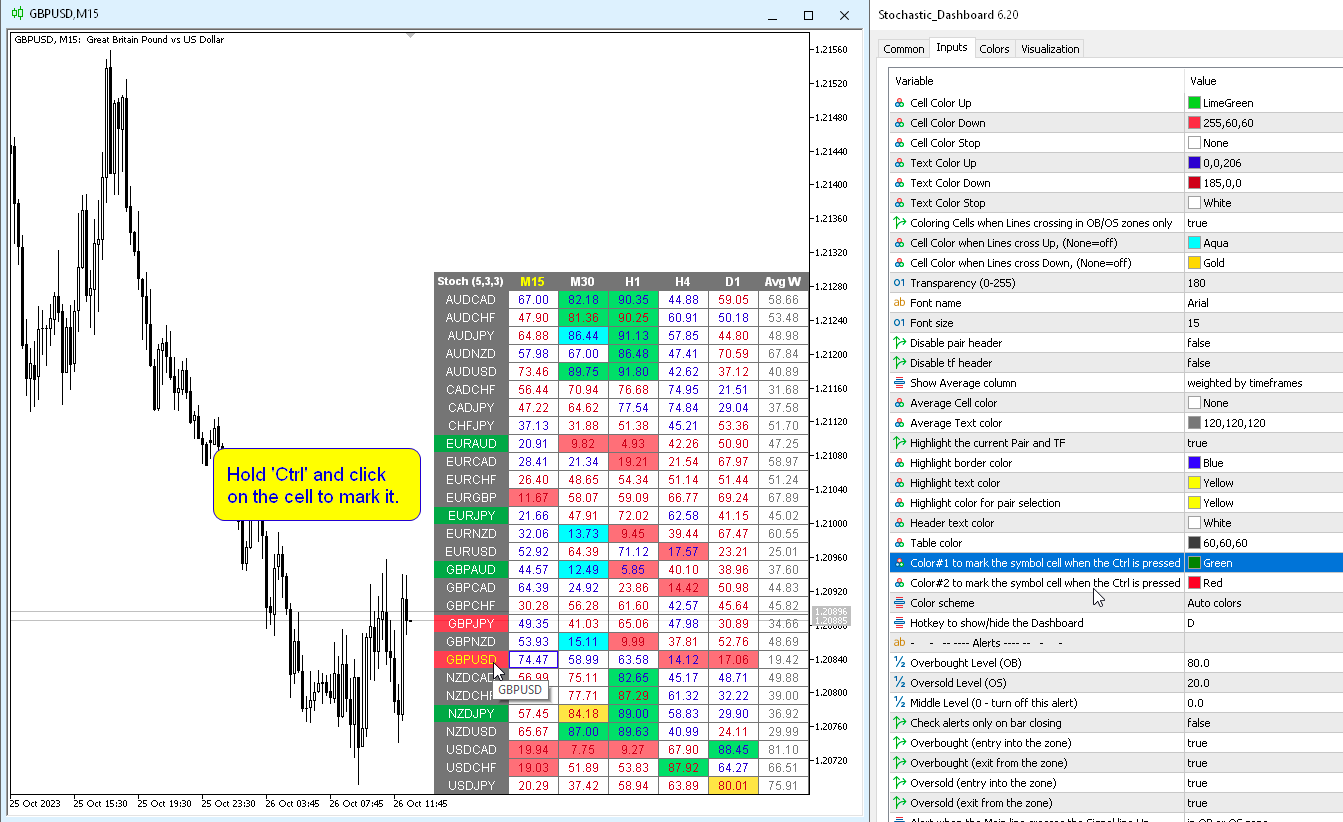
Similar to the Currency Strength Meter (CSM), the Dashboard can automatically select pairs that contain a specified currency, or those pairs that have that currency as their base currency. The indicator searches for Currency in all pairs that are specified in the “Set of Pairs”; other pairs are ignored. And based on these pairs, the total Stochastic for this currency is calculated. And you can see how strong or weak that currency is.

The key to hide the dashboard from the chart is "D" by default.


Parameters

%K Period — the period of the K line.
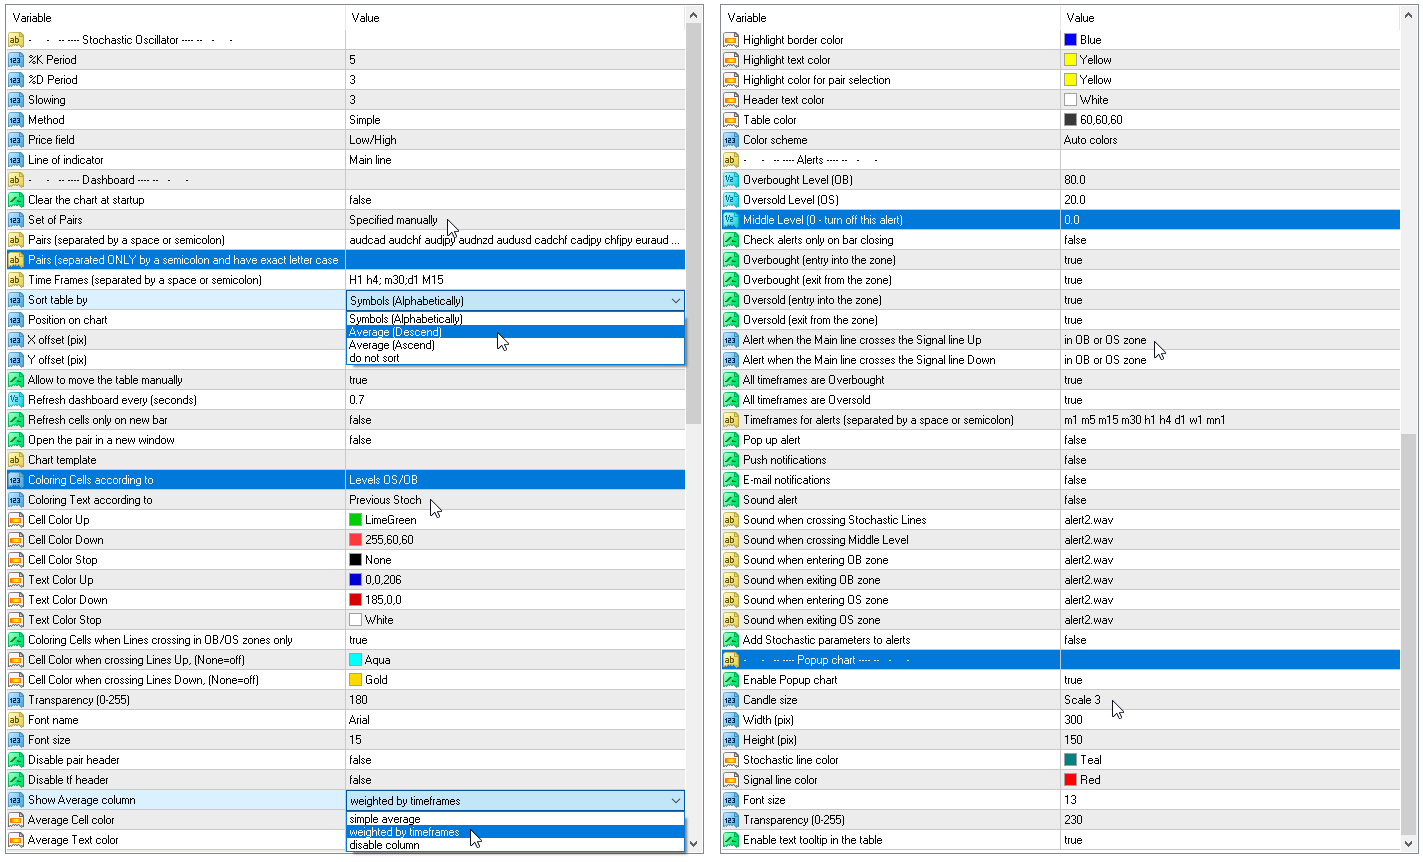
%D Period — the period of the D line.
Slowing — slowing;
Method — method of averaging;
Price field — price type.
Line of indicator — line index.
Clear the chart at startup — clear the chart at startup
Set of Pairs — set of symbols:
    — Market Watch — pairs from the "Market Watch" of the MT.
    — Specified manually — pairs specified manually, in the parameters "Pairs".
    — Current pair — show only the current pair.

    Pairs (separated by a space or semicolon) — list of symbols separated by spaces or semicolons. The currency names should be written exactly like the broker's, keeping the case and prefix/suffix.
    Time Frames (separated by a space or semicolon) — list of timeframes separated by spaces or semicolons (multi timeframe).
    Sort pairs — sorting the list of pairs.
    Position on chart — corner to display the panel on the chart.
    X offset (pix) — shift the panel along the X axis;
    Y offset (pix) — shift the panel along the Y axis;
    Refresh dashboard every (seconds) — update period for all pairs and timeframes.
    Open the pair in a new window — open a symbol in a new chart window by clicking.
    Chart template — the name of the template for the chart, if the chart opens in a new window.
    Coloring the cells according to the — color of the table cells according to the overbought / oversold levels or according to the direction of the previous candle.
    Check Lines crossing only in OB/OS zones — determine the intersection of Lines only in Overbought/Oversold zones.
    Show Pair in the table only if:

    — display all pairs
    — specified TFs in OB or OS zone

    TimeFrames for 'Show Pair'

      Color settings
      Color Up — cell color if the indicator increases or crossed overbought level.
      Color Down — cell color if the indicator decreases or crossed oversold level.
      Color Stop — cell color if the indicator does not change.
      Color when crossing Lines Up — cell color when the Main line crosses the Signal line up.
      Color when crossing Lines Down — cell color when the Main line crosses the Signal line down.
      Transparency (0-255) — transparency of the panel.
      Font name — font name.
        Alerts
        Overbought level — overbought level for alerts.
        Oversold level — oversold level for alerts.
        Middle Level (0 — turn off this alert) — third level crossing check (alert only). If zero is specified, checking for this level is disabled.
        Check alerts only on bar closing — check alerts only when the bar is closed.
        Overbought/Oversold (entry into the zone) — send alert when entering the overbought or oversold zone.
        Overbought/Oversold (exit from the zone) — send alert when leaving the overbought or oversold zone.
        Main line crosses the Signal line Up — alert when the Main line crosses the Signal line up.
        Main line crosses the Signal line Down — alert when the Main line crosses the Signal line down.
        All timeframes are Overbought/Oversold — alert when all periods enter the overbought or oversold zone.
        Timeframes for alerts (separated by a space or semicolon) — list of periods for which the alert will be sent (separated by a space or semicolon).

          Reviews 15
          tranliemkts
          44
          tranliemkts 2024.06.30 20:39 
           

          Wow, thank you so much. Feeling very happy for your 6.80 update. Thank you for creating a great indicator

          danmar
          2417
          danmar 2024.06.01 08:36 
           

          HI I already use 2 tool of Taras (dashboard RSI and ADX ) which are really very very interesting. As i have a particular use i ask Taras if he could made in dashboard Stochastic the 2 modifications to be the same as the 2 other dashboard (param for number of decimals and possibility to have intelligent group by currencies (all USD, EUR, ... ). he say that he will mind but in fact if do it in less 2 days , even i do not notice and buy it only 2 days after he release the update !. (note the nice low price ) and i am very satisfied because it complete what i need to have a very interesting view of what happend especially with long sto and short. you already undestand that i am very happy of quality of products, accuracy, and so very good customer service. Again , Sir Taras, a big big thanks for your reactivity and interest in my needs. Very Well Done.

          customanalog
          164
          customanalog 2023.09.29 00:23 
           

          This is an _excellent_ tool. Very configurable, and worth every cent. The mouseover popup charts are a nice feature. In a perfect world, the popups might also display standard or HA candles, but the existing (2023) tool works great as-is. Thanks for your hard work to make this available.

          Recommended products
          Zonecore MT4
          Frederic Jacques Collomb
          ZONECORE — Volume Profile & Pivot Levels Identify the most traded price zones with surgical precision. MT5 version What is ZONECORE? ZONECORE is a professional-grade indicator that combines Volume Profile and high-volume Pivot Levels to reveal the price zones where the market has spent the most time and traded the most volume. These zones act as magnets for price — knowing them gives you a decisive edge in identifying supports, resistances, and high-probability reversal areas. 3 Independent Cal
          Coral Heatmap
          D Armond Lee Speers
          Coral Heatmap is a currency strength meter based on the ATR values for the selected timeframe.  There are two main view modes: All Currencies (default) - see the ranked strength of all currencies in a single view Selected Currency - see the relative strength of all other currencies compared to a selected currency You can optionally display the timeframe selection toolbar; timeframe is always synchronized to the current chart timeframe.  Use keyboard shortcuts to quickly navigate currencies (up/d
          Proxy OrderFlow MT4
          Vincent Jose Proenca
          5 (1)
          Indicator based on tick-spread imbalance. TF: Works on all timeframes (M1 to D1). Pair: Compatible with Forex, indices, gold, and CFDs (auto-adjustment for JPY pairs, Gold, CFDs). Settings: TickWindow (200) – tick observation window SpreadWeight (1.5) – spread weighting factor NormalizationPeriod (20) – normalization period (z-score) Overbought / Oversold (±3.0) – alert thresholds AlertCooldown (300s) – alert cooldown period Conclusion: The Proxy Order Flow – Imbalance Tick-Spread v2.4 detect
          Crystal Volume Profile Auto POC (MT4) – Volume Profile with Automatic POC Detection Overview Crystal Volume Profile Auto POC is a lightweight and performance-optimized indicator for MetaTrader 4. It provides traders with precise volume distribution visualization, highlighting key price levels where market activity is concentrated. By automatically detecting the Point of Control (POC), the indicator helps identify hidden support/resistance zones, institutional trading footprints, and critical ar
          FREE
          Let us introduce you to a new era of neural indicators for financial markets! Intelligent Moving is a unique indicator that trains its neural network in real time! You no longer need to look for the optimal indicator parameters for each specific situation. No more late signals. The artificial intelligence is able to adapt itself and predict any market movements. Visually, the indicator is drawn as a main solid moving average line, two dotted lines of standard deviations and signal arrows. For
          Volume Profile Pro Indicator This indicator is the Volume Profile Pro tool, designed to help analyze "at which price level the most trading activity occurred." It comes with these additional special capabilities: 1. Display Modes Volume Profile (Standard): Shows the Total Volume at each price range to visualize key support and resistance zones. Delta / Money Flow: Shows the "difference" between Buy and Sell pressure ( Buy vs Sell ) to indicate who controls the market at that price. You can choos
          Pointer View
          Andrei Gerasimenko
          The indicator marks the points on the chart where the standard ZigZag indicator has drawn its top or bottom. With this indicator, you can easily understand where the top or bottom was formed, and where it was redrawn. The indicator gives an alert when a new point appears. Warning! Parameter  Applied Price   -   expands the possibilities of building the indicator.   It is possible to build at OPEN, CLOSE and standard HIGH/LOW prices. Input parameters ----------- Depth   - period of the ZigZag ind
          FREE
          IceFX VelocityMeter Mini is a very unique indicator on MetaTrader 4 platform which measures the speed of the Forex market . It is not a normal volume or other measurement indicator because IceFX VelocityMeter Mini is capable to understand market speed movements which are hidden in ticks and those valuable information cannot be read in an ordinary way from the candles. The software monitors the received ticks (frequency, magnitude of change) within a specified time range, analyzes these info and
          The Signal Strength Meter is a Multi-Currency, Dual Timeframe Interactive Indicator, which calculates the strength of buy and sell signals, and displays a score for each symbol on a display board. Get a 7-Day Free Trial Version:  Click  Here  (Full Access to The Indicator for 7 Days) Check Video Below For Complete Demonstration, and User Manual here . Key Features: Allows you to see multiple currency signals from one chart Analyses the signals from more than a dozen classic indicators Identif
          Twins
          Iurii Tokman
          Twins   Oscillator based on the Stochastic indicator. The upper readings of the indicator can be used as buy signals, the lower readings of the indicator can be used as readings for sell signals. Settings: Kperiod - period (number of bars) for calculating the% K line. Dperiod - averaging period for calculating the% D line. slowing - slowing down. method - averaging method (simple, exponential, smoothed, linearly weighted). price - price for calculation (0 - Low / High, 1 - Open / Close). Coeffic
          Hunter RD
          Ruben David Santana Rodriguez
          Este indicador trabaja de manera multitimeframe en periodos 1D y 4H , las señales son las siguientes : las entradas al mercado se dan cuando el indicador muestra color azul claro o azul para operaciones al alza , para operaciones a la baja , debe aparecer los colores naranja o rojo. Cuando el indicador tiene los colores amarillo o blanco , se debe evitar entrar al mercado ya que no hay una tendencia clara de mercado , el stop loss se coloca en el ultimo area de swing alto\bajo el take profit deb
          Excellent spread indicator. Reflects the spread on each bar as it is. It should be remembered that the spread is displayed at the time of the bar opening. Therefore, the most correct information will be on the minute bars. Spread is one of the basic forex concepts that any trader should know. If explained clearly, you can describe such an example. The trader buys the EUR / USD pair at the rate of 1.1000. However, he immediately goes into negative territory, for example, by 10 points, as if he bo
          Fractal Pro
          Mikhail Nazarenko
          Fractal Pro   is a professional version of the display of fractals with additional filtering. Visualizes fractals by price and volume. Suitable for defining entry points for scalping and swing, as well as for intra-day, mid-term trading. Fractals - candles on which the price turned in the opposite direction. Volumetric fractal is an extremum not only in price, but also maximum in volume. Features Visualizes the location of price reversals. Marks candles that are fractals both in price and volum
          Infinity ProfitZone
          Evgenii Aksenov
          4.85 (13)
          The indicator shows Profit Zones on the chart, displaying the beginning and end of the local trend Profit Zone PRO is perfect for all Meta Trader symbols: currencies, metals, cryptocurrencies, stocks and indices Advantages of the Profit Zone PRO indicator: Indicator signals without redrawing The algorithms of the indicator allow you to find the ideal moments to enter a transaction (purchase or sale of an asset), which increase the success of transactions for 100% of traders. The indicator ha
          MCTC is the most advanced multicurrency strength indicator for day trading, that does NOT use moving averages. This versatile strength meter has many settings that can be customized to suit the day traders needs. With up to 12 customization time periods, automatic calculation and graph plotting of previous period high/low values, 2 side meters showing currency strength, pair strength, points movement, points movement from previous periods, percentage, and pressure. Clickable chart for fast switc
          Introducing "TG Trade Service Manager" — your all-in-one solution for seamless trade management in both MQL4 and MQL5 environments. With a focus on speed, reliability, and convenience, this powerful library simplifies the complexities of trade execution and management, empowering developers with a single interface for enhanced efficiency. Metatrader5 Version |  All Products  |  Contact Key Features: Unified Interface : TG Trade Service Manager" provides a unified interface for   MQL4   and   MQ
          Position Size Calculator PRO MT4 V2.0 – Lot Size + Visual SL/TP Zones (Drag & Drop) for Faster, Safer Risk Management Position Size Calculator PRO MT4 V2.0 is a position sizing (money management) indicator for MetaTrader 4. It automatically calculates the optimal lot size based on your risk per trade , your Stop Loss distance, and symbol specifications (tick value, tick size, margin, leverage, etc.). Version 2.0 is a major upgrade: instead of only reading a panel, you can manage the trade direct
          This is an indicator for additional signal filtering. It can be used as an additional filter in a trading system. The indicator does not redraw its data and can be used both in forex trading and with binary options. It has 3 operation modes and flexible sensitivity settings. The indicator uses multiple buffers, therefore it can be easily used in various Expert Advisors.
          An indicator that displays the Engulfing candlestick pattern. In the settings, you can specify the type of engulfing (body, shadow and combination). It is possible to filter by trend (2 moving averages) and by reversal (RSI and Bollinger Bands). This is a very popular price action pattern. A multi-currency dashboard is available. With it, you can easily switch between charts. Trading Patterns: Retest by trend. False breakout. Order Block. Other. EURUSD, GBPUSD, XAUUSD, ... M15, M30, H1. Inpu
          Currency Strength Meter is the easiest way to identify strong and weak currencies. This indicator shows the relative strength of 8 major currencies + Gold: AUD, CAD, CHF, EUR, GBP, JPY, NZD, USD, XAU. Gold symbol can be changed to other symbols like XAG, XAU etc. By default the strength value is normalised to the range from 0 to 100 for RSI algorithm: The value above 60 means strong currency; The value below 40 means weak currency; This indicator needs the data of all 28 major currency pairs a
          SevenGates Confluence Indicator 1. Introduction (The Big Picture) SevenGates Confluence Indicator is a   non‑repainting, multi‑timeframe decision support tool   that displays the exact same 7‑gate filter system used in our automated EAs. It does not trade – it shows you, in real time, when the market aligns on Monthly, Weekly, Daily, H4, and H1 timeframes, and when a high‑probability trigger candle forms. What it does: It evaluates up to 50 symbols (or just one, depending on your chart) and dis
          The Compare Graphs indicator is an analysis tool that allows traders to compare two or more graphs on the same chart window. This indicator is commonly used in trading platforms such as MetaTrader and provides a clearer comparison of different financial instruments or time frames. Functions of the Compare Graphs indicator may include: Selecting Charts: The trader can select the charts he wants to compare, such as price charts of different currency pairs or indicators on the same chart. Setting
          M1 Easy Scalper
          Martin Alejandro Bamonte
          4 (3)
          M1 EASY SCALPER is a scalping indicator specifically designed for the 1-minute (M1) timeframe, compatible with any currency pair or instrument available on your MT4 terminal. Of course, it can also be used on any other timeframe, but it works exceptionally well on M1 (which is challenging!) for scalping. Note: if you're going to scalp, make sure you have an account suitable for it. Do not use Cent or Standard accounts as they have too much spread! (use ECN, RAW, or Zero Spread accounts) Robustn
          Currency Spread Calculator Plus
          Opengates Success International
          Currency Spread Calculator Plus This indicator is created with the aim of letting the Traders know the exact points of the spread on the currency pair they are about to buy or sell. What makes it a PLUS is that Symbol/Time frame Changer is coded with this indicator to make it easier navigating from one currency pair to another and one time frame to another on the same chart window without having to open tens of chart window in order to study more currency pairs. It saves time, energy, stress a
          Currency Strength Meter Pro for MT4
          ALEKSANDR SHUKALOVICH
          4.3 (10)
          Currency Strength Meter is the easiest way to identify strong and weak currencies. This indicator shows the relative strength of 8 major currencies + Gold: AUD, CAD, CHF, EUR, GBP, JPY, NZD, USD, XAU. Gold symbol can be changed to other symbols like XAG, XAU etc. By default the strength value is normalised to the range from 0 to 100 for RSI algorithm: The value above 60 means strong currency; The value below 40 means weak currency; This indicator needs the data of all 28 major currency pairs a
          Flat Factor
          Artem Kuzmin
          5 (1)
          The indicator is designed for visual determining market directions. It allows to determine the distance from a price and helps in drawing correct conclusions. Perfectly defines flat zones, horizontal intraday trends and trend movements, and an additional setting allows to use the indicator on any instrument. Does not redraw its readings. You get professional trading indicator for a reasonable price. Settings: Period_FF = 7 - indicator period Sensitivity_FF = 5 - sensitivity in % Wish you all su
          The Multi Pairs Forex Indicator is an advanced trading too l that allows traders to track and analyze the performance of multiple currency pairs in real-time on a single chart. It consolidates data from various Forex pairs, providing an at-a-glance overview of market conditions across different currencies and helps you save time. Useful for various trading styles, including scalping, day trading, and swing trading. Whether you're monitoring major pairs like EUR/USD, GBP/USD, or more exotic pair
          IntradaySignals
          Oleg Borisov
          5 (1)
          Intraday Signals is a visual and effective semi-automatic trading system, that: generates possible entry points to open BUY and SELL trades; displays recommended  Take Profit and Stop Loss; displays current profit on open trade; displays  current spread. The profitability of the indicator is shown in the screenshot on the example of the GBPUSD pair Does not redraw and works on opening bar.  Time frames - M1-H1. Recommended TimeFrame-M5-M15. Signals are produced based on the used of HMA, Laguerre
          Greed Radar Monitor
          AL MOOSAWI ABDULLAH JAFFER BAQER
          Greed Radar Monitor – Your Key to Controlled, Thoughtful Trading The Greed Radar Monitor is an essential tool for mindful traders, designed to help you assess your emotional state, particularly your level of greed, before you enter a trade. Priced at just $50, this utility offers a precise evaluation to ensure you're making trades with clarity, balance, and control. The Logic Behind the Greed Radar Monitor: This tool uses a simple, insightful questionnaire to evaluate your emotional well-being,
          Tick Sound
          Jean Francois Le Bas
          5 (2)
          Tick Sound will play a different sound each time a tick is triggered. When the tick is higher than the previous one, an "UP" sound is triggered When the tick is lower than the previous one, a "DN" sound is triggered The main sound i chose is a Sheppard Tone : it's an audio effect that simulates and endless ramping sound up or down which is perfect for this task. but you can also select 14 different pre-made up/dn sounds or use your own sounds There are three main parameters for Tick Sound Ask :
          Buyers of this product also purchase
          Gann Made Easy
          Oleg Rodin
          4.83 (162)
          Gann Made Easy is a professional and easy to use Forex trading system which is based on the best principles of trading using the theory of W.D. Gann. The indicator provides accurate BUY and SELL signals including Stop Loss and Take Profit levels. You can trade even on the go using PUSH notifications. PLEASE CONTACT ME AFTER PURCHASE TO GET TRADING  INSTRUCTIONS AND GREAT EXTRA INDICATORS   FOR FREE! Probably you already heard about the Gann trading methods before. Usually the Gann theory is a ve
          Scalper Inside PRO
          Alexey Minkov
          4.74 (69)
          Scalper Inside PRO – Since 2020. An exclusive indicator that utilizes an innovative algorithm to swiftly and accurately determine the market trend. The indicator automatically calculates opening, closing, and profit levels, providing detailed trading statistics. With these features, you can choose the most appropriate trading instrument for the current market conditions. Additionally, you can easily integrate your own arrow indicators into Scalper Inside Pro to quickly evaluate their statistics
          M1 Sniper
          Oleg Rodin
          5 (22)
          M1 SNIPER is an easy to use trading indicator system. It is an arrow indicator which is designed for M1 time frame. The indicator can be used as a standalone system for scalping on M1 time frame and it can be used as a part of your existing trading system. Though this trading system was designed specifically for trading on M1, it still can be used with other time frames too. Originally I designed this method for trading XAUUSD and BTCUSD. But I find this method helpful in trading other markets a
          KuKl
          IGOR KIRIANEN
          The indicator is built on a non-standard Zig Zag, it draws accumulations after which if the price leaves this zone and a test of this zone occurs, then a sound signal is given and an arrow appears - after the test candle closes.The indicator does not redraw its signals, it is very easy to use, there are only three settings 1- this is the zig zag parameter 2- this is the minimum price exit from the zone 3- this is the maximum price exit from the zone. The lower the parameter for Zig Zag, the more
          PRO Renko System
          Oleg Rodin
          5 (30)
          PRO Renko System is a highly accurate trading system specially designed for trading RENKO charts. The ARROWS and Trend Indicators DO NOT REPAINT! The system effectively neutralizes so called market noise giving you access to accurate reversal signals. The indicator is very easy to use and has only one parameter responsible for signal generation. You can easily adapt the tool to any trading instrument of your choice and the size of the renko bar. I am always ready to provide extra support to help
          Auto Optimized Parabolic RSI: Advanced 3D Momentum Engine Most retail indicators fail because they rely on static inputs that break the moment market volatility shifts. Auto Optimized Parabolic RSI solves the problem of "indicator decay" by continuously recalculating its own mathematical edge, bringing institutional-grade quantitative adaptation directly to your MT5 terminal. The Core Advantage: Custom In-Memory 3D Optimization   Standard auto-optimizers often freeze the MT5 platform because the
          Market Makers
          Mohamed Hassan
          5 (4)
          After purchase, contact me privately to receive 1 month of free testing with EA Forex Proton! This advanced MT4 trading robot automatically executes signals from any MT4 indicator, including Market Makers. The latest version also includes AI integration, allowing each trade signal to be analyzed using Artificial Intelligence. Live Signal with EA Forex Proton: Click here Market Makers is a powerful price action trading system designed to identify high-probability Buy and Sell opportunities based
          Quantum Breakout Indicator PRO
          Bogdan Ion Puscasu
          4.96 (26)
          Introducing   Quantum Breakout PRO , the groundbreaking MQL5 Indicator that's transforming the way you trade Breakout Zones! Developed by a team of experienced traders with trading experience of over 13 years, Quantum Breakout PRO is designed to propel your trading journey to new heights with its innovative and dynamic breakout zone strategy. Quantum Breakout Indicator will give you signal arrows on breakout zones with 5 profit target zones and stop loss suggestion based on the breakout box. I
          Atomic Analyst
          Issam Kassas
          5 (5)
          First of all Its worth emphasizing here that this Trading Indicator is   Non-Repainting , Non Redrawing and Non Lagging Indicator   Indicator, Which makes it ideal from both manual and robot trading.  User manual: settings, inputs and strategy . The Atomic Analyst  is a PA Price Action Indicator that uses Strength and Momentum of the price to find a better edge in the market. Equipped with Advanced filters which help remove noises and false signals, and Increase Trading Potential. Using Multiple
          Advanced Supply Demand
          Bernhard Schweigert
          4.91 (300)
          Trading Special – 40% OFF Best Solution for any Newbie or Expert Trader! This indicator is a unique, high quality and affordable trading tool because we have incorporated a number of proprietary features and a new formula. With this update, you will be able to show double timeframe zones. You will not only be able to show a higher TF but to show both, the chart TF, PLUS the higher TF: SHOWING NESTED ZONES. All Supply Demand traders will love it. :) Important Information Revealed Maximize the pot
          GoldRush Trend Arrow Signal V1.6 The GoldRush Trend Arrow Signal indicator V1.6 continues to provide precise, real-time trend analysis tailored for high-speed, short-term scalpers in XAU/USD , but it now has additional features and improved efficiency and reliability. Built specifically for the 1-minute time frame, this tool displays directional arrows for clear entry points, allowing scalpers to navigate volatile market conditions with confidence. The indicator consists of PRIMARY and SECONDARY
          Apex Edge No Repaint Professional Non-Repainting Trading Indicator for MT4 Apex Edge No Repaint is a premium, clean, and reliable trading tool designed for serious forex and cryptocurrency traders who want clear signals without the frustration of repainting arrows. Key Features: 100% No Repaint – Signals remain fixed once they appear on the chart Dual signal system: RAW signals for early opportunities and CONF signals for high-probability confirmed entries Simple one-click toggle buttons: RAW ON
          RFI levels PRO
          Roman Podpora
          5 (1)
          The indicator accurately shows the reversal points and price return zones where the   Major players . You see where new trends are forming and make decisions with maximum precision, maintaining control over every trade. VERSION MT5     -     Reveals its maximum potential when combined with the   TREND LINES PRO   indicator What the indicator shows: Reversal structures and reversal levels with activation at the beginning of a new trend. Display of   TAKE PROFIT   and   STOP LOSS   levels with mi
          This indicator has been designed to integrate with the Elliott Wave theory, providing two distinct methods of operation: Automatic Work: In this mode, the indicator operates autonomously by detecting all five motive waves on the chart according to Elliott Wave theory. It offers predictions and identifies potential reversal zones. Additionally, it has the capability to generate alerts and push messages to notify traders of significant developments. This automated functionality streamlines the pro
          Please send me Direct message on MQL5 CHAT after purchasing the Indicator for Training and Installation Support There are some additional files that is important to use with the Indicator . So be sure to contact me after purchasing the Indicator So that I can add you for training and support . If you find any difficulty with installation then send me Direct message here So that I can connect with you via Anydesk or Teamview for the product installation. " Smart Order Block Indicator " to find m
          New Update of Smart Trend Trading System MT5 For  2026 Market: If You Buy this Indicator you will Get my Professional   Trade Manager + EA  for   FREE . First of all Its worth emphasizing here that this Trading System is   Non-Repainting   , Non Redrawing and Non Lagging Indicator   Which makes it ideal from both manual and robot trading .  [Online course] ,   [manual]   and   [download presets] . The Smart Trend Trading System MT5 is a comprehensive trading solution tailored for   new   and   e
          Trading Special – 40% OFF Best Solution for any Newbie or Expert Trader! This indicator is a unique, high quality and affordable trading tool because we have incorporated a number of proprietary features and a secret formula. With only ONE chart it gives Alerts for all 28 currency pairs. Imagine how your trading will improve because you are able to pinpoint the exact trigger point of a new trend or scalping opportunity! Built on new underlying algorithms it makes it even easier to identify and c
          The " Dynamic Scalper System " indicator is designed for the scalping method of trading within trend waves. Tested on major currency pairs and gold, compatibility with other trading instruments is possible. Provides signals for short-term opening of positions along the trend with additional price movement support. The principle of the indicator. Large arrows determine the trend direction. An algorithm for generating signals for scalping in the form of small arrows operates within trend waves.
          PZ Trend Trading
          PZ TRADING SLU
          4.8 (5)
          Capture every opportunity: your go-to indicator for profitable trend trading Trend Trading is an indicator designed to profit as much as possible from trends taking place in the market, by timing pullbacks and breakouts. It finds trading opportunities by analyzing what the price is doing during established trends. [ Installation Guide | Update Guide | Troubleshooting | FAQ | All Products ] Trade financial markets with confidence and efficiency Profit from established trends without getting whips
          GOLD Impulse with Alert
          Bernhard Schweigert
          4.67 (12)
          This indicator is a super combination of our 2 products  Advanced Currency IMPULSE with ALERT  and  Currency Strength Exotics . It works for all time frames and shows graphically impulse of strength or weakness for the 8 main currencies plus one Symbol! This Indicator is specialized to show currency strength acceleration for any symbols like Gold, Exotic Pairs, Commodities, Indexes or Futures. Is first of its kind, any symbol can be added to the 9th line to show  true currency strength accelerat
          PZ Support Resistance
          PZ TRADING SLU
          3.33 (3)
          Unlock key market insights with automated support and resistance lines Tired of plotting support and resistance lines? This is a multi-timeframe indicator that detects and plots supports and resistance lines in the chart with the same precision as a human eye would. As price levels are tested over time and its importance increases, the lines become thicker and darker, making price leves easy to glance and evaluate. [ Installation Guide | Update Guide | Troubleshooting | FAQ | All Products ] Boos
          Trend Screener
          STE S.S.COMPANY
          4.79 (95)
          Trend Screener Indicator --Professional Trend Trading & Market Scanning System for MetaTrader Unlock the true power of trend trading with Trend Screener Indicator — a complete multi-currency, multi-timeframe trend analysis solution   powered by Fuzzy Logic,Trend Pulse Technology  and advanced market structure algorithms.   Trend Screener transforms your MetaTrader platform into a professional-grade Trend Analyzer and Market Scanner, helping you identify high-probability trend opportunities, ear
          Super Signal – Skyblade Edition Professional No-Repaint / No-Lag Trend Signal System with Exceptional Win Rate | For MT4 / MT5 It works best on lower timeframes, such as 1-minute, 5-minute, and 15-minute charts. Core Features: Super Signal – Skyblade Edition is a smart signal system designed specifically for trend trading. It applies a multi-layered confirmation mechanism to detect only strong, directional moves supported by real momentum. This system does not attempt to predict tops or bottoms
          Trading Special –40% OFF Best Solution for any Newbie or Expert Trader! This Indicator is a unique, high quality and affordable trading tool because we have incorporated a number of proprietary features and a new formula. With only ONE chart you can read Currency Strength for 28 Forex pairs! Imagine how your trading will improve because you are able to pinpoint the exact trigger point of a new trend or scalping opportunity? User manual: click here That's the first one, the original! Don't buy a
          They say history repeats itself. What if you could prove it in real-time? The Propfolio Ghost Pattern is an advanced algorithmic pattern-matching engine. It empowers you to select any current price action structure on your chart and instantly scan thousands of historical candles to find the exact moment in the past where the market did the exact same thing. Once it finds the highest probability match, it projects the historical outcome into the future as "Ghost Candles"—giving you a highly calcu
          NextCandlePredictor Indicator NextCandlePredictor, a signal indicator with alert that does not repaint, does not change its color, does not move, does not disappear, and has no lag. It will help you identify the direction of the next or upcoming candles in any timeframe. Highly recommended for high volatility markets like New York, London, or even the overlap of both. Main Features: Versatility in Timeframes: Provides quick and accurate signals in any timeframe, from M1 to H1 and beyond. Clear B
          Contact me after purchase to get Bonus EA based on this indicator. The Self Optimizing Double MA Strategy is a professional-grade trading tool designed to eliminate parameter guesswork. Powered by a built-in auto-optimization engine, it continuously adapts to shifting market conditions by simulating thousands of parameter combinations in the background to maintain a statistical edge. Instead of relying on static, outdated settings, the indicator dynamically updates its own logic to find the mos
          Bull versus Bear
          Mohamed Hassan
          4.5 (18)
          Send us a message after your purchase to receive more information on how to get your  BONUS  for FREE  that works in great combination with Bull vs Bear ! Bull versus Bear is an easy-to-use Forex indicator that gives traders clear and accurate signals based on clear trend retests . Forget about lagging indicators or staring at charts for hours because  Bull vs Bear provides real-time entries with no lag and no repaint, so you can trade with confidence. Bull vs Bear  helps you enter trades during
          Technical indicator that structures charts and identifies cyclical price movements. Can work on any charts. Several types of alerts. There are additional arrows on the chart itself. Without redrawing on history, works on closing a candle. Recommended TF from M5 and higher. Easy to use and configure parameters. When using 2 indicators with different parameters, you can use without other indicators. Has 2 input parameters Cyclicality and Signal duration These 2 parameters work with the processin
          Trend Scanner PRO First of all, it’s worth emphasizing that this trading system is 100% Non-Repainting, Non-Redrawing, and Non-Lagging , which makes it ideal for both   manual   and   algorithmic   trading setups. Online course, user manual, and downloadable presets included. The Trend Scanner Dashboard is a professional   multi pair scanner   that analyzes multiple symbols and timeframes at once, giving you an instant   market scanner   view of the real trend direction. Instead of switching ch
          More from author
          Heikin Ashi Dashboard MT5
          Taras Slobodyanik
          5 (4)
          Multi-currency and multitimeframe Heikin Ashi indicator. Shows the current state of the market. On the scanner panel you can see the direction, strength and number of bars of the current trend. The Consolidation/Reversal candles are also shown using color. You can specify any desired currencies and periods in the parameters. Also, the indicator can send notifications when the trend changes or when reversal and consolidation candles (dojis) appear. By clicking on a cell, this symbol and period wi
          Time Scale for MT5
          Taras Slobodyanik
          4.77 (30)
          The indicator draws the time scale on the chart. You can specify the time offset, adjust the size and font to display on the chart ( it is displaying your local time on your chart instead of MT time ). You can also select the desired format for displaying the date and time. You may be interested in my other product , which contains a more advanced version of the Time Scale . You can also find my other products here . Parameters Hours (time shift) — time shift (hours); Minutes (time shift) — tim
          FREE
          ZigZag Dashboard for MT5
          Taras Slobodyanik
          5 (4)
          Multicurrency and multitimeframe modification of the ZigZag indicator. Displays the current direction of the market, the height of the last movement, the number of bars in this movement and the breaking of the previous point of the ZigZag (horizontal line). This is MTF Scanner, you can actually see the supply and demand levels. You can specify any desired currencies and timeframes in the parameters. Also, the panel can send notifications when the ZigZag changes direction or when there was a br
          MACD Dashboard
          Taras Slobodyanik
          5 (2)
          Multi-currency and multi-timeframe indicator MACD. The dashboard can display both the Traditional (true) MACD and the MACD which is built into MetaTrader. On the panel you can see the current state of the indicator — the direction of movement of the MACD lines, their intersection and a pop-up window with the indicator chart. In the parameters you can specify any desired pairs-symbols and timeframes. The scanner can also send notifications about lines crossing each other and about lines crossing
          CCI Dashboard for MT5
          Taras Slobodyanik
          5 (1)
          Multicurrency and multitimeframe modification of the Commodity Channel Index (CCI) indicator. You can specify any desired currencies and timeframes in the parameters. Also, the panel can send notifications when crossing overbought and oversold levels. By clicking on a cell with a period, this symbol and period will be opened. This is MTF Scanner. The key to hide the dashboard from the chart is "D" by default. Parameters CCI Period  — averaging period. CCI Applied price  — price type. Clear th
          Symbol Manager for MT5
          Taras Slobodyanik
          5 (3)
          Symbol Manager or Grid Manager, designed to group orders into one position (by Symbol or by Magic Number). This utility will be useful to multi-currency traders (many EAs), who can have multiple orders on several pairs. You will be able to see the total number of lots, the total profit, and set virtual stop loss and virtual take profit. To set a real TP (or SL), you must first set the virtual value, and then enter the command in this cell: "set". If you want to set real TP/SL for all orders at
          Symbol Manager
          Taras Slobodyanik
          5 (4)
          Symbol Manager or Grid Manager, designed to group orders into one position (by Symbol or by Magic Number). This utility will be useful to multi-currency traders (many EAs), who can have multiple orders on several pairs. You will be able to see the total number of lots, the total profit, and set virtual stop loss and virtual take profit. To set a real TP (or SL), you must first set the virtual value, and then enter the command in this cell: "set". If you want to set real TP/SL for all orders at
          ZigZag Lines MTF for MT5
          Taras Slobodyanik
          5 (11)
          Multi timeframe ZigZag indicator. It displays the support/resistance horizontal lines and their breakouts, as well as draws the current targets of the market. It can also display lines of the Fractals indicator and candles from other periods (up to Quarterly). So, you can actually see the supply and demand levels. Indicator – connects key lows and highs to show trend lines. You can also use it as indicator for the Break of Structure(BOS) & Market Structure Shift(MSS). The indicator redraws the
          Lines Profit Loss MT5
          Taras Slobodyanik
          4.62 (13)
          The indicator displays profit (loss) on the current symbol. You can freely drag and drop the line to display the current profit or loss. You can find my products   here . Parameters Calculation in money or in points — calculate the profit/loss in points or money. Add pending orders to calculate — take pending orders into account in calculations. Magic Number (0 - all orders on symbol) — magic number, if it is necessary to evaluate specific orders. Offset for first drawing (points from the aver
          FREE
          Multicurrency and multi-timeframe indicator Inside Bar (IB). In the parameters, you can specify any desired currencies and timeframes. The panel displays the last found Inside Bar (and Mother Bar) pattern, the current price position and the breakout of the levels of the Mother and Inside Bars. You can set the size and color for bars and text in the cells. The indicator can also send notifications when levels are broken. The dashboard highlights Double Inside Bar in a special color. By clicking
          ZigZag Lines MTF
          Taras Slobodyanik
          4.38 (13)
          Multi timeframe ZigZag indicator. It displays the support/resistance horizontal lines and their breakouts, as well as draws the current targets of the market. It can also display lines of the Fractals indicator and candles from other periods (up to Quarterly). So, you can actually see the supply and demand levels. Indicator – connects key lows and highs to show trend lines. You can also use it as indicator for the Break of Structure(BOS) & Market Structure Shift(MSS). The indicator redraws the
          Multicurrency and multitimeframe modification of the Relative Strength Index (RSI) indicator — RSI Dashboard. You can specify any desired currencies and timeframes in the parameters. Also, the panel can send notifications when crossing overbought and oversold levels. By clicking on a cell with a period, this symbol and period will be opened. This is MTF Scanner. The key to hide the dashboard from the chart is "D" by default. Similar to the Currency Strength Meter (CSM) , the Dashboard can automa
          ADX Dashboard MT5
          Taras Slobodyanik
          5 (4)
          ADX indicator is used to determine the trend and its strength. The direction of the price is shown by the +DI and -DI values, and the ADX value shows the strength of the trend. If +DI is above -DI, then the market is in an uptrend, if on the contrary, it is a downtrend. If ADX is below 20, then there is no definite direction. As soon as the indicator breaks this level, a medium-strength trend begins. Values above 40 indicate a strong trend (a downtrend or an uptrend). Multicurrency and multiti
          Multicurrency and multi timeframe modification of the Relative Strength Index (RSI) indicator   — RSI Dashboard . You can specify any desired currencies and timeframes in the parameters. Also, the panel can send notifications when crossing overbought and oversold levels. By clicking on a cell with a period, this symbol and period will be opened. This is MTF Scanner. The key to hide the dashboard from the chart is "D" by default. Similar to the Currency Strength Meter (CSM) , the Dashboard can au
          Multicurrency and multitimeframe modification of the Stochastic Oscillator — Stochastic Dashboard. You can specify any desired currencies and timeframes in the parameters. The panel displays the current values and intersections of the lines — Signal and Main (stochastics crossover). Also, the indicator can send notifications when crossing overbought and oversold levels. By clicking on a cell with a period, this symbol and period will be opened. This is MTF Scanner. Similar to the Currency Stren
          The indicator automatically draws the Fibonacci levels based on  ZigZag indicator,  Trading Sessions,  Fractals or Candles (including non-standard timeframes: Year, 6 Months, 4 Months, 3 Months, 2 Months) ( Auto Fibo Retracement ). You can choose any higher time frame for Fibonachi calculation. The levels are redrawn every time the current bar closes. It is possible to enable alerts when crossing the specified levels. You can also analyze levels in history. To do this, it is necessary to specify
          Pro Sessions MT4
          Taras Slobodyanik
          4.75 (4)
          This is an indicator of trading sessions  that can display all levels (Open-High-Low-Close) for four sessions. The indicator can also predict session levels. Sessions can be drawn with lines or rectangles (empty or filled), lines can be extended to the next session. You can easily hide/show each session by pressing hotkeys (by default '1', '2', '3', '4'). You can see ASR (Average Session Range) lines  (default hotkey 'A'). This is similar to the ADR calculation, only it is calculated based on t
          Easy Grider
          Taras Slobodyanik
          4.5 (2)
          The EA creates an order grid using labels. Opening and closing of the grid is done either automatically by the system signals or manually. In the same grid can be both Limit and Stop orders. It is possible to reverse the grid on specified condition. You can enter the breakdown/rebound from established levels. All types of Sell limit, Buy limit, Buy stop, Sell stop orders are supported. The grid is rebuilt with a single click. The stop loss and take profit lines can be easily modified. You are fr
          Lines Profit Loss
          Taras Slobodyanik
          4.65 (17)
          The indicator displays profit (loss) on the current symbol. You can freely drag and drop the line to display the current profit or loss. You can find my products here . Parameters Calculation in money or in points — calculate the profit/loss in points or money. Add pending orders to calculate — take pending orders into account in calculations. Magic Number (0 - all orders on symbol) — magic number, if it is necessary to evaluate specific orders. Offset for first drawing (points from the average
          FREE
          Time Scale
          Taras Slobodyanik
          4.87 (15)
          The indicator draws the time scale on the chart. You can specify the time offset, adjust the size and font to display on the chart (it is displaying your local time on your chart instead of MT time). You can also select the desired format for displaying the date and time. While holding down the middle mouse button, and moving the cursor, a slider will appear on the scale. You may be interested in my other product , which contains a more advanced version of the Time Scale. You can also find my o
          FREE
          Magnifier Ruler Crosshair
          Taras Slobodyanik
          5 (2)
          The indicator has three main tools: Magnifier (Zoom chart), Ruler  ( Time and Price scales ),   and Crosshair. You can move it all around with your mouse and customize different formats for  displaying , customize   size and color of each element. The Magnifier (zoom chart) allows you to display candles from any time frame and at different scales. Hotkeys: 'Q' - higher timeframe, 'A' - lower timeframe, 'W' - decrease candle size, 'S' - increase candle size, 'Z' - show/hide zoom chart You can
          The indicator has three main tools: Magnifier (Zoom chart), Ruler  ( Time and Price scales ),   and Crosshair. You can move it all around with your mouse and customize different formats for  displaying , customize   size and color of each element. The Magnifier (zoom chart) allows you to display candles from any time frame and at different scales. Hotkeys: 'Q' - higher timeframe, 'A' - lower timeframe, 'W' - decrease candle size, 'S' - increase candle size, 'Z' - show/hide zoom chart. You can
          Levels of Timeframes
          Taras Slobodyanik
          5 (2)
          The indicator shows the High/Low /Open/Close   Levels from other (and non-standard) timeframes - Year, 6 Months, 4 Months, 3 Months, 2 Months, Month, Week, Day, H3-H6-H8-H12 Hours, M90, M45. You can also set the shift for opening candles and build virtual candles. "Period separators" for one of these timeframes is available in the form of vertical lines. Alerts can be configured for breakouts of the current or previous levels (breakout of the HIgh/Low yesterday/last week line etc). You can also
          MA Dashboard MT5
          Taras Slobodyanik
          5 (4)
          Multicurrency and multitimeframe modification of the indicator Moving Average (MA). On the dashboard you can see the current state of the indicator - breakouts and touches (by price) of the Fast MA and Slow MA, as well as the intersection of the MA lines between each other   (moving average crossover) . In the parameters you can specify any desired currencies and timeframes. Also, the indicator can send notifications about the price touching the lines and about their crossing. By clicking on a c
          The indicator shows the High/Low /Open/Close   Levels from other (and non-standard) timeframes - Year, 6 Months, 4 Months, 3 Months, 2 Months, Month, Week, Day, H3-H6-H8-H12 Hours, M90, M45. You can also set the shift for opening candles and build virtual candles. "Period separators" for one of these timeframes is available in the form of vertical lines. Alerts can be configured for breakouts of the current or previous levels (breakout of the HIgh/Low yesterday/last week line etc). You can also
          Pro Sessions MT5
          Taras Slobodyanik
          5 (1)
          This is an indicator of trading sessions  that can display all levels (Open-High-Low-Close) for four sessions . The indicator can also predict session levels. Sessions can be drawn with lines or rectangles (empty or filled), lines can be extended to the next session. You can easily hide/show each session by pressing hotkeys (by default '1', '2', '3', '4'). You can see ASR (Average Session Range) lines  (default hotkey 'A'). This is similar to the ADR calculation, only it is calculated based on
          The indicator calculates the inclination angle between the Highs, Lows and Closes of adjacent bars. The angle can be measured in degrees or radians. A linear graph or a histogram is drawn in a subwindow. You can set the scale for the calculation — floating or fixed. For use in Expert Advisors or indicators, you need to specify a fixed scale. Parameters Angular measure — degrees or radians. Scale mode for calculation — scaling mode. Free scale — free transformation, the indicator will calculate
          FREE
          MTF RSI for MT5
          Taras Slobodyanik
          Multi-timeframe indicator Relative Strength Index displays information simultaneously from different periods in one subwindow of the chart. Parameters Period of averaging — averaging period for the RSI calculation. Type of price — price used. Timeframes for RSI — list of periods, separated by a space or comma or semicolon. Number of bars for each period — the number of bars displayed for each period. Sort periods — sort periods if they are listed in no particular order. Current period first — d
          Stochastic Oscillator displays information simultaneously from different periods in one subwindow of the chart. Parameters %K Period — K-period (number of bars for calculations). %D Period — D-period (period of first smoothing). Slowing — final smoothing. Method — type of smoothing. Price field — stochastic calculation method . Timeframes for Stochastic — list of periods, separated by a space or comma or semicolon. Number of bars for each period — the number of bars displayed for each period. S
          This is the famous FX Sniper's T3 CCI indicator. It is a fixed version additionally containing search for classical and reverse (hidden) divergence. The classical divergence is displayed as a solid line, the reverse divergence is shown as a dotted line. Divergences are drawn in the indicator and on the chart (if you select the appropriate options). Parameters CCI Period — Commodity Channel Index indicator period CCI Type of price — price used for indicator calculation T3 Period — Sniper period
          Filter:
          tranliemkts
          44
          tranliemkts 2024.06.30 20:39 
           

          Wow, thank you so much. Feeling very happy for your 6.80 update. Thank you for creating a great indicator

          danmar
          2417
          danmar 2024.06.01 08:36 
           

          HI I already use 2 tool of Taras (dashboard RSI and ADX ) which are really very very interesting. As i have a particular use i ask Taras if he could made in dashboard Stochastic the 2 modifications to be the same as the 2 other dashboard (param for number of decimals and possibility to have intelligent group by currencies (all USD, EUR, ... ). he say that he will mind but in fact if do it in less 2 days , even i do not notice and buy it only 2 days after he release the update !. (note the nice low price ) and i am very satisfied because it complete what i need to have a very interesting view of what happend especially with long sto and short. you already undestand that i am very happy of quality of products, accuracy, and so very good customer service. Again , Sir Taras, a big big thanks for your reactivity and interest in my needs. Very Well Done.

          customanalog
          164
          customanalog 2023.09.29 00:23 
           

          This is an _excellent_ tool. Very configurable, and worth every cent. The mouseover popup charts are a nice feature. In a perfect world, the popups might also display standard or HA candles, but the existing (2023) tool works great as-is. Thanks for your hard work to make this available.

          Sara Sabaghi
          24590
          Sara Sabaghi 2023.02.11 11:10 
           

          Great job. you did it well. to support and respect for nice and inspiring tools in this market

          18104
          342
          18104 2022.08.26 16:54 
           

          Very good indicator !!!

          aworex
          1915
          aworex 2021.12.14 16:54 
           

          A very good product and a must have for serious traders. By the way is the new Average column displaying the average Stochastic value of TF's ?

          Taras Slobodyanik
          95569
          Reply from developer Taras Slobodyanik 2023.06.01 16:53
          The indicator can calculate two different averages. The first "simple average" is a simple sum divided by the number of timeframes. The second "weighted by timeframes" is the sum of values multiplied by the number of minutes of each timeframe, divided by the total amount of minutes.
          intan08
          1388
          intan08 2021.10.29 18:50 
           

          Essential tool for my trading, great job by the author.

          Nicolas Dobrovsky
          839
          Nicolas Dobrovsky 2021.08.26 10:02 
           

          The best stochastic dashboard I've found. Lots of settings. Everyone will find what they need. The creator answers and solves problems very quickly.

          GoodMorningg
          535
          GoodMorningg 2021.04.16 08:51 
           

          Идеальный индикатор! Прям нет к чему придраться. Спасибо Тарас за ваш труд!

          1218384201
          149
          1218384201 2020.11.10 19:19 
           

          The dashboard do the right work for my trading!Very good

          sunnychow
          9043
          sunnychow 2020.05.01 10:33 
           

          User didn't leave any comment to the rating

          thapas
          942
          thapas 2019.11.07 15:34 
           

          User didn't leave any comment to the rating

          DTChrisLP
          1144
          DTChrisLP 2019.10.28 11:17 
           

          Great Dashboard.... Thx!

          aw1977
          282
          aw1977 2019.09.06 00:04 
           

          This dashboard works well as confirmation for my method....thank you

          vghanem
          244
          vghanem 2019.01.28 06:16 
           

          Great product. Great value for money. It helps me in momentum swing trading when stochastics exits OS/OB areas. Good job Taras! And thank you for this brilliant work!

          Reply to review