ZigZag Lines MTF
- Indicators
- Version: 6.5
- Updated: 19 July 2026
- Activations: 10

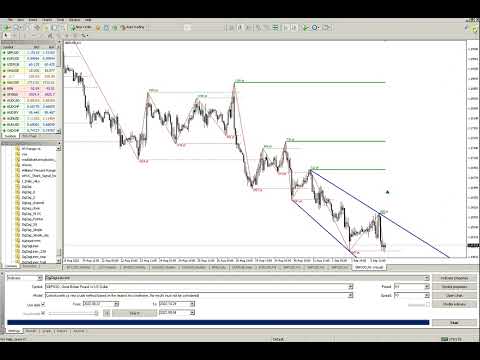
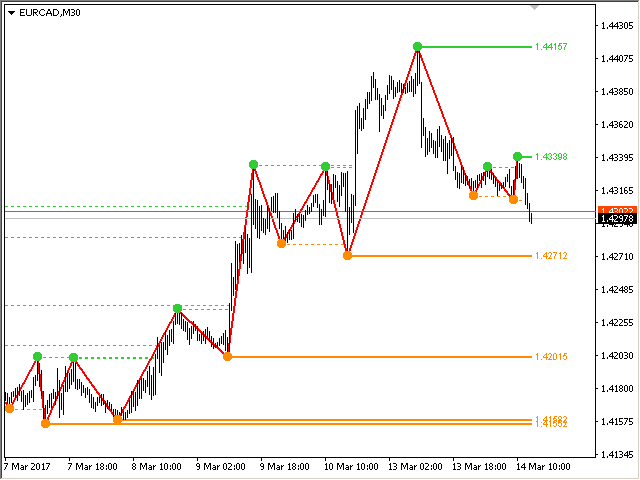
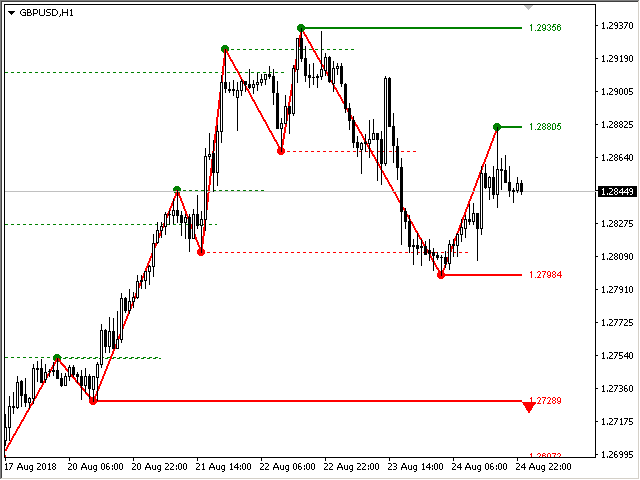
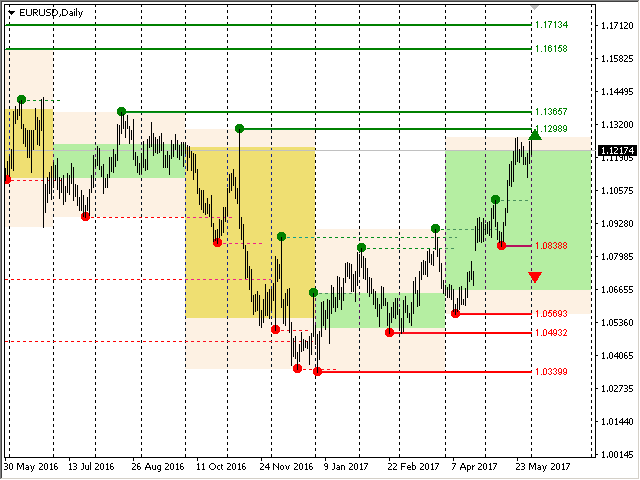
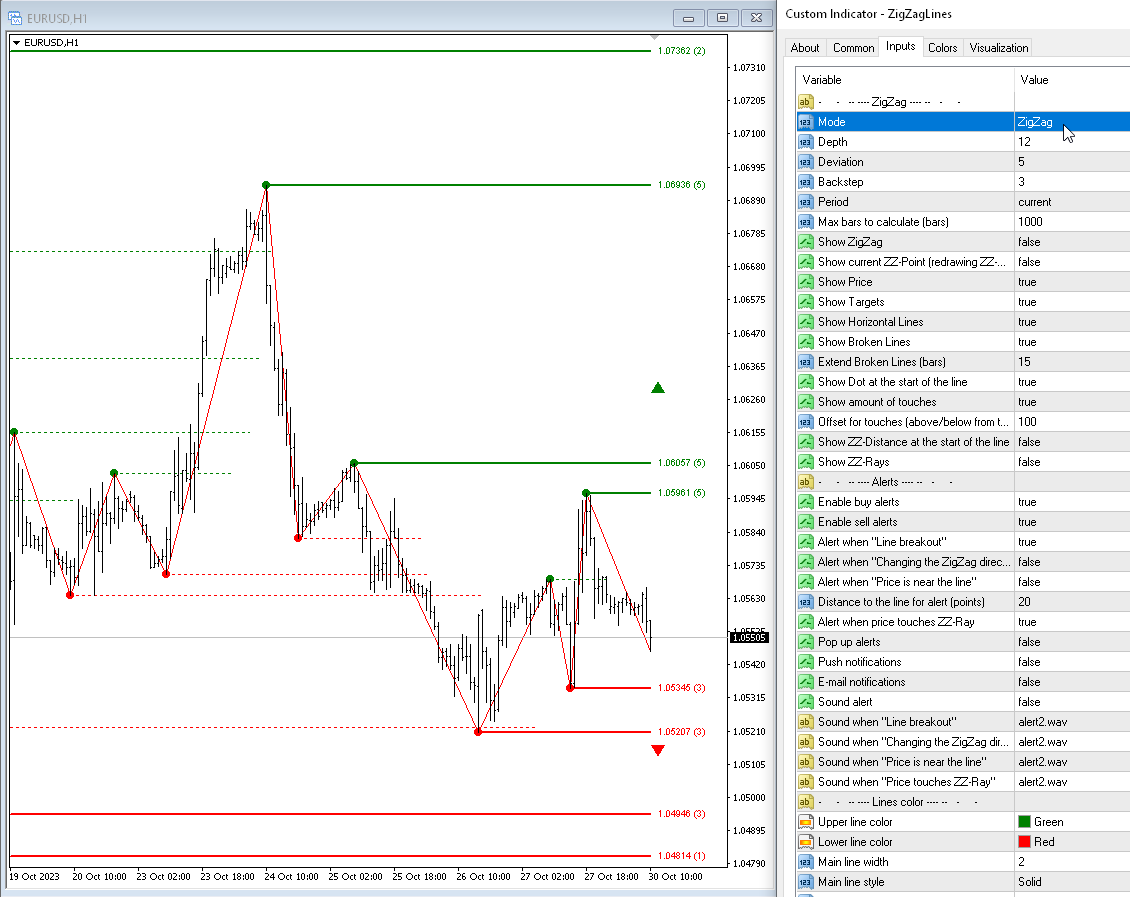
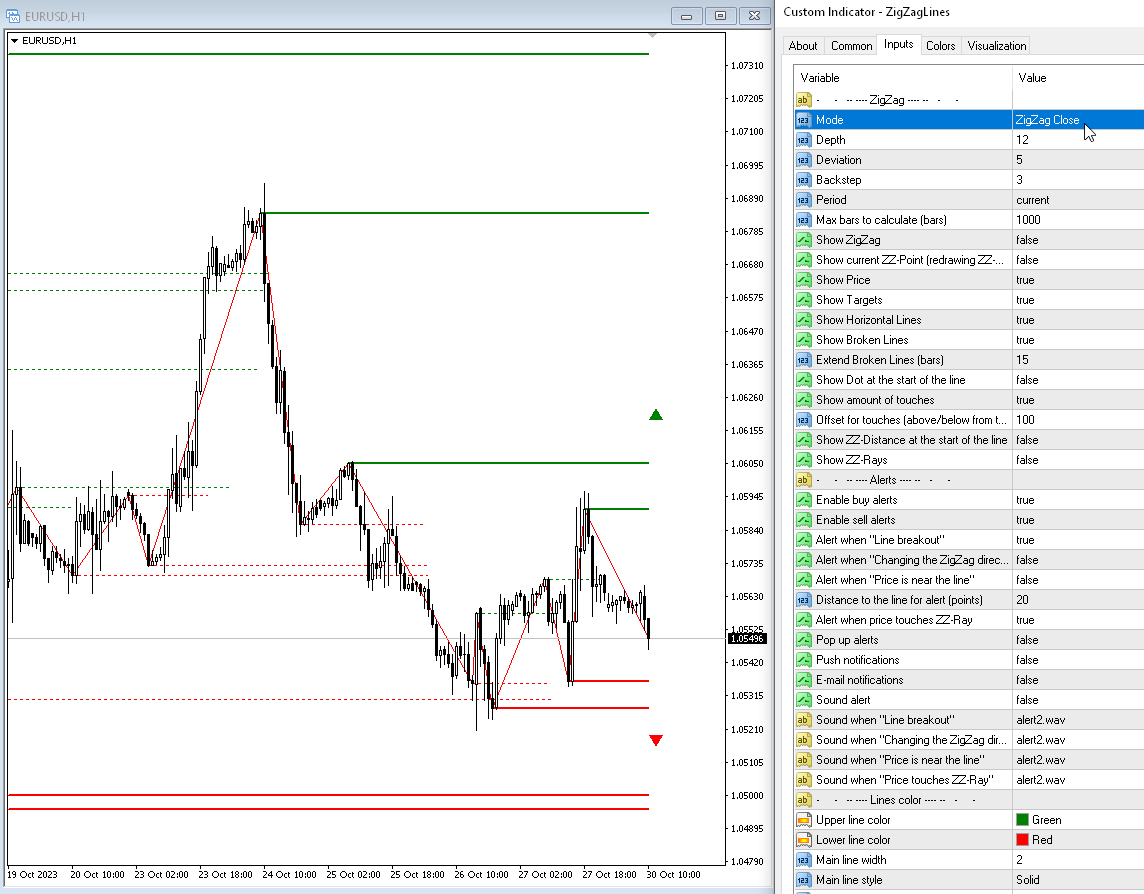
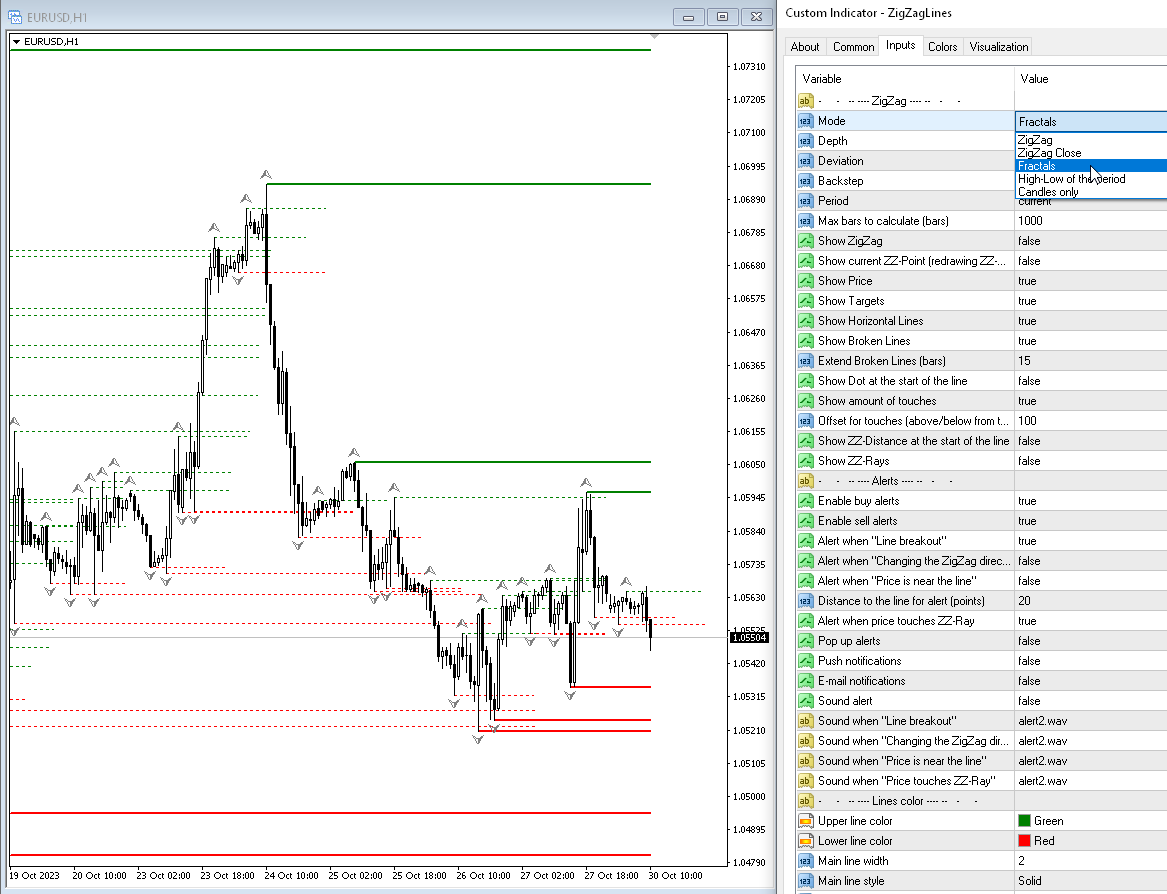
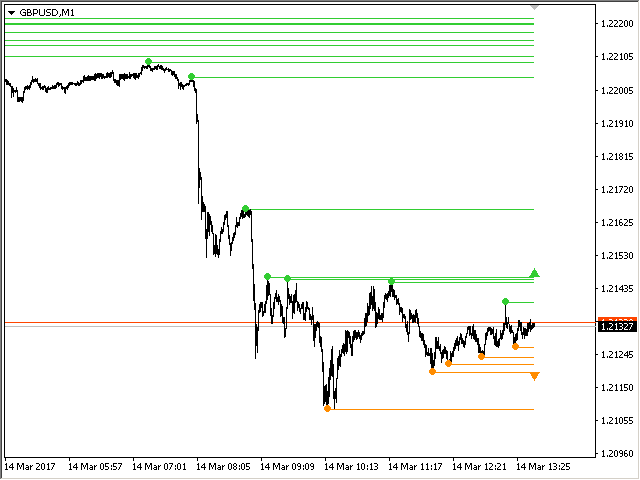
Multi timeframe ZigZag indicator. It displays the support/resistance horizontal lines and their breakouts, as well as draws the current targets of the market. It can also display lines of the Fractals indicator and candles from other periods (up to Quarterly). So, you can actually see the supply and demand levels. Indicator – connects key lows and highs to show trend lines.
You can also use it as indicator for the Break of Structure(BOS) & Market Structure Shift(MSS).
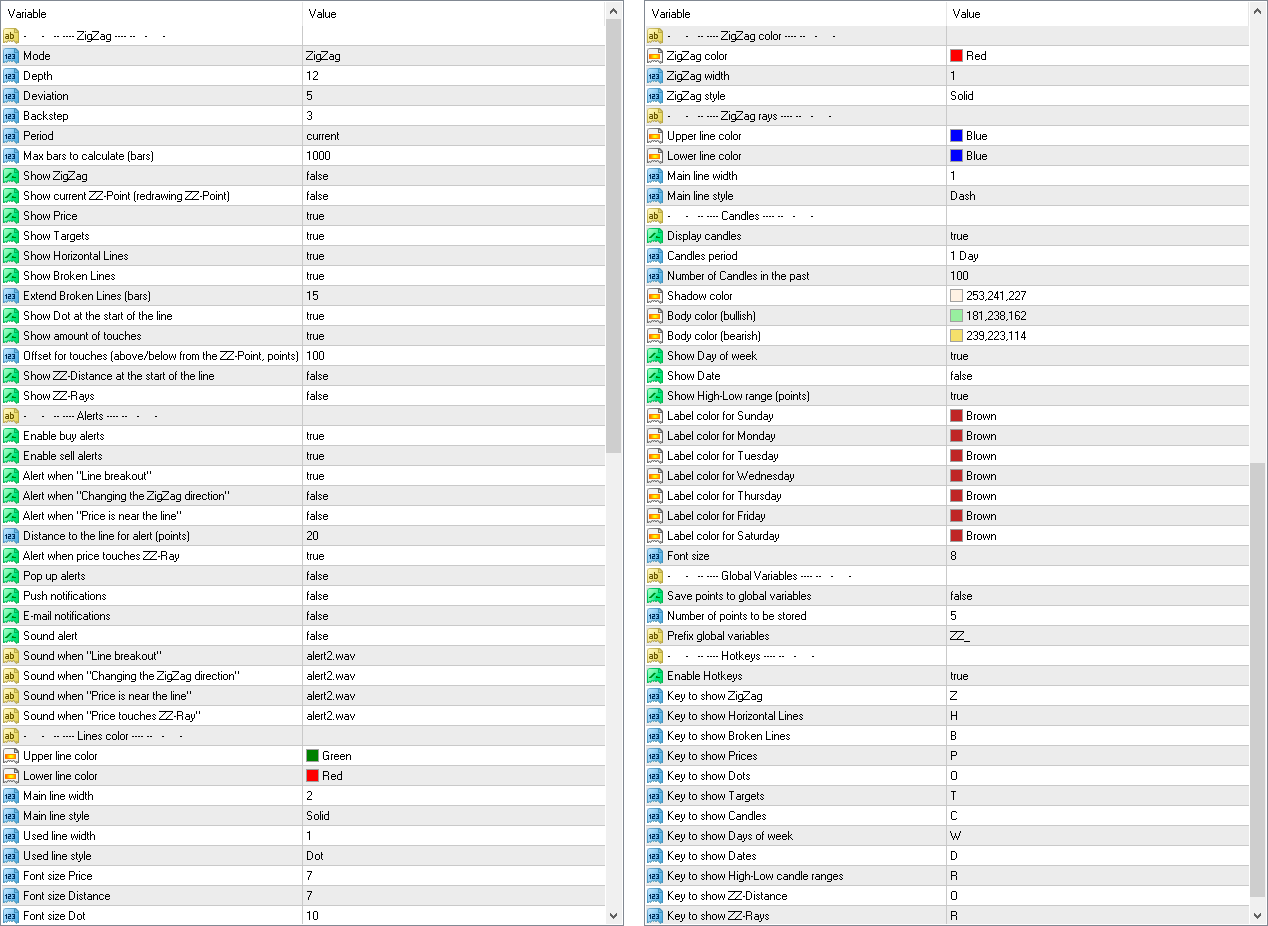
Settings
— Zig Zag — the ZigZag indicator;— ZigZag Close — the ZigZag Close indicator;— Fractals — the Fractals indicator;— High-Low of the period — building an indicator by high-low levels. The timeframe is specified in the Period parameter;— Candles only — draw only Candles;
Deviation — the minimum number of points between the Highs/Lows of two adjacent candlesticks for the Zigzag to form a local top/bottom;
Backstep — the minimum number of candlesticks between the local Highs/Lows;
Period — period for calculation of ZigZag or Fractals;
Max bars to calculate (bars) — the maximum number of bars for calculation. This limitation is introduced to speed up the calculations;
Show Zigzag — show the ZigZag;
Show current ZZ-point (redrawing point) — show current (last) point;
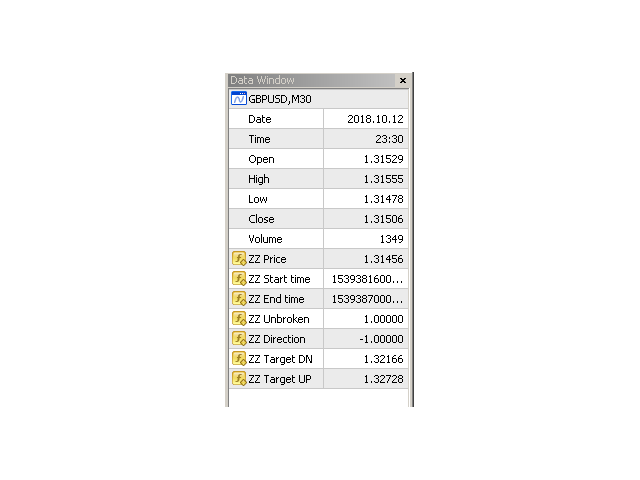
Show Price — show the price of the levels;
Show Targets — show the current targets (where the market is headed);
Show broken lines) — show the broken levels;
Check the breakout of the Lines by price:
- High-Low (current bar)
- High-Low (previous bar)
- Close (previous bar)
- Open (current bar)
Extend broken lines (bars) — extend the broken lines to the right by the specified number of bars;
Show Dot at the start of the line — display dots at the turning points of the indicator;
Show amount of touches — show the number of touches near the line price;
Offset for touches (above/below from the ZZ-point, points) — the range in which the ZZ-point will be considered as touching the level.
Push notifications — Push-notification;
E-mail notifications — notification by e-mail;
Sound alert — sound alert when touching a level;
Alert when "Line breakout" — alert when the ZigZag level is broken;
Alert when "Changing the ZigZag direction" — alert when changing direction of ZigZag;
Alert when "Price is near the line" — alert if the price is near the level (once a bar, the current point of the ZigZag is not checked);
Distance to the line for alert (points) — distance for alert (in points);
Lower line color — color of the lower lines;
Main line width — width of the main line;
Main line style — style of the main line;
Used line width — width of the used line;
Used line style — style of the used line;
Font size price — font size for the Prices;
Font size dot — font size for the Dots;
ZigZag color — color of the ZigZagа;
ZigZag width — width of the ZigZag lines;
ZigZag style — style of the ZigZag lines;
Candles period — period for the candles, all standard ones plus Quarterly;
Number of Candles in the past — the number of candles on the chart;
Shadow color — candle of the candle wicks;
Body color (bullish) — body candle of a bullish candle;
Body color (bearish) — body color of a bearish candle;
Save points to global variables — store points in the Global Variables of the terminal;
Number of points to be stored — number of points to be stored (current point is zero);
Prefix global variables — prefix for Global Variable names.


This is a brilliant indicator with a huge versatility in specific options. It can draw zigzag from a higher time frame and candles from a higher timeframe, whilst showing levels from the zigzag (or fractals etc.) Colours and so on can be individually specified to give what you need and keep a clean chart. It has too many uses to go into details but an invaluable tool if you use zigzag, candles or liquidity levels. Taras is helpful and skilled, he was able to update to show candles only closed of htf, which I suggested, in a few hours. Look at his other items too!