Levels of Timeframes
- Indicators
- Version: 4.90
- Updated: 19 July 2026
- Activations: 10

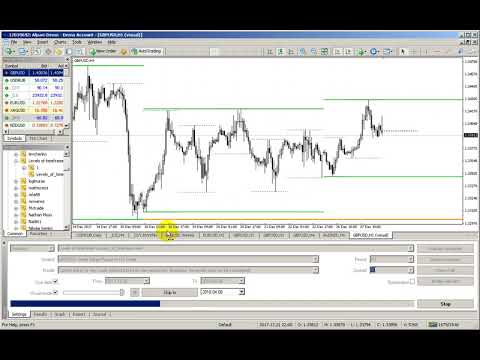
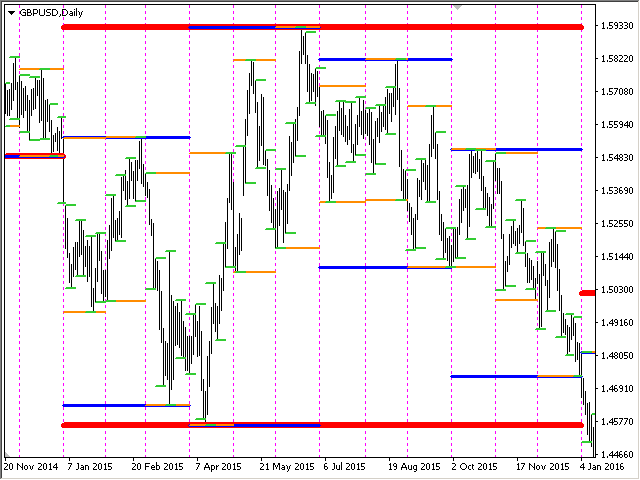
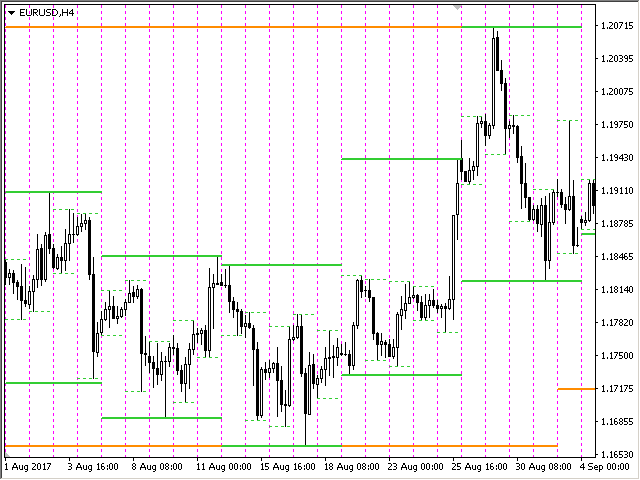
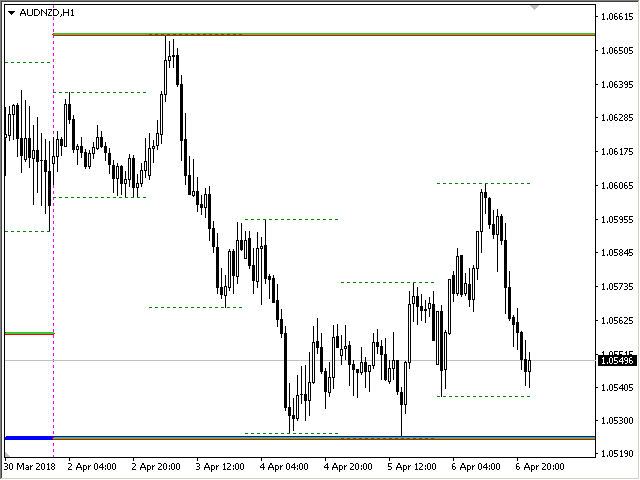
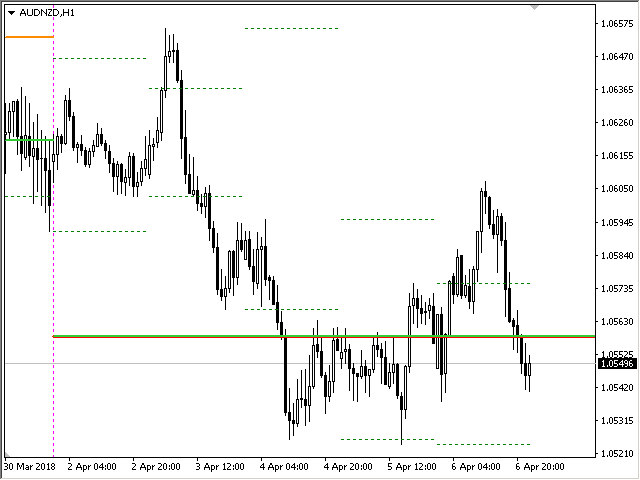
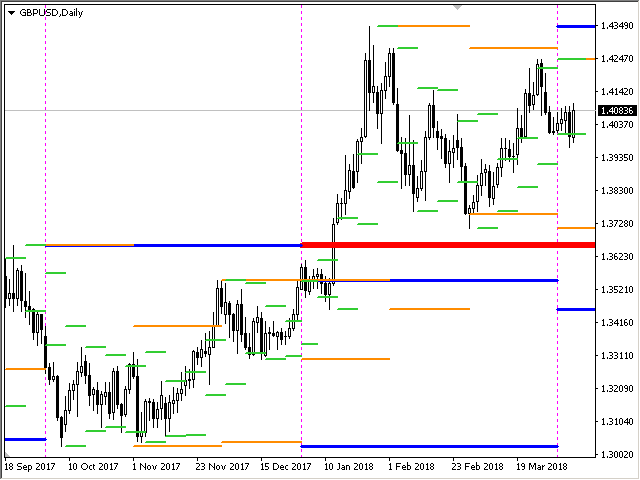
The indicator shows the High/Low/Open/Close Levels from other (and non-standard) timeframes - Year, 6 Months, 4 Months, 3 Months, 2 Months, Month, Week, Day, H3-H6-H8-H12 Hours, M90, M45. You can also set the shift for opening candles and build virtual candles.
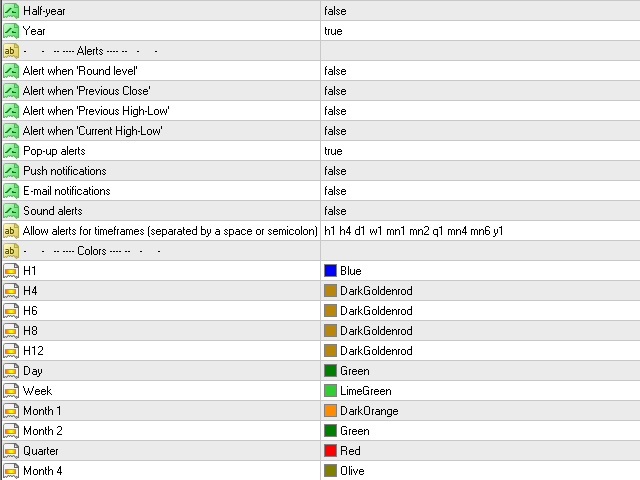
"Period separators" for one of these timeframes is available in the form of vertical lines. Alerts can be configured for breakouts of the current or previous levels (breakout of the HIgh/Low yesterday/last week line etc).
You can also shift all levels to the right by one period. That is, the High/Low of the previous period will be shown on the current period
Parameters
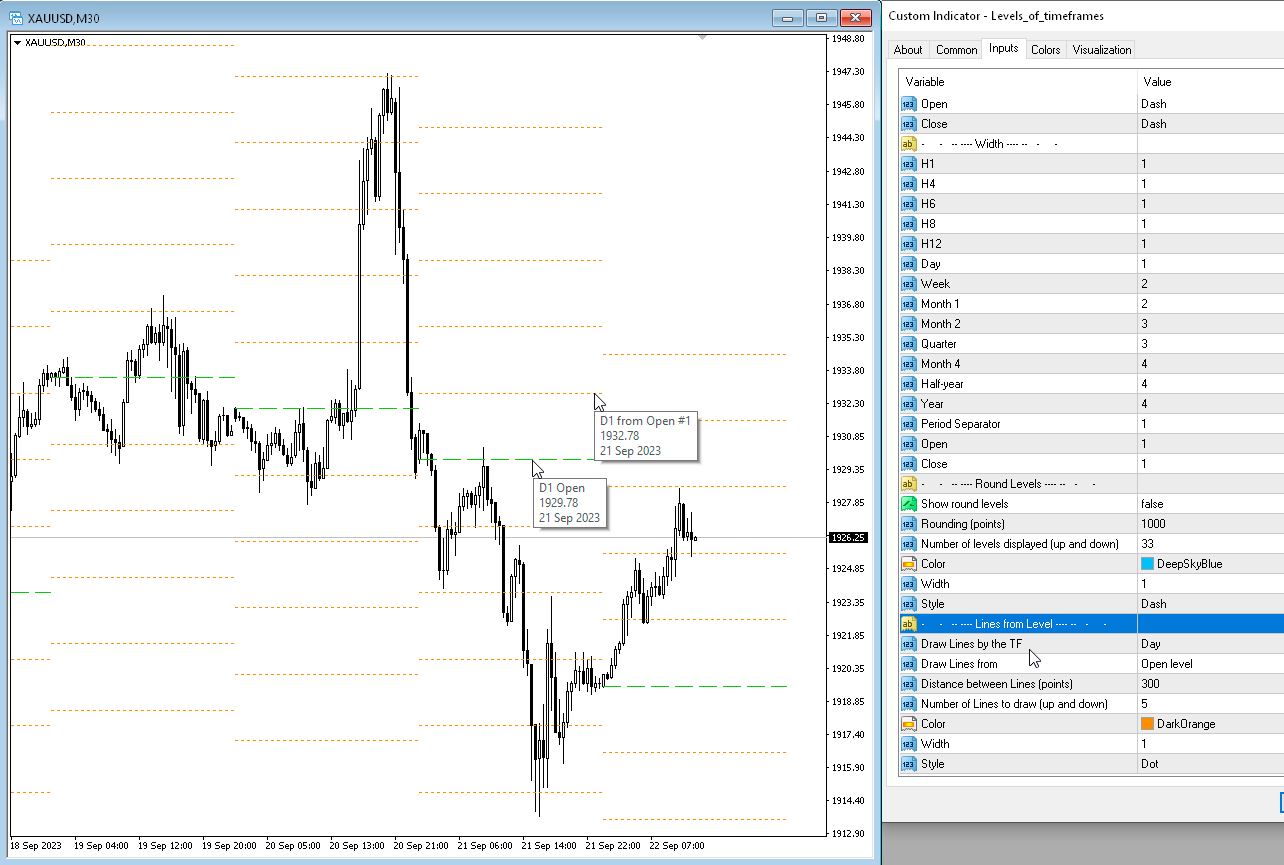
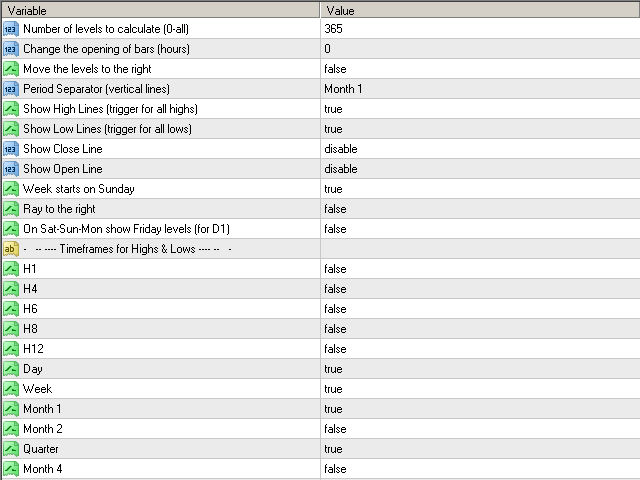
Change the opening of bars (hours) — shift the opening of candles by n-hours. The indicator will draw virtual bars taking into account the new opening time. Periods above MN1 do not change.
Move the levels to the right — moves all levels one bar to the right. You will see previous levels on the current candle.
Period Separator (vertical lines) — displays a vertical line, period separator.
Show High Lines (trigger for all highs) — disables or enables drawing of high levels.
Show Low Lines (trigger for all lows) — disables or enables drawing of low levels.
Show Open Line — timeframe for which the open price line will be drawn. You can select "All TF for Highs & Lows" and the levels will be drawn according to the periods specified for the High-Low.
Draw Open Line immediately when a new bar appears.
Show Close Line — timeframe for which the close price line will be drawn. You can select "All TF for Highs & Lows" and the levels will be drawn according to the periods specified for the High-Low.
Week starts on Sunday — in the terminal, by default, W1 candles start on Sunday. If set to 'false', the week will start on Monday.
Show levels
from M45/M90 to Year — show high-low from selected periods. Year, 6 Months, 4 Months, 3 Months, 2 Months, Month, Week, Day, 4 HoursAlerts
Alert when 'Round level' — send an alert when the price touches a round level.Alert when 'Current Highs-Lows' — send an alert when the price touches the current levels.
Alert when 'Previous High-Low' — send an alert when the price touches the previous levels.
Pop-up alerts.
Push notifications.
E-mail notifications.
Sound alerts.
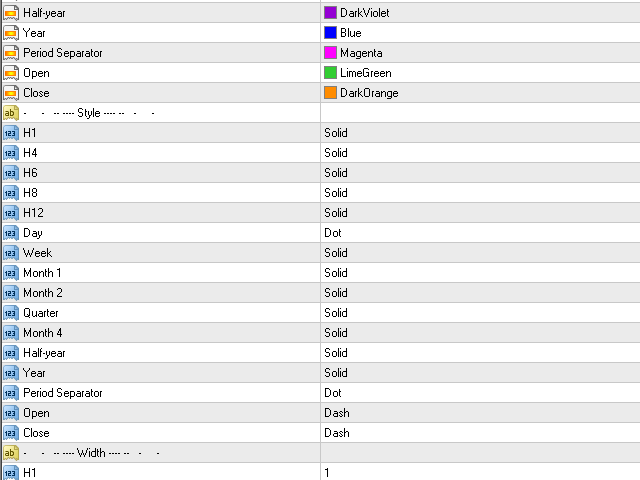
Colors
from M45 to Year — color adjustment for period lines.Period Separator — color of the period separator lines.
Line style
from M45 to Year — period line style.Period Separator — style of the period separator lines.
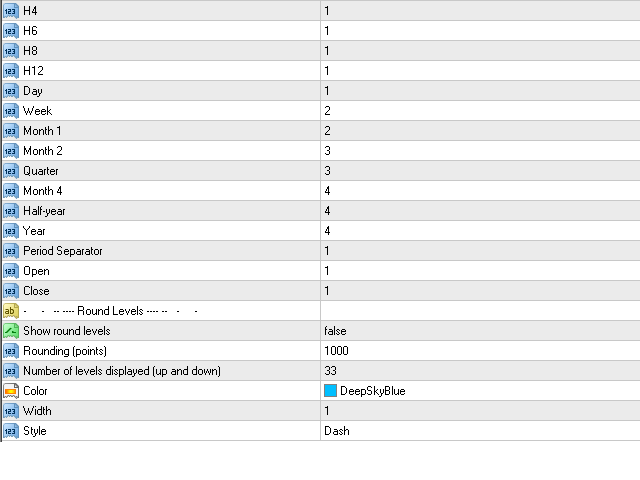
Line width
from M45 to Year — period line width.Period Separator — width of the period separator lines.
Round Levels
Show round levels.
Rounding (points).
Number of levels displayed (up and down) — the number of levels to display, up and down from the current level.
Color.
Width.
Style.
The indicator shows OHLC (HLOC) of the specified timeframes (custom bars or custom candles).


great indicator, worth every penny.