• Overview
  • Reviews
  • Comments (4)
  • What's new

Dashboard Stochastic Multicurrency for MT5

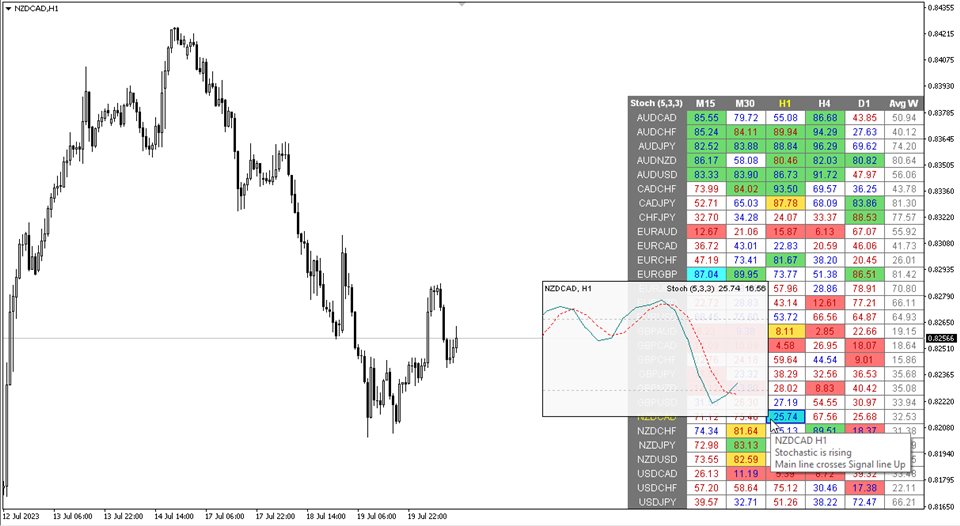
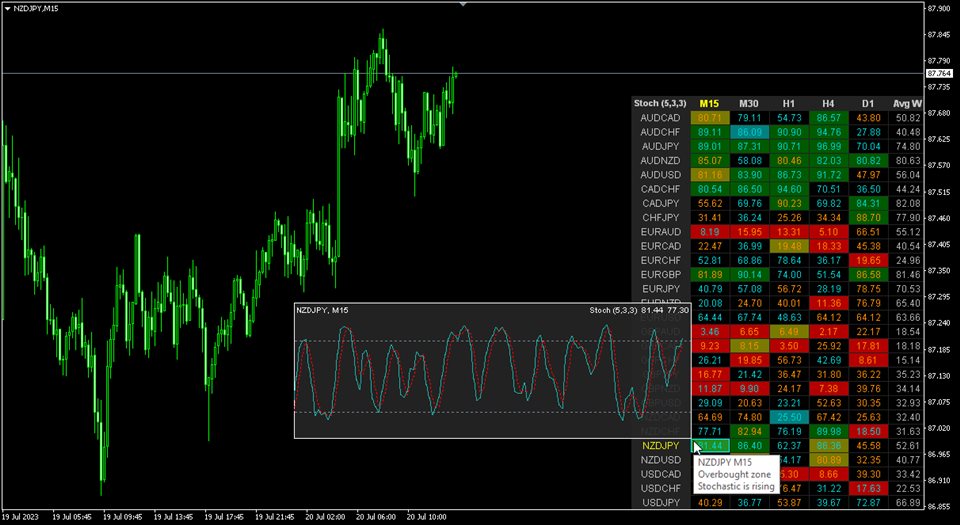
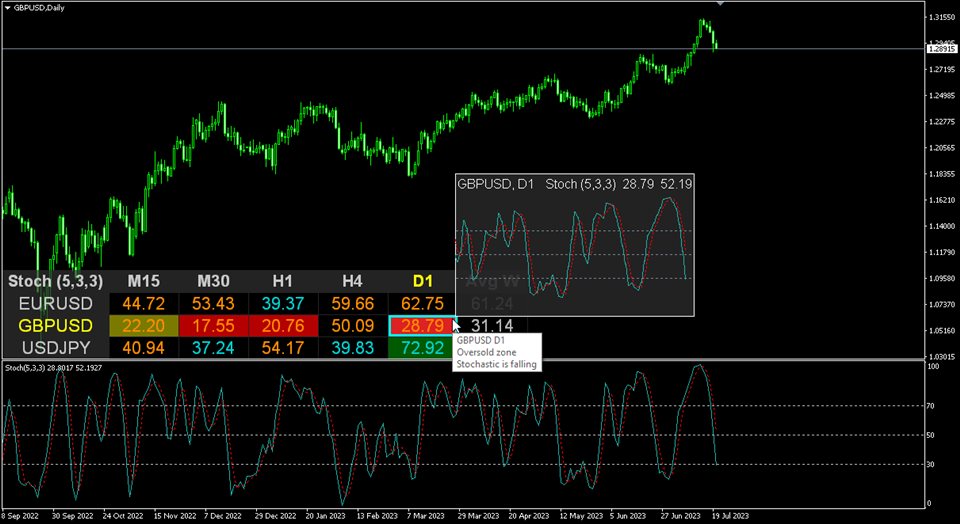
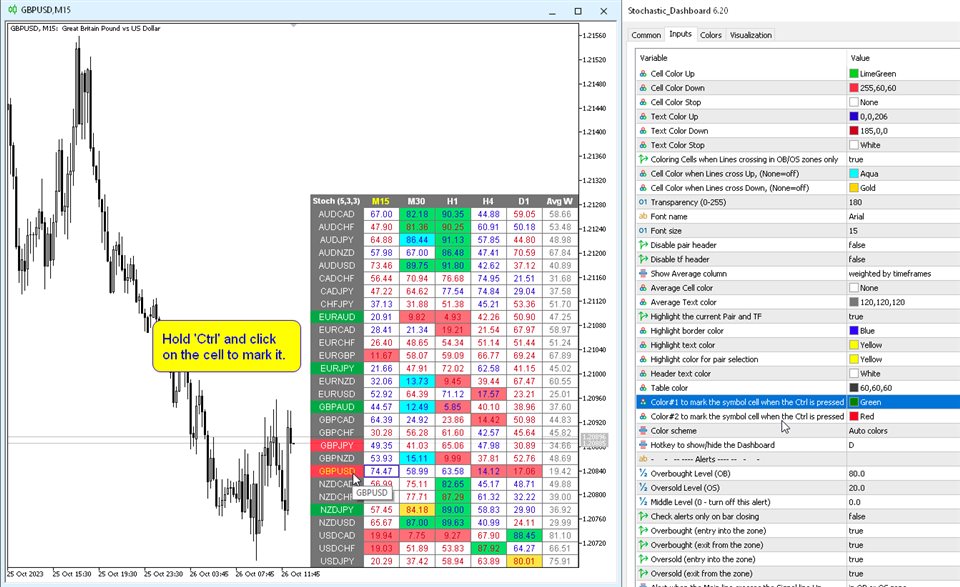
Multicurrency and multitimeframe modification of the Stochastic Oscillator. You can specify any desired currencies and timeframes in the parameters. The indicator displays the current values and intersections of the lines — Signal and Main. Also, the indicator can send notifications when crossing overbought and oversold levels. By clicking on a cell with a period, this symbol and period will be opened.

Parameters

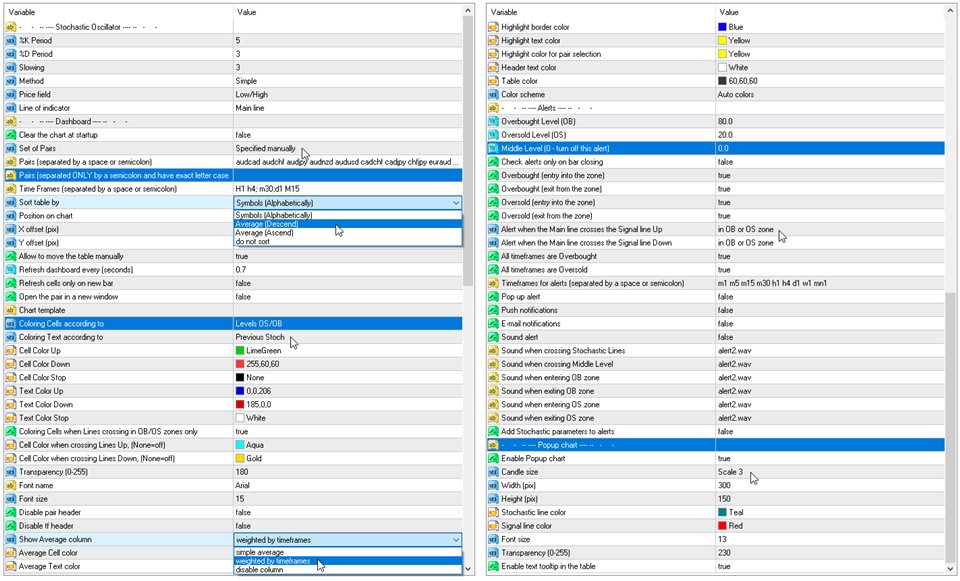
%K Period — the period of the K line.
%D Period — the period of the D line.
Slowing — slowing;
Method — method of averaging;
Price field — price type.
Line of indicator — line index.
Clear the chart at startup — clear the chart at startup.
Set of Pairs — set of symbols:
    — Market Watch — pairs from the "Market Watch".
    — Specified manually — pairs specified manually, in the parameters "Pairs".
    — Current pair — show only the current pair.
    Pairs (separated by a space or semicolon) — list of symbols separated by spaces or semicolons. The currency names should be written exactly like the broker's, keeping the case and prefix/suffix.
    Time Frames (separated by a space or semicolon) — list of timeframes separated by spaces or semicolons.
    Sort pairs — sorting the list of pairs.
    Position on chart — corner to display the panel on the chart.
    X offset (pix) — shift the panel along the X axis;
    Y offset (pix) — shift the panel along the Y axis;
    Refresh dashboard every (seconds) — update period for all pairs and timeframes.
    Open the pair in a new window — open a symbol in a new chart window by clicking.
    Chart template — the name of the template for the chart, if the chart opens in a new window.
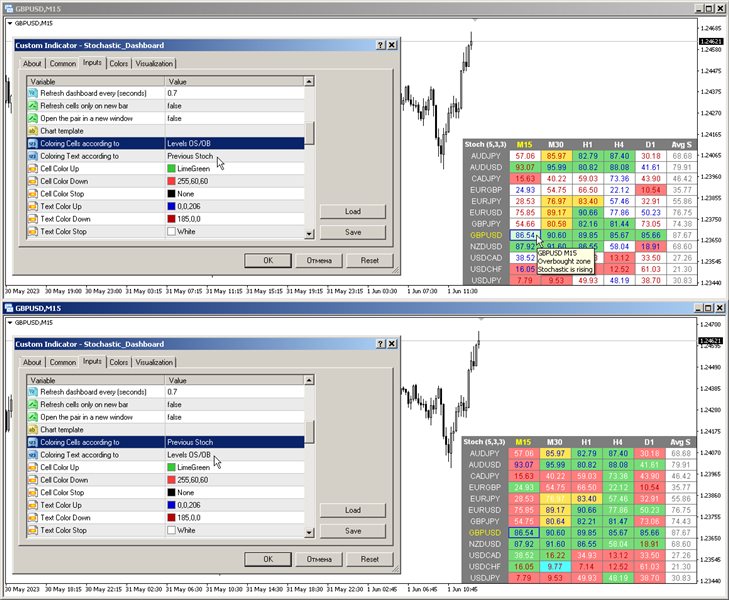
    Coloring the cells according to the — color of the table cells according to the overbought / oversold levels or according to the direction of the previous candle.
    Check Lines crossing only in OB/OS zones — determine the intersection of Lines only in Overbought/Oversold zones.
      Color settings
      Color Up — cell color if the indicator increases or crossed overbought level.
      Color Down — cell color if the indicator decreases or crossed oversold level.
      Color Stop — cell color if the indicator does not change.
      Color when crossing Lines Up — cell color when the Main line crosses the Signal line up.
      Color when crossing Lines Down — cell color when the Main line crosses the Signal line down.
      Transparency (0-255) — transparency of the panel.
      Font name — font name.
        Alerts
        Overbought level — overbought level for alerts.
        Oversold level — oversold level for alerts.
        Middle Level (0 - turn off this alert) — third level crossing check (alert only). If zero is specified, checking for this level is disabled.
        Check alerts only on bar closing — check alerts only when the bar is closed.
        Overbought/Oversold (entry into the zone) — send alert when entering the overbought or oversold zone.
        Overbought/Oversold (exit from the zone) — send alert when leaving the overbought or oversold zone.
        Main line crosses the Signal line Up — alert when the Main line crosses the Signal line up.
        Main line crosses the Signal line Down — alert when the Main line crosses the Signal line down.
        All timeframes are Overbought/Oversold — alert when all periods enter the overbought or oversold zone.
        Timeframes for alerts (separated by a space or semicolon) — list of periods for which the alert will be sent (separated by a space or semicolon).

          Recommended products
          This indicator allows you to enjoy the two most popular products for analyzing request volumes and market deals at a favorable price: Actual Depth of Market Chart Actual Tick Footprint Volume Chart This product combines the power of both indicators and is provided as a single file. The functionality of Actual COMBO Depth of Market AND Tick Volume Chart is fully identical to the original indicators. You will enjoy the power of these two products combined into the single super-indicator! Below is
          40 USD
          The Initial Balance (Initial Balance / Initial Balance) is a concept related to the study of volume (to learn more, study about Market Profile and Auction Market Theory. You can find some videos in English when searching for "Initial Balance Market Profile"). The IB defines a range in which prices were negotiated in the first hour of trading.The amplitude of the range is important and the break in the range defined by the Initial Balance may have occurred due to the movement of several players
          30 USD
          The uniqueness of this indicator lies in the volume accounting algorithm: accumulation occurs directly for the selected period without reference to the beginning of the day. The last bars can be excluded from the calculation, then the current data will have less influence on the significant levels (volumes) formed earlier. For a more accurate calculation, data from the M1 graph is used by default. The step of distribution of price volumes is regulated. By default, the right border of the display
          35 USD
          MR Dynamic POC 5
          Sergey Khramchenkov
          The indicator was created for the "Masters of Risk" trading system. The POC volume, known as the "Point of Control" , is the price with the highest trading volume over a selected time period. At this price, the positions of large traders and institutions accumulated. It serves as a reference point for all market participants. Price usually reacts to POC levels. The indicator can show the price changes of the maximum volume accumulation (POC). Settings are compared with volumes in NinjaTrader 8
          150 USD
          A Heatmap with a Volume Profile is like a thermal imager or x-ray machine . It will help you to estimate the relative distribution of volume during the price movement and to understand  the relationship between  volume and price.  Indicator Volume Profile " Volumos Maxima " is a powerful tool for analyzing this relationship. After simple experimentation with heatmap , you can find that each trading instrument has its own “ characteristic ” way of distributing volume. And this will help you to ma
          85 USD
          BoxChart MT5
          Evgeny Shevtsov
          5 (6)
          The market is unfair if only because 10% of participants manage 90% of funds. An ordinary trader has slim changes to stand against these "vultures". This problem can be solved. You just need to be among these 10%, learn to predict their intentions and move with them. Volume is the only preemptive factor that faultlessly works on any timeframe and symbol. First, the volume appears and is accumulated, and only then the price moves. The price moves from one volume to another. Areas of volume accumu
          33 USD
          The indicator builds current quotes, which can be compared with historical ones and on this basis make a price movement forecast. The indicator has a text field for quick navigation to the desired date. Options: Symbol - selection of the symbol that the indicator will display; SymbolPeriod - selection of the period from which the indicator will take data; IndicatorColor - indicator color; Inverse - true reverses quotes, false - original view; Next are the settings of the te
          55 USD
          ClusterSecondForex
          Rafil Nurmukhametov
          4.67 (3)
          The utility allows you to build different types of graphs: Seconds chart from 1 second to 86400 seconds Tick chart from 1 tick and above The volume chart Delta chart Renko chart Range chart Product demo https://www.mql5.com/ru/channels/clustersecondforex Built-in indicators for volumetric analysis: daily market profile and market profile of the selected timeframe, Cluster Search Imbalance VWAP Dynamic POC, VAH, VAL the profile depth of the market vertical volume with various display options, del
          55 USD
          Quick deals EA
          Aleksandr Slavskii
          Горячие клавиши плюс клик левой кнопки мыши на графике. Советник открывает сделки, выставляет лимитные и стоповые ордера, удаляет ордера и закрывает позиции, также  делает реверс  открытых позиций, выставляет прописанные в настройках стоп лосс и тейк профит. (реверс только на неттинговых счетах) При запуске советника можно посмотреть подсказку как действует советник при нажатии клавиши + клик на графике. Правее последнего бара, ниже цены Ctrl+ЛКМ  - OpenSell Правее последнего бара, выше цены
          30 USD
          Forex Volume MT5
          KEENBASE SOFTWARE SOLUTIONS
          KT Forex Volume shows the buying and selling volume of a currency pair in the form of a colored histogram. The volume is made of buying and selling transactions in an asset. In FX market: If the buying volume gets bigger than the selling volume, the price of a currency pair would go up. If the selling volume gets bigger than the buying volume, the price of a currency pair would go down. Features Avoid the bad trades by confirming them using the tick volume data. It helps you to stay on the si
          30 USD
          Profile Map MT5
          Dmitriy Sapegin
          5 (5)
          Market Profile helps the trader to identify the behavior if major market players and define zones of their interest. The key feature is the clear graphical display of the range of price action, in which 70% of the trades were performed. Understanding of the location of volume accumulation areas can help traders increase the probability of success. The tool can be used as an independent system as well as in combination with other indicators and trading systems. this indicator is designed to suit
          39 USD
          The AW Candle Patterns indicator is a combination of an advanced trend indicator combined with a powerful candle pattern scanner. It is a useful tool for recognizing and highlighting the thirty most reliable candlestick patterns. In addition, it is a current trend analyzer based on colored bars with a   plug-in multi-timeframe trend panel that can be resized and positioned. A unique ability to adjust the display of patterns depending on the trend filtering. Advantages: Easily identifies candle p
          145 USD
          Tick Chart — full-featured chart for MetaTrader 5 A utility for creating and working with a tick chart in the MetaTrader 5 terminal. You can create a tick chart that works exactly the same as a regular chart. You can apply indicators, Expert Advisors and scripts to the tick chart. You get a fully functional tick chart on which you can work just as well as on a regular chart. You can enable the output of the Ask price data. The data are generated in the form of the upper shadow of a tick bar. Fro
          30 USD
          Market profile was developed by Peter Steidlmayer in the second half of last century. This is a very effective tool if you understand the nature and usage. It's not like common tools like EMA, RSI, MACD or Bollinger Bands. It operates independently of price, not based on price but its core is volume. The volume is normal, as the instrument is sung everywhere. But the special thing here is that the Market Profile represents the volume at each price level. 1. Price Histogram The Price Histogram
          50 USD
          1. What is this         Rising volatility and falling volatility are not the same, whether it is academic research or actual testing has shown this point.         The original ATR indicator is calculated by putting up and down fluctuations together. This indicator is to calculate separately the upward volatility and the downward volatility, which can better help you study the market. 2. Indicator description          There are two modes for the calculation of this indicator, as shown in the f
          30 USD
          This indicator displays filtered price information in the form of three colored histograms and one common colored line. This is a very colorful and beautiful indicator. Great for determining the strength and direction of price movement. This indicator has very simple settings: 1) choice of three options for calculating the indicator: - original, - demarker, - balance volume. 2) selection of five different periods. 3) selection of the displayed color. 4) choice of accuracy. /////////////////////
          30 USD
          VolumeProfile MT5
          Robert Hess
          3.33 (6)
          Description: The Volume Profile displays detailed informations of historical trading activities at certain price levels (Market Profile). Locate the areas with the best prices in the market and get an advantage over other market participants. Support: The indicator is constantly being developed and improved. Please do not hesitate to contact me via the MQL5 Platform. I am very grateful about any Bug report, so that i can constantly improve the indicator. I appreciate any public review for this
          165 USD
          An indicator of patterns #24, #25, #26 and #27 ("Head and Shoulders", "Complex Head and Shoulders") from Encyclopedia of Chart Patterns by Thomas N. Bulkowski. Parameters: Alerts - show alert when an arrow appears   Push - send a push notification when an arrow appears (requires configuration in the terminal) PeriodBars - indicator period K - an additional parameter that influences the accuracy of pattern shape recognition. The smaller the value is, the smoother the row of peaks/valleys shoul
          30 USD
          Perspective Shift is a very interesting trend indicator. The Perspective Shift indicator helps to identify either a new or an existing trend. One of the advantages of the indicator is that it is quite quickly rebuilt and reacts to various changes in the chart. Of course, it depends on the settings. The larger it is, the smoother the trend line will go. The shorter the period, the more market noise will be taken into account when forming the indicator. The goal that was pursued during its creati
          129 USD
          FRB Trader - Our mission is to provide the best support to customers through conted and tools so that they can achieve the expected results FRB Support and Resistance - Indicator places lines on the chart to show Support and Resistance regions. - You can choose the timeframe you want to calculate, as well as the colors of the lines. - Algorithm calculates the points where the strengths of the asset are considered and are extremely important for decision making.
          30 USD
          Provided Trend is a complex signal formation indicator. As a result of the work of internal algorithms, you can see only three types of signals on your chart. The first is a buy signal, the second is a sell signal, and the third is a market exit signal. Options: CalcFlatSlow - The first parameter that controls the main function of splitting the price chart into waves. CalcFlatFast - The second parameter that controls the main function of splitting the price chart into waves. CalcFlatAvg - Par
          100 USD
          IceFX VelocityMeter Mini is a very unique indicator on MetaTrader 4 platform which measures the speed of the Forex market . It is not a normal volume or other measurement indicator because IceFX VelocityMeter Mini is capable to understand market speed movements which are hidden in ticks and those valuable information cannot be read in an ordinary way from the candles. The software monitors the received ticks (frequency, magnitude of change) within a specified time range, analyzes these info and
          30 USD
          VR Calculate Martingale MT5
          Vladimir Pastushak
          5 (1)
          The VR Calculate Martingale indicator is a powerful order and position calculator for calculating profit or loss. With the help of the order and position calculator, a trader can calculate the average price of any forex currency, stocks or crypto currency. Now you can connect the indicator and start superimposing virtual orders on your real orders and positions. By creating additional virtual positions, you can calculate any development of the situation. The indicator has a built-in lot calculat
          35 USD
          Bear Bull
          Ignacio Agustin Mene Franco
          Bear Bull! It is an indicator that marks with Heikin Ashi candles but modified, the sales and purchases long and short trend! with 2 colors green marks the purchase, purple marks the sale, works for any type of temporality, works for forex markets and synthetic indices! ideal for any pair, it also works for crypto pairs, Good profit! World Investor - World Inversor - 
          30 USD
          VolumeDeltaBars
          Stanislav Korotky
          This indicator is a conventional analytical tool for tick volumes changes. It calculates tick volumes for buys and sells separately, and their delta on every bar, and displays volumes by price clusters (cells) within a specified bar (usually the latest one). The algorithm used internally is the same as in the indicator VolumeDeltaMT5 , but results are shown as cumulative volume delta bars (candlesticks). Analogous indicator for MetaTrader 4 exists - CumulativeDeltaBars . This is a limited substi
          30 USD
          Market Profile defines a number of day types that can help the trader to determine market behaviour. A key feature is the Value Area, representing the range of price action where 70% of trading took place. Understanding the Value Area can give traders valuable insight into market direction and establish the higher odds trade. It is an excellent addition to any system you may be using. Blahtech Limited presents their Market Profile indicator for the MetaTrader community. Inspired by Jim Dalton’s
          142 USD
          The  DYJ MOBILE GAMING TRADING WINNER  can use your various terminals (MOBILE PHONE, WEB, TRADINGVIEW, MT5) for manual trading, and then automatically processed by EA. Mobile trading can use EA's various grid modes, scalp mode, hedging arbitrage mode and independent order mode to open positions manually, EA can automatically set stop loss for mobile opening. And use your mobile phone to open a grid, scalp, and hedge orders. EA can set up fully automatic trading, set up automatic and mobile phone
          125 USD
          The Roll the Field indicator displays signals in a simple and accessible way in two colors (when to buy and when to sell is determined by changing the color). Knowing the entry point of each currency is very important for every forex trader. The intelligent algorithm of the indicator accurately determines the trend, filters out market noise and generates entry signals.
          77 USD
          COSMOS4U Volume MT5
          COSMOS4U - D. Vezeris & Co, L.P.
          1 (1)
          COSMOS4U Volume indicator facilitates your trade decisions. It gives confirmation of the running movement and market trends. It highlights current and past accumulation and distribution volumes, comparing them to moving average volume and the highest volume. In addition, it identifies and marks nuances as well as convergence and divergence patterns of bears and bulls in order to provide the market trend and price ranges. The supported features are as follows: Fast Volume Moving Average Slow Volu
          39 USD
          Trend Fibonacci is a unique indicator that combines a power of Fibonacci sequences and ranges. How to read: - There are three zones --> red, gold and green - Red candlestick = downtrend - Green candlestick = uptrend   - Gold candlestick = no established trend Inputs: Per = number of bars used for calculations FirstRatio = first Fibonacci ratio (Or use any ratio you want) SecondRatio = second Fibonacci ratio (Or use any ratio you want) !! IF YOU PURCHASE THE INDICATOR, CONTACT ME FOR
          47 USD
          Buyers of this product also purchase
          Top indicator for MT5   providing accurate signals to enter a trade without repainting! It can be applied to any financial assets: forex, cryptocurrencies, metals, stocks, indices .  MT4 version is here It will provide pretty accurate trading signals and tell you when it's best to open a trade and close it. Watch  the video  (6:22) with an example of processing only one signal that paid off the indicator! Most traders improve their trading results during the first trading week with the help of
          125 USD
          ICT, SMC, SMART MONEY CONCEPTS, SMART MONEY, Smart Money Concept, Support and Resistance, Trend Analysis, Price Action, Market Structure, Order Blocks, BOS/CHoCH,   Momentum Shift, HH/LL/HL/LH,    Fair Value Gap, FVG,  Premium  &   Discount   Zones, Fibonacci Retracement, OTE, Buy Side Liquidity, Sell Side Liquidity, BSL/SSL Taken, Equal Highs & Lows, MTF, Multiple Time Frame, BigBar, HTF OB, HTF Market Structure,  Liquidity Voids, Long Wicks, Candle Timer, Fractals, ZigZag, Time Zone, Market S
          63 USD
          Gold Stuff mt5
          Vasiliy Strukov
          4.97 (92)
          Gold Stuff mt5 is a trend indicator designed specifically for gold and can also be used on any financial instrument. The indicator does not redraw and does not lag. Recommended time frame H1. Contact me immediately after the purchase to get the settings and a personal bonus!  SETTINGS Draw Arrow - on off. drawing arrows on the chart. Alerts -   on off audible alerts. E-mail notification - on off. email notifications. Puch-notification - on off. Push notifications. Next, adjust the color gamut.
          50 USD
          Trend Screener Pro MT5
          STE S.S.COMPANY
          4.97 (36)
          Trend Indicator, Breakthrough  unique Solution For Trend Trading And Filtering With All Important trend Features Built Inside One Tool!   It's 100% non-repainting multi-timeframe and Multi-currencies indicator that can be used on all symbols/instruments: forex, commodities, cryptocurrencies, indices and stocks. LIMITED TIME OFFER : Trend Screener Indicator is available for only 50 $ and lifetime. ( Original price 125$ ) Trend Screener is an efficient indicator trend following indicator taht pr
          50 USD
          Advanced Supply Demand MT5
          Bernhard Schweigert
          4.36 (11)
          Best Solution for any Newbie or Expert Trader! This indicator is a unique, high quality and affordable trading tool because we have incorporated a number of proprietary features and a new formula. With this update, you will be able to show double timeframe zones. You will not only be able to show a higher TF but to show both, the chart TF, PLUS the higher TF: SHOWING NESTED ZONES. All Supply Demand traders will love it. :) Important Information Revealed Maximize the potential of Advanced Suppl
          199 USD
          Blahtech Supply Demand MT5
          Blahtech Limited
          4.45 (11)
          Supply Demand uses previous price action to identify potential imbalances between buyers and sellers. The key is to identify the better odds zones, not just the untouched ones. Blahtech Supply Demand indicator delivers functionality previously unavailable on any trading platform. This 4-in-1 indicator not only highlights the higher probability zones using a multi-criteria strength engine, but also combines it with multi-timeframe trend analysis, previously confirmed swings and engulfing detecto
          142 USD
          The ADR Reversal Indicator shows you at a glance where price is currently trading in relation to it's normal average daily range. You will get instant alerts via pop-up, email or push when price exceeds it's average range and levels above it of your choosing so you can jump into pullbacks and reversals quickly. The indicator draws horizontal lines on the chart at the average daily range extremes and also extensions above those levels which have mathematical probabilities attached to them of pric
          49 USD
          Profit from market structure changes as price reverses and pulls back. The market structure reversal alert indicator identifies when a trend or price move is approaching exhaustion and ready to reverse. It alerts you to changes in market structure which typically occur when a reversal or major pullback are about to happen. The indicator identifies breakouts and price momentum initially, every time a new high or low is formed near a possible exhaustion point. The indicator draws in a rectangle on
          49 USD
          AW Trend Predictor MT5
          Alexander Nechaev
          5 (24)
          The combination of trend and breakdown levels in one system. An advanced indicator algorithm filters market noise, determines the trend, entry points, as well as possible exit levels. Indicator signals are recorded in a statistical module, which allows you to select the most suitable tools, showing the effectiveness of the signal history. The indicator calculates Take Profit and Stop Loss marks. Manual and instruction ->  HERE  / MT4 version ->  HERE How to trade with the indicator:  Trading wit
          55 USD
          Royal Wave Pro M5
          Vahidreza Heidar Gholami
          5 (2)
          Royal Wave is a Trend-Power oscillator which has been programmed to locate and signal low-risk entry and exit zones. Its core algorithm statistically analyzes the market and generates trading signals for overbought, oversold and low volatile areas. By using a well-designed alerting system, this indicator makes it easier to make proper decisions regarding where to enter and where to exit trades. Features Trend-Power Algorithm Low risk Entry Zones and Exit Zones Predictions for Overbought and Over
          129 USD
          The ADR Alert Dashboard shows you at a glance where price is currently trading in relation to it's normal average daily range. You will get instant alerts via pop-up, email or push when price exceeds it's average range and levels above it of your choosing so you can jump into pullbacks and reversals quickly. The dash is designed to be placed on a blank chart and just sit in the background and alert you when levels are hit so you do not need to sit and watch it or even look at all! MT4 VERSION AV
          49 USD
          Matrix Arrow Indicator MT5
          Juvenille Emperor Limited
          5 (11)
          Matrix Arrow Indicator MT5  is a unique 10 in 1 trend following   100% non-repainting  multi-timeframe indicator that can be used on all symbols/instruments:   forex,   commodities,   cryptocurrencies,   indices,   stocks .  Matrix Arrow Indicator MT5  will determine the current trend at its early stages, gathering information and data from up to 10 standard indicators, which are: Average Directional Movement Index (ADX) Commodity Channel Index (CCI) Classic Heiken Ashi candles Moving Aver
          75 USD
          Stargogs Spike Catcher
          Lorenzo Edward Beukes
          5 (6)
          Stargogs Spike Catcher V3 This Indicator is Developed To milk the BOOM and CRASH indices . Send me Message if you need any help with the indicator.  CHECK OUT THE STARGOGS SPIKE CATCHER EA/ROBOT V3: CLICK HERE ALSO CHECK OUT SECOND TO NONEFX SPIKE CATCHER:   CLICK HERE STARGOGS SPIKE CATCHER V3 WHATS NEW! Brand New Strategy. This is the Indicator you need for 2023. The Indicator Gives you an Entry at a time when conditions are met and you should use TP & SL. New Trendline that changes color in
          100 USD
          Royal Scalping Indicator M5
          Vahidreza Heidar Gholami
          5 (8)
          Royal Scalping Indicator is an advanced price adaptive indicator designed to generate high-quality trading signals. Built-in multi-timeframe and multi-currency capabilities make it even more powerful to have configurations based on different symbols and timeframes. This indicator is perfect for scalp trades as well as swing trades. Royal Scalping is not just an indicator, but a trading strategy itself. Features Price Adaptive Trend Detector Algorithm Multi-Timeframe and Multi-Currency Trend Low
          149 USD
          Introduction to X3 Chart Pattern Scanner X3 Cherart Pattern Scanner is the non-repainting and non-lagging indicator detecting X3 chart patterns including Harmonic pattern, Elliott Wave pattern, X3 patterns, and Japanese Candlestick patterns. Historical patterns match with signal patterns. Hence, you can readily develop the solid trading strategy in your chart. More importantly, this superb pattern scanner can detect the optimal pattern of its kind. In addition, you can switch on and off individu
          250 USD
          Automated Trendlines MT5
          Georgios Kalomoiropoulos
          Trendlines  are the most essential tool of technical analysis in forex trading.  Unfortunately, most  traders don’t draw them correctly. Automated Trendlines indicator is a professional tool for serious traders that help you visualize the trending movement of the markets . There are two types of Trendlines Bullish Trendlines and Bearish Trendlines. In the uptrend, Forex trend line is drawn through the lowest swing-points of the price move. Connecting at least two "lowest lows" will create a
          99 USD
          This dashboard is an alert tool for use with the market structure reversal indicator. It's primary purpose is to alert you to reversal opportunities on specific time frames and also to the re-tests of the alerts (confirmation) as the indicator does. The dashboard is designed to sit on a chart on it's own and work in the background to send you alerts on your chosen pairs and timeframes. It was developed after many people requested a dash to monitor multiple pairs and time frames at once rather th
          49 USD
          Strong Support mt5
          Vasiliy Strukov
          5 (5)
          Support and resistance levels have long been a powerful tool for market analysis. The Strong Support indicator plots support levels based on local price minima, and resistance levels based on local price maxima. My other developments can be viewed   here It is recommended to use together with a trend indicator, for example, Gold Stuff - this will allow you to trade according to the trend and simultaneously determine the zones of consolidation or trend reversal, as well as set stop loss and
          50 USD
          Offer 249 down from 350 for the next 3 copies. then back to 350 $ Are you tired of using outdated indicators that leave you guessing where to set your profit targets? Look no further than the AK CAP Opening Range Breakout Indicator. This powerful tool is backed by a US patent and has already helped countless traders pass funded challenges like FTMO. We use it daily on our prop traders and internal funds, and now it's available to you as well. The calculation behind the indicator is incredibly
          249 USD
          Trend Scanner mt5 GS
          Vasiliy Strukov
          5 (6)
          Trend Scanner mt5 scans market trends from Multi-Symbols and Multi-Time frames and displays it on a movable panel on the chart. It uses  Gold stuff indicator   for analysis .The trader can select multiple pairs of his choice for display.   Trend Scanner is a great tool to see the direction of the trend and can be used for manual trading or EA trading by allowing only buy or sell orders according to the trend. Real-time results can be viewed  here . Contact me immediately after the purchase to g
          50 USD
          Auto Order Block with break of structure Detect Break of Structure , Mark Order Block and draw Entry / Stop and Risk to Reward lines when Order block is touch by price with Alert. Trend is Manually set to filter signals in a direction by a button on the chart. Entry / Stop and Risk to Reward lines can also be switch on / off by button on chart. Futures Auto Mark Break of Structure Auto Mark Order block Auto Mark higher time frame Point Of  Interest ( POI ) Popup Alert when BoS , Order block
          55 USD
          Market Structure MT5
          Reza Aghajanpour
          5 (1)
          **   All Symbols   x   All Timeframes   scan just by pressing scanner button ** *** Contact me immediately after the purchase to send you instructions and add you in "Market Structure group" for sharing or seeing experiences with other users. CURRENT PRICE $39..... Future Price $200 Introduction: Market structure is important for both new and professional traders since it can influence the liquidity and price action of a market. It’s also one of the most commonly used techniques to understand tr
          39 USD
          MTF Supply Demand Zones MT5
          Georgios Kalomoiropoulos
          Next Generation Of Automated Supply And Demand Zones. New and Innovative Algorithm that Works At Any Chart. All Zones Are Being Created Dynamically According To Price Action Of The Market. TWO TYPES OF ALERTS -->  1) WHEN PRICE HITS A ZONE    2)WHEN A NEW ZONE IS FORMED  If you get the MTF Supply Demand Zones you can join the " Trade Like Me " Video Series. It contains 14 Live Sessions where  i am placing trades on Forex, Stocks, Indices and Metals. You will be able to see how i am evaluati
          149 USD
          Italo Volume Indicator MT5
          Italo Santana Gomes
          5 (9)
          BUY INDICATOR AND GET EA FOR FREE AS A BONUS + SOME OTHER GIFTS! ITALO VOLUME INDICATOR  is the best volume indicator ever created, and why is that? The Indicator works on all time-frames and assets, indicator built after 6 years of experience on forex and many other markets. You know many volume indicators around the internet are not complete, does not help, and it's difficult to trade, but the Italo Volume Indicator is different , the Italo Volume Indicator shows the wave volume, when market
          65 USD
          Owl Smart Levels MT5
          Sergey Ermolov
          5 (1)
          Indicator Guide   |   Owl Smart Levels Strategy   |   MT4 version  |  How to install?   |   FAQ The Owl Smart Levels Indicator is a complete trading system within the one indicator that includes such popular market analysis tools as Bill Williams' advanced fractals , Valable ZigZag which builds the correct wave structure of the market, and Fibonacci levels which mark the exact levels of entry into the market and places to take profits. For a detailed description of the trading system, see the a
          97 USD
          The RSI / TDI alert dashboard allows you to monitor RSIs at once (selectable by you) on every major pair you trade. You can use it in two ways: 1.   Select multiple time frames and the dash will show you when there are multiple time frames extended beyond normal trading conditions. A great indicator that price has pushed hard recently as it has achieved an overbought or oversold level across multiple time frames so a pullback or reversal is due soon. 2.   Use one time frame (your favourite to tr
          49 USD
          PZ Day Trading MT5
          PZ TRADING SLU
          2.6 (5)
          This indicator detects price reversals in a zig-zag fashion, using only price action analysis and a donchian channel. It has been specifically designed for short-term trading, without repainting or backpainting at all. It is a fantastic tool for shrewd traders aiming to increase the timing of their operations. [ Installation Guide | Update Guide | Troubleshooting | FAQ | All Products ] Amazingly easy to trade It provides value on every timeframe It displays suitable SL and TP levels It impl
          125 USD
          Tired of plotting support and resistance lines? This is a multi-timeframe indicator that detects and plots supports and resistance lines in the chart with the same precision as a human eye would. As price levels are tested over time and its importance increases, the lines become thicker and darker, making price leves easy to glance and evaluate. [ Installation Guide | Update Guide | Troubleshooting | FAQ | All Products ] Boost your technical analysis Customizable timeframe selection Read pri
          99 USD
          ** All Symbols x All Timeframes scan just by pressing scanner button ** ***Contact me after purchase to send you instructions and add you in "123 scanner group" for sharing or seeing experiences with other users. After 15 years of experience in the markets and 3 years of programming, Winner indicator is ready. I would like to share with you! Introduction The 123 Pattern Scanner indicator with a special enhanced algorithm is a very repetitive common pattern finder with a high success rate . Inte
          39 USD
          PZ Divergence Trading MT5
          PZ TRADING SLU
          3.67 (3)
          Tricky to find and scarce in frequency, divergences are one of the most reliable trading scenarios. This indicator finds and scans for regular and hidden divergences automatically using your favourite oscillator. [ Installation Guide | Update Guide | Troubleshooting | FAQ | All Products ] Easy to trade Finds regular and hidden divergences Supports many well known oscillators Implements trading signals based on breakouts Displays suitable stop-loss and take-profit levels Configurable oscilla
          125 USD
          More from author
          MA Dashboard
          Taras Slobodyanik
          4.5 (2)
          Multicurrency and multitimeframe modification of the indicator Moving Average (MA). On the dashboard you can see the current state of the indicator - breakouts and touches (by price) of the Fast MA and Slow MA, as well as the intersection of the MA lines between each other. In the parameters you can specify any desired currencies and timeframes. Also, the indicator can send notifications about the price touching the lines and about their crossing. By clicking on a cell with a period, this symbol
          30 USD
          Multicurrency and multitimeframe modification of the Relative Strength Index (RSI) indicator. You can specify any desired currencies and timeframes in the parameters. Also, the panel can send notifications when crossing overbought and oversold levels. By clicking on a cell with a period, this symbol and period will be opened. Parameters RSI Period — averaging period. RSI Applied price — price type. Clear the chart at startup — clear the chart at startup. Set of Pairs — set of symbols —
          30 USD
          Multicurrency and multitimeframe indicator of the Standard Deviation Channel. Displays the current direction of the market. On the panel, you can see breakouts and touches (by price) of the levels of the linear regression channel. In the parameters, you can specify any desired currencies and timeframes. Also, the indicator can send notifications when levels are touched. By clicking on a cell, this symbol and period will be opened. «Standard Deviation Channel is built on base of Linear Regressio
          30 USD
          News Dashboard MT4
          Taras Slobodyanik
          4.33 (6)
          This dashboard displaying current news from ForexFactory.com (calendar FFC) and from the Investing.com website . You can sort news by impact and by country, and display them on the chart with one click. By holding down the 'Ctrl' key, you can select several different 'currencies' or 'impacts' to sort. Also, this utility shows not only the forecast, but also the actual values ​​after they appear on the site. You can set a separate notification for each news. You can read the news using your EA
          49 USD
          Fractals Dashboard MT4
          Taras Slobodyanik
          5 (3)
          Multicurrency and multitimeframe modification of the Fractals indicator. Displays the last two fractals — their sequence (and which one is broken), or the distance between them. You can specify any desired currencies and timeframes in the parameters. Also, the panel can send notifications on a fractal's breakout. By clicking on a cell with a period, this symbol and period will be opened. Parameters Calculation of fractals based on  — fractal search mode; —   standart indicator   — by the stan
          30 USD
          The indicator shows the High/Low /Open/Close   Levels from other (and non-standard) timeframes - Year, 6 Months, 4 Months, 3 Months, 2 Months, Month, Week, Day, 4 Hours. You can also set the shift for opening candles and build virtual candles. "Period separators" for one of these timeframes is available in the form of vertical lines. Alerts can be configured for breakouts of the current or previous levels. You can also shift all levels to the right by one period. That is, the High/Low of the
          30 USD
          Lines Profit Loss
          Taras Slobodyanik
          4.76 (17)
          The indicator displays profit (loss) on the current symbol. You can freely drag and drop the line to display the current profit or loss. Parameters Calculation in money or in points — calculate the profit/loss in points or money. Add pending orders to calculate — take pending orders into account in calculations. Magic Number (0 - all orders on symbol) — magic number, if it is necessary to evaluate specific orders. Offset for first drawing (points from the average price) — offset of the line fr
          FREE
          Multicurrency and multitimeframe modification of the indicator Bollinger Bands. On the dashboard you can see breakouts and touches of the Bollinger Bands. In the parameters you can specify any desired currencies and timeframes. The indicator can also send notifications when touching Bollinger Bands. By clicking on a cell with a period, this symbol and period will be opened. Parameters Bollinger Bands Settings Averaging period — averaging period for calculating the indicator. Standard deviati
          30 USD
          Gann Square of 144
          Taras Slobodyanik
          4.43 (7)
          The Gann Box (or Gann Square) is a market analysis method based on the "Mathematical formula for market predictions" article by W.D. Gann. This indicator can plot three models of Squares: 90, 52(104), 144. There are six variants of grids and two variants of arcs. You can plot multiple squares on one chart simultaneously. Parameters Square — selection of a square model: 90 — square of 90 (or square of nine); 52 (104) — square of 52 (or 104); 144 — universal square of 144; 144 (full) — "full"
          49 USD
          Lines Profit Loss MT5
          Taras Slobodyanik
          4.6 (10)
          The indicator displays profit (loss) on the current symbol. You can freely drag and drop the line to display the current profit or loss. Parameters Calculation in money or in points — calculate the profit/loss in points or money. Add pending orders to calculate — take pending orders into account in calculations. Magic Number (0 - all orders on symbol) — magic number, if it is necessary to evaluate specific orders. Offset for first drawing (points from the average price) — offset of the line f
          FREE
          Multicurrency and multitimeframe modification of the Stochastic Oscillator. You can specify any desired currencies and timeframes in the parameters. The indicator displays the current values and intersections of the lines — Signal and Main. Also, the indicator can send notifications when crossing overbought and oversold levels. By clicking on a cell with a period, this symbol and period will be opened. Parameters %K Period — the period of the K line. %D Period — the period of the D line. Slow
          35 USD
          ADX Dashboard
          Taras Slobodyanik
          5 (2)
          ADX indicator is used to determine the trend and its strength. The direction of the price is shown by the +DI and -DI values, and the ADX value shows the strength of the trend. If +DI is above -DI, then the market is in an uptrend, if on the contrary, it is a downtrend. If ADX is below 20, then there is no definite direction. As soon as the indicator breaks this level, a medium-strength trend begins. Values above 40 indicate a strong trend (a downtrend or an uptrend). Multicurrency and multit
          30 USD
          MA Dashboard MT5
          Taras Slobodyanik
          5 (1)
          Multicurrency and multitimeframe modification of the indicator Moving Average (MA). On the dashboard you can see the current state of the indicator - breakouts and touches (by price) of the Fast MA and Slow MA, as well as the intersection of the MA lines between each other. In the parameters you can specify any desired currencies and timeframes. Also, the indicator can send notifications about the price touching the lines and about their crossing. By clicking on a cell with a period, this symbol
          30 USD
          The indicator shows the High/Low /Open/Close   Levels from other (and non-standard) timeframes - Year, 6 Months, 4 Months, 3 Months, 2 Months, Month, Week, Day, 4-6-8-12 Hours. You can also set the shift for opening candles and build virtual candles. "Period separators" for one of these timeframes is available in the form of vertical lines. Alerts can be configured for breakouts of the current or previous levels. You can also shift all levels to the right by one period. That is, the High/Low
          34 USD
          Angle Dashboard
          Taras Slobodyanik
          5 (1)
          This is a multicurrency and multitimeframe indicator that calculates the angle between two points. Points for measuring the angle can be taken from the ZigZag (the last two points), or from the Moving Average (between two given bars), or it can be the closing prices of bars. Angle measurement is possible in degrees or in radians. You can select the scale for the calculation. For a better understanding of the indicator, you can study the free Angle High Low indicator. In the parameters you can
          30 USD
          This dashboard displays current news from three sources: from the ForexFactory.com website (FFC calendar), from the Investing.com website and the Economic Calendar from mql5.com. You can sort news by impact and by country, and display them on the chart with one click. By holding down the 'Ctrl' key, you can select several different 'currencies' or 'impacts' to sort. Also, this utility shows not only the forecast, but also the actual values ​​after they appear on the site. You can set a separate
          59 USD
          Easy Grider
          Taras Slobodyanik
          4.5 (2)
          The EA creates an order grid using labels. Opening and closing of the grid is done either automatically by the system signals or manually. In the same grid can be both Limit and Stop orders. It is possible to reverse the grid on specified condition. You can enter the breakdown/rebound from established levels. All types of Sell limit, Buy limit, Buy stop, Sell stop orders are supported. The grid is rebuilt with a single click. The stop loss and take profit lines can be easily modified. You are fr
          150 USD
          ZigZag Lines MTF
          Taras Slobodyanik
          4.11 (9)
          Multitimeframe ZigZag indicator. It displays the support/resistance lines and their breakouts, as well as draws the current targets of the market. It can also display lines of the Fractals indicator and candles from other periods (up to Quarterly).  The indicator redraws the last (current) point, and in some cases can change the last 2-3 points. All lines are drawn as objects (not indicator buffers, but there is a possibility to receive the data for the EA ). When used in an Expert Advisor,
          35 USD
          ZigZag Lines MTF for MT5
          Taras Slobodyanik
          5 (7)
          Multitimeframe ZigZag indicator. It displays the support/resistance lines and their breakouts, as well as draws the current targets of the market. It can also display lines of the Fractals indicator and candles from other periods (up to Quarterly).  The indicator redraws the last (current) point, and in some cases can change the last 2-3 points. All lines are drawn as objects (not indicator buffers, but there is a possibility to receive the data for the EA ). When used in an Expert Advisor,
          35 USD
          Multicurrency and multitimeframe indicator Inside Bar (IB). In the parameters, you can specify any desired currencies and timeframes. The indicator displays the last found Inside Bar (and Mother Bar) pattern, the current price position and the breakout of the levels of the Mother and Inside Bars. You can set the size and color for bars and text in the cells. The indicator can also send notifications when levels are broken. By clicking on a cell with a period, the specified symbol and period wil
          30 USD
          ZigZag Dashboard for MT4
          Taras Slobodyanik
          5 (3)
          Multicurrency and multitimeframe modification of the ZigZag indicator. Displays the current direction of the market, the height of the last movement, the number of bars in this movement and the breaking of the previous point of the ZigZag. You can specify any desired currencies and timeframes in the parameters. Also, the panel can send notifications when the ZigZag changes direction or when there was a breakthrough of the previous point. By clicking on a cell with a period, this symbol and pe
          30 USD
          Time Scale for MT5
          Taras Slobodyanik
          5 (7)
          The indicator draws the time scale on the chart. You can specify the time offset, adjust the size and font to display on the chart. You can also select the desired format for displaying the date and time. Parameters Hours (time shift) — time shift (hours); Minutes (time shift) — time shift (minutes); Show time on mouse — show time under the pointer; Precise time scale  — calculate the time between bars; Hide MT's time scale — hide the standard scale; Scale date format —  format for the date
          FREE
          MTF macd for MT5
          Taras Slobodyanik
          The Moving Averages Convergence/Divergence indicator displays information simultaneously from different periods in one subwindow of the chart. Parameters Fast EMA — period for Fast average calculation. Slow EMA — period for Slow average calculation. MACD SMA — period for their difference averaging. Type of price — price used. Timeframes for MACD — list of periods, separated by a space or comma or semicolon. Number of bars for each period — the number of bars displayed for each period. Sort per
          30 USD
          Fractals Dashboard MT5
          Taras Slobodyanik
          5 (1)
          Multicurrency and multitimeframe modification of the Fractals indicator. Displays the last two fractals — their sequence (and which one is broken), or the distance between them. You can specify any desired currencies and timeframes in the parameters. Also, the panel can send notifications on a fractal's breakout. By clicking on a cell with a period, this symbol and period will be opened. Parameters Calculation of fractals based on  — fractal search mode; —   standart indicator   — by the st
          30 USD
          The Gann Box (or Gann Square) is a market analysis method based on the "Mathematical formula for market predictions" article by W.D. Gann. This indicator can plot three models of Squares: 90, 52(104), 144. There are six variants of grids and two variants of arcs. You can plot multiple squares on one chart simultaneously. Parameters Square — selection of a square model: 90 — square of 90 (or square of nine); 52 (104) — square of 52 (or 104); 144 — universal square of 144; 144 (full) — "full"
          52 USD
          Symbol Manager
          Taras Slobodyanik
          5 (5)
          Symbol Manager or Grid Manager, designed to group orders into one position (by symbol and by direction). This utility will be useful to multi-currency traders, who can have multiple orders on several pairs. You will be able to see the total number of lots, the total profit, and set virtual stop loss and virtual take profit. To set a real TP (or SL), you must first set the virtual value, and then enter the command in this cell: "set". If you want to set real TP/SL for all orders at once, then en
          40 USD
          ADX indicator is used to determine the trend and its strength. The direction of the price is shown by the +DI and -DI values, and the ADX value shows the strength of the trend. If +DI is above -DI, then the market is in an uptrend, if on the contrary, it is a downtrend. If ADX is below 20, then there is no definite direction. As soon as the indicator breaks this level, a medium-strength trend begins. Values above 40 indicate a strong trend (a downtrend or an uptrend). Multicurrency and multit
          35 USD
          The indicator draws the Fibonacci levels based on  ZigZag indicator,  Trading Sessions,  Fractals or Candles (including non-standard timeframes: Year, 6 Months, 4 Months, 3 Months, 2 Months). The levels are redrawn every time the current bar closes. It is possible to enable alerts when crossing the specified levels. You can also analyze levels in history. To do this, it is necessary to specify the number of Fibo levels in the "Number of Fibo in the past" parameter. Parameters Calculate Fibo a
          35 USD
          Tetris for MT5
          Taras Slobodyanik
          5 (1)
          The Tetris — the most famous time killer is now on MT. Game develops active logic, attention and speed of decision making. This is a classic version of the game, no frills, but you can still adjust the size of the glass, the scale of the game, the color of the figures, and the desired speed. The game is made as an indicator. Control Keys: 'W,A,S,D' or 'Cursor' or 'NumPad'. S — Start new game. C — Continue previous game. P — pause on / off. Space  — drop a figure. Esc — exit to menu.
          FREE
          MTF RSI for MT5
          Taras Slobodyanik
          5 (1)
          Multi-timeframe indicator Relative Strength Index displays information simultaneously from different periods in one subwindow of the chart. Parameters Period of averaging — averaging period for the RSI calculation. Type of price — price used. Timeframes for RSI — list of periods, separated by a space or comma or semicolon. Number of bars for each period — the number of bars displayed for each period. Sort periods — sort periods if they are listed in no particular order. Current period first —
          30 USD
          Filter:
          No reviews
          Reply to review
          Version 5.0 2023.03.22
          1) Added an option to alert when crossing lines "in no zone (neither OB nor OS)".
          Version 4.90 2023.01.22
          1) Added sorting of rows by the column of Average values.
          2) Fixed a color scheme bug in the strategy tester.
          Version 4.80 2022.11.26
          1) Alert "All timeframes" is splitted into two parameters - for Overbought and four Oversold.
          Version 4.70 2022.10.04
          1) Changed "Show Average column" parameter. Added options: "simple average" and "weighted by timeframes".
          Version 4.60 2022.09.08
          1) Added parameters to change table colors.
          Version 4.50 2022.06.21
          1) Added parameter to display stochastic parameters in alert message: "Add Stochastic parameters to alerts".
          Version 4.40 2022.06.07
          1) Added separate parameters for each alert when entering and exiting the Overbought/Oversold zones.
          Version 4.30 2022.06.06
          1) Added parameters for sounds when entering and exiting the Overbought/Oversold zones.
          Version 4.20 2022.06.03
          1) Added "Refresh cells only on new bar" parameter.
          2) Added tooltips.
          Version 4.10 2022.04.12
          1) Changed the alert parameter when the stochastic lines cross. Now you can select an alert zone where the lines crossed.
          Version 4.0 2022.04.09
          1) The condition of the list of pairs for the second parameter has been changed. Pairs in the second parameter must be typed only with a semicolon and must be in exact case. "Pairs (separated ONLY by a semicolon and have exact letter case)"
          Version 3.90 2022.04.09
          1) Cell selection is disabled if there is one pair and one timeframe in the table.
          Version 3.80 2022.03.26
          1) Added a parameter to highlight the current Pair and TF. (Highlight the current Pair and TF).
          Version 3.70 2021.11.24
          1) Added a column for the average ('Show Average column').
          2) Added a parameter for the color of the average column ('Color Average').
          Version 3.60 2021.08.24
          1) Fixed a bug when launching many indicators with the "Current pair" parameter.
          Version 3.50 2021.04.13
          1) Added parameter "Allow to move the table manually".
          Version 3.40 2021.04.13
          1) Fixed cleaning of coordinates when removing the indicator from the chart.
          Version 3.30 2021.04.09
          1) Added parameter "Color ink (none=default)".
          2) Now, after double-clicking on the table headers, you can move it with the mouse. The binding to the corner of the chart remained unchanged.
          Version 3.20 2021.03.19
          1) Added options to disable the table headers.
          Version 3.10 2021.02.01
          1) The alert parameter when crossing lines is separated into two parts: alert when crossing up and alert when crossing down.
          Version 3.0 2020.12.30
          1) Disabled stopping the indicator in case of an error starting the stochastic. Now there will be a repeated attempt to launch the stochastic.
          Version 2.90 2020.12.10
          1) Fixed a bug when launching many copies with the same parameters.
          Version 2.80 2020.12.09
          1) For the parameter "Set of Pairs" added the option "Current pair".
          2) Removed the binding of the dashboard to the chart ID.
          Version 2.70 2020.09.09
          1) Added third level check - Medium level (only alert).
          2) Added a choice of sounds for each type of sound alert.
          Version 2.60 2020.06.08
          1) Recompilation for the new MT5 build.
          Version 2.50 2020.03.12
          1) The condition determining the intersection of lines in the zone is fixed.
          Version 2.40 2020.03.11
          1) Separate settings for alerts so that you can disable each separately.
          Version 2.30 2019.11.06
          1) Changed the alert algorithm when the indicator starts.
          Version 2.20 2019.10.29
          1) The message in the alert has been changed (when crossing the indicator lines).
          Version 2.10 2019.10.26
          1) Added periods for alerts - "Timeframes for alerts".
          2) Added parameter for clearing the chart at startup - "Clear the chart at startup".
          3) Added center alignment of the panel - "Centered".
          4) Added offsets for the panel - "X offset (pix)" and "Y offset (pix)".
          5) Reverse the order of pairs of "Market Watch" without sorting.
          Version 2.0 2019.10.14
          1) Added parameter: "Check the Lines crossing only in OB/OS zones".
          Version 1.90 2019.10.11
          1) Added the crossing of the Main line and the Signal line (display in the table and alert).
          Version 1.80 2019.01.28
          1) Added an alert to exit the overbought / oversold zone.
          Version 1.70 2018.11.26
          1) Code optimization.
          Version 1.60 2018.11.22
          1) Added modes for alerts.
          Version 1.50 2018.10.15
          The color scheme has been fixed, now a white scheme is used for background colors other than black.
          Version 1.40 2018.07.23
          1) Added parameter "Set of Pairs" for selecting a set of symbols specified in the Market Watch.
          2) Added parameter "Chart template". The specified template will be applied when opening a new chart.
          3) Code optimization.
          Version 1.30 2018.03.23
          1) Added one more option for the list of pairs - "Pairs". One line can contain up to 256 characters.
          2) Now the names of pairs can be set in both upper and lower case. If the name contains both cases, then the exact name should be specified.
          3) Code optimization.
          Version 1.20 2018.02.19
          1) Added parameter: Coloring the cells according to the Levels or to the Previous candle.
          2) Added the ability to run several indicators on one chart.
          Version 1.10 2018.02.05
          1) Removed automatic change of the letter case. Now the currency names should be written exactly like the broker's, keeping the case and prefix/suffix.
          2) Added a tooltip for each cell.