Lines Profit Loss MT5
- Indicators
- Version: 4.50
- Updated: 11 July 2026

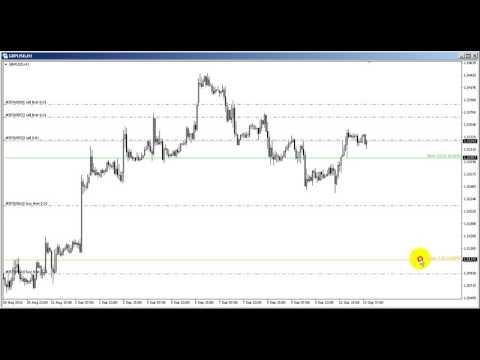
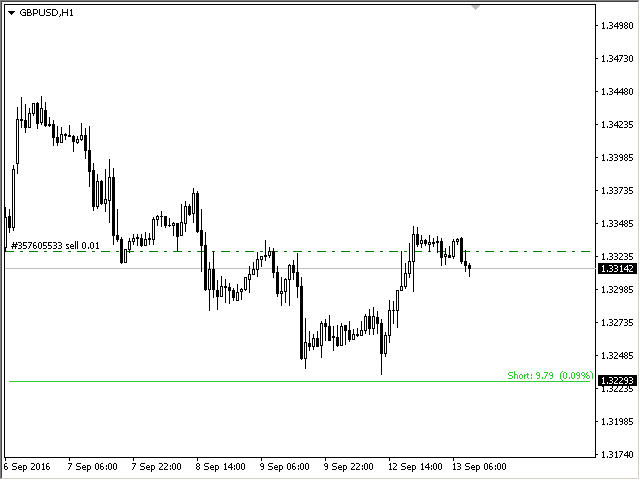
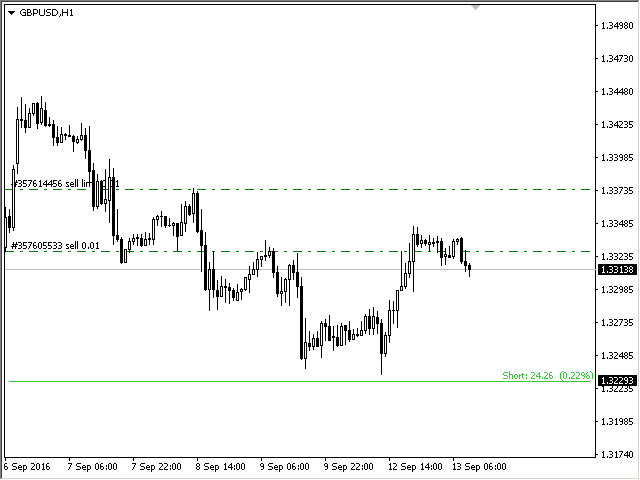
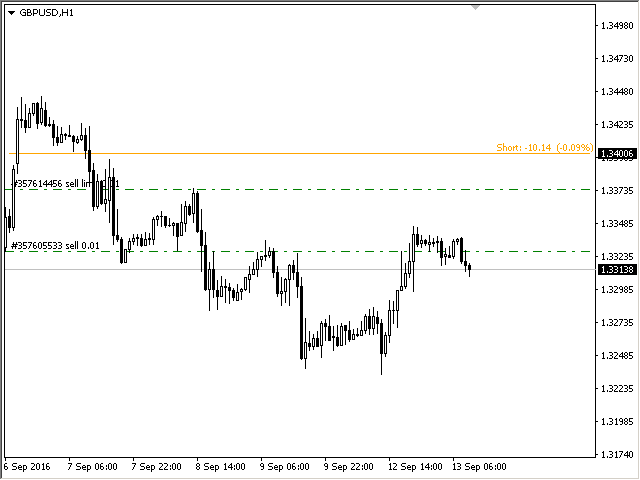
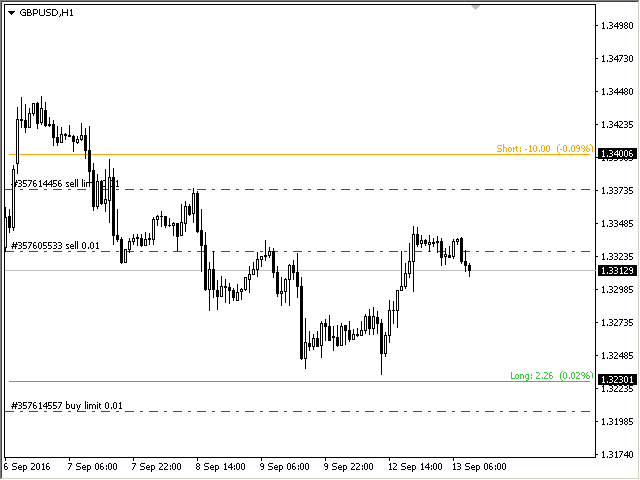
The indicator displays profit (loss) on the current symbol. You can freely drag and drop the line to display the current profit or loss.
You can find my products here
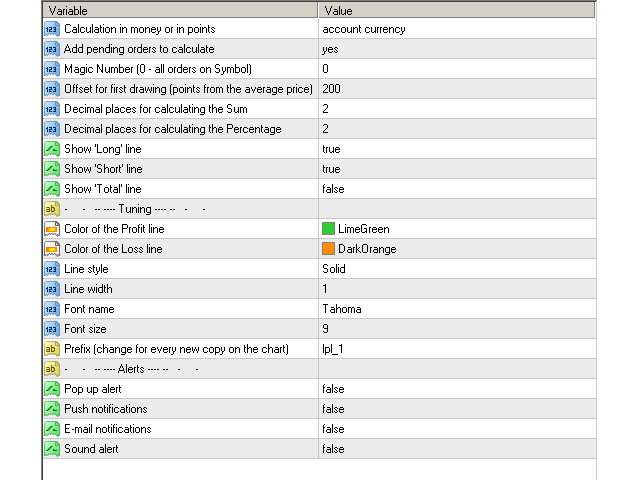
Parameters
- Calculation in money or in points — calculate the profit/loss in points or money.
- Add pending orders to calculate — take pending orders into account in calculations.
- Magic Number (0 - all orders on symbol) — magic number, if it is necessary to evaluate specific orders.
- Offset for first drawing (points from the average price) — offset of the line from the average price at first start.
- Decimal places for calculating the Sum — the number of digits after the decimal point to display the Sum.
- Decimal places for calculating the Percentage — the number of digits after the decimal point to display the Percentage.
Tuning
- Color of the profit line.
- Color of the loss line.
- Line style.
- Line width.
- Font name.
- Font size.
- Prefix (change for every new copy on the chart).
I have "Symbol Manager" - a utility that can collect orders into one common position and manage them.


good stuff, really neat indicator, works well