REVERSAL PROBABILITY [tambangEA]
- Trade Higher Probabilities -

MQL5 Blogs = https://www.mql5.com/en/blogs/post/775942
MT4 Version = https://www.mql5.com/en/market/product/196315
MT5 Version = https://www.mql5.com/en/market/product/196316
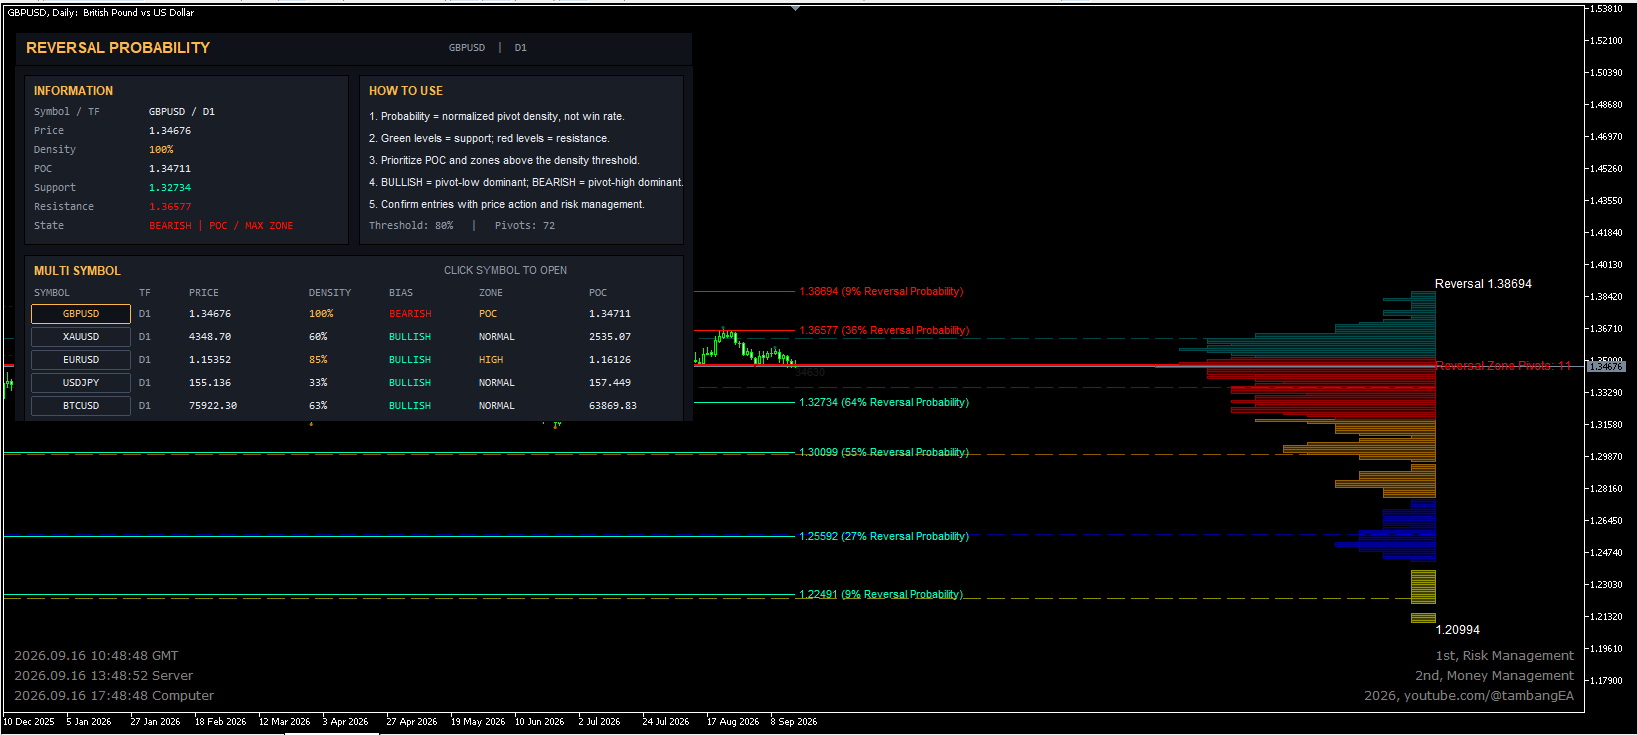
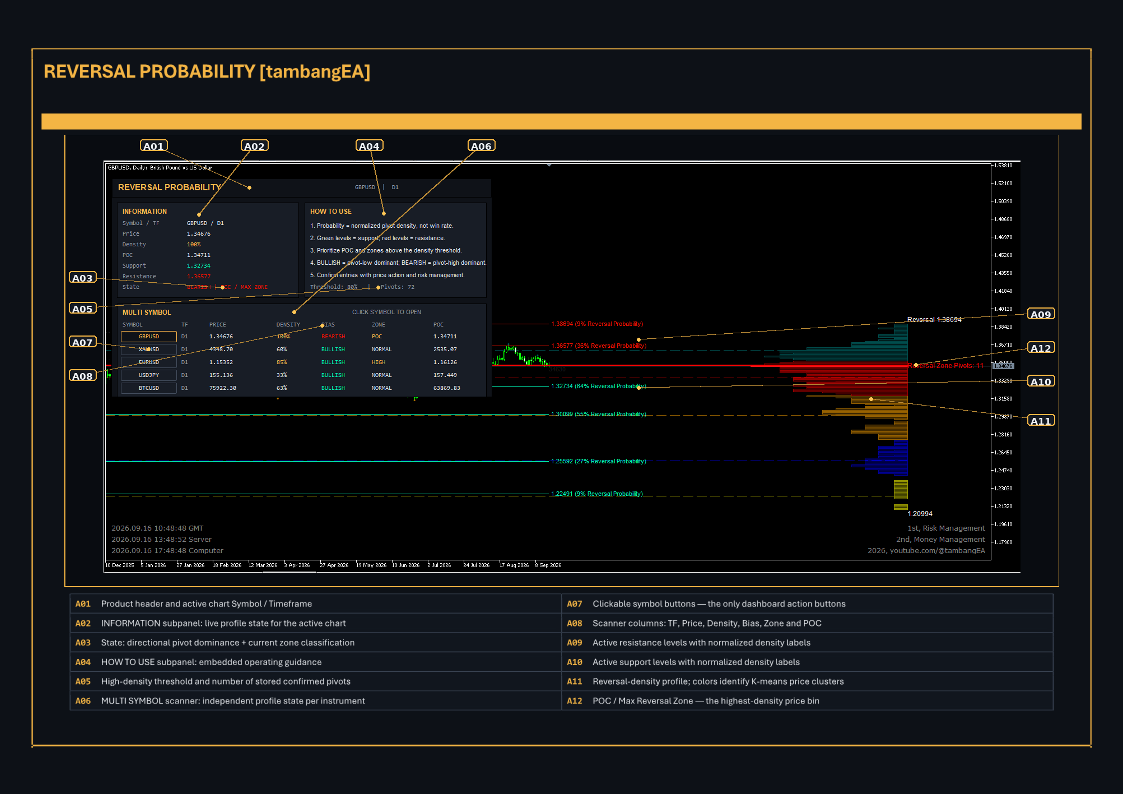
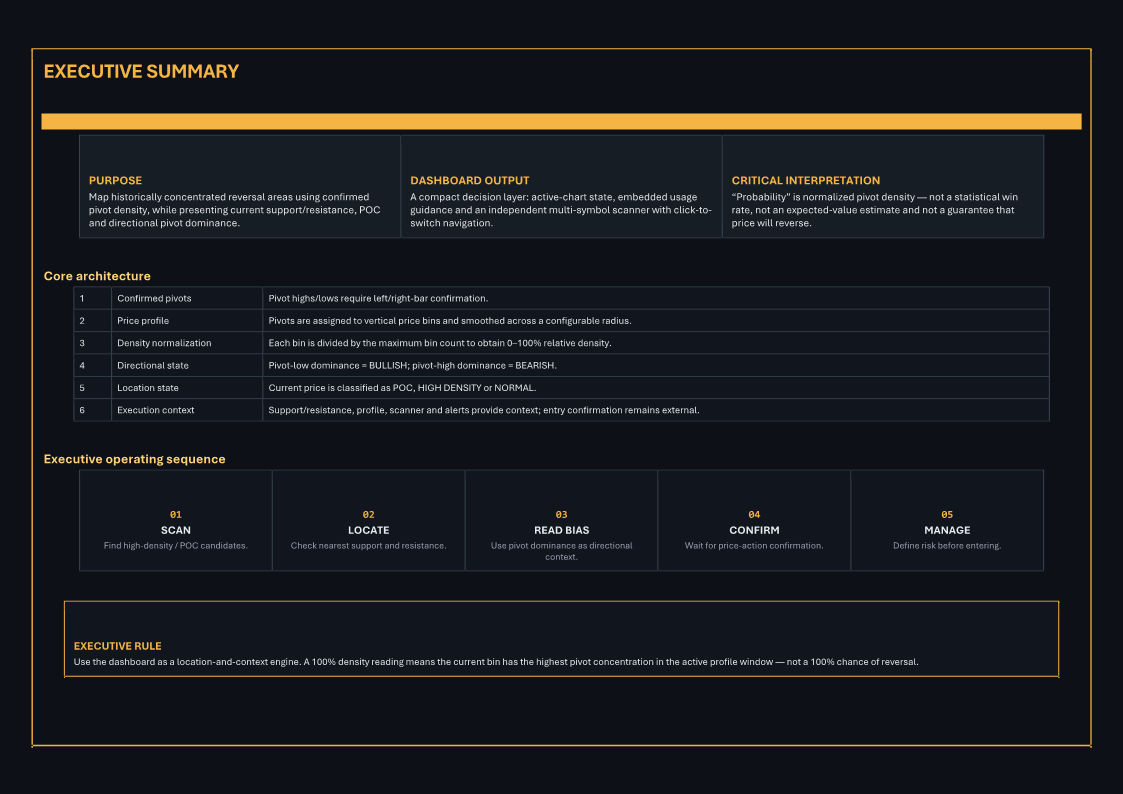
Reversal Probability is an advanced market-analysis indicator designed to identify price areas where historical turning points are concentrated.
Instead of relying on a single support or resistance level, the indicator builds a dynamic Reversal Probability from confirmed market pivots and organizes them into meaningful price zones. This allows traders to see where the market has historically shown a higher concentration of reversal activity and where current price is positioned relative to those areas.
The indicator combines pivot analysis, price-density profiling, dynamic support and resistance, cluster visualization and a professional multi-symbol dashboard in one trading workspace.
Key Features
- Reversal Probability
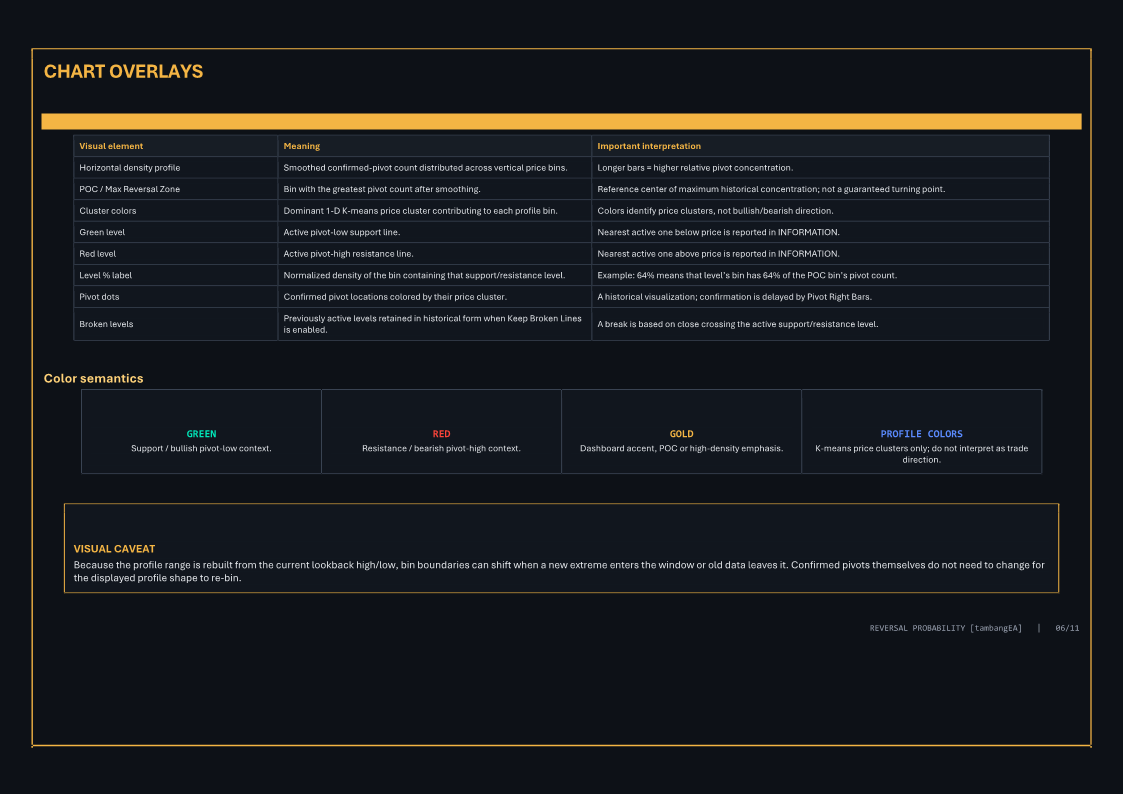
Visualizes the concentration of confirmed historical pivot points across different price levels. - Maximum Reversal Zone / POC
Automatically identifies the price zone containing the highest concentration of historical pivots. - Dynamic Support & Resistance
Confirmed pivot lows are used to identify support areas, while confirmed pivot highs are used to identify resistance areas. - Normalized Density Reading
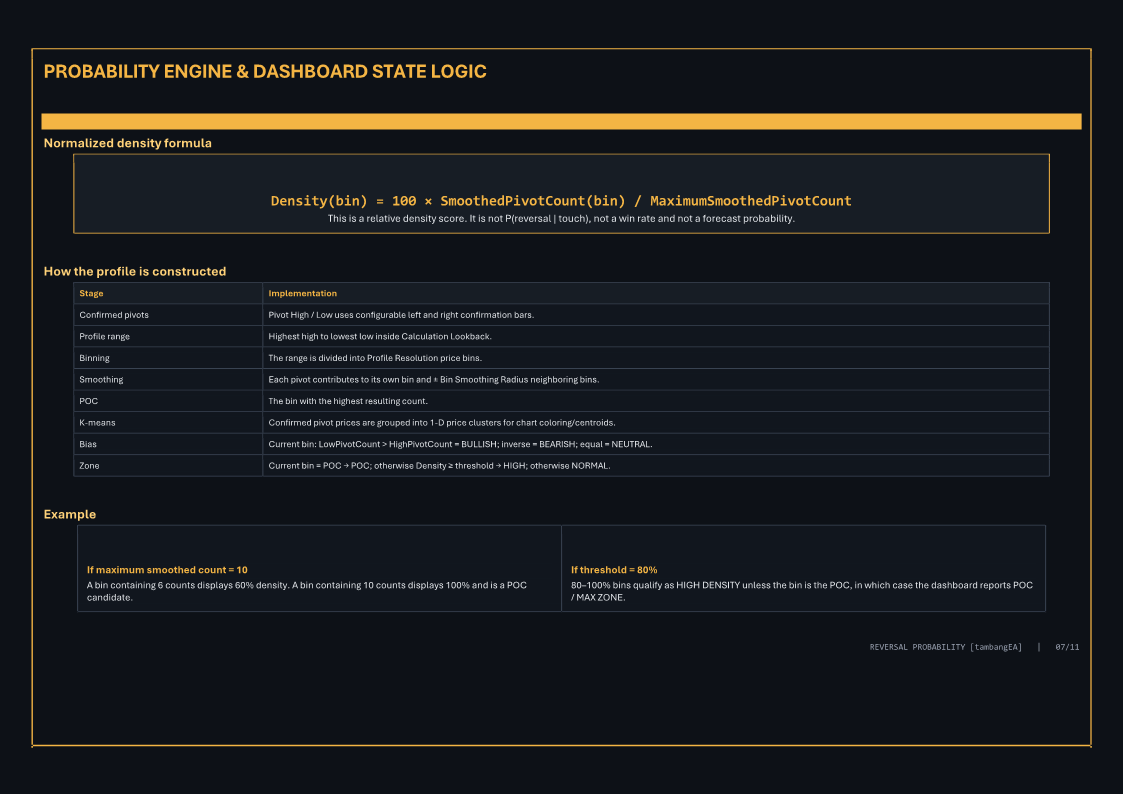
Each relevant price area receives a normalized density value from 0% to 100%, making it easier to compare reversal concentration across the active market range. - Bullish / Bearish Pivot Dominance
The indicator evaluates whether a price zone contains a greater concentration of historical pivot lows or pivot highs and displays the current market context as BULLISH, BEARISH or NEUTRAL. - Advanced Price Clustering
A multidimensional visual profile uses price clustering to organize historical pivot structures into clearly identifiable market regions. - Pivot Filtering with ATR
ATR-based overlap filtering helps reduce unnecessary duplicate support and resistance levels. - Historical Broken Levels
Previously active support and resistance levels can remain visible after they have been broken, helping traders review previous market structure. - Pivot Visualization
Confirmed pivot locations can be displayed directly on the chart with configurable size, transparency and cluster colors.
The underlying implementation uses confirmed pivots, price-bin smoothing, one-dimensional K-means clustering and ATR-based overlap filtering.
Professional Dashboard
Reversal Probability includes a fully integrated dashboard designed to provide the most important market information without requiring the trader to analyze every chart element manually.
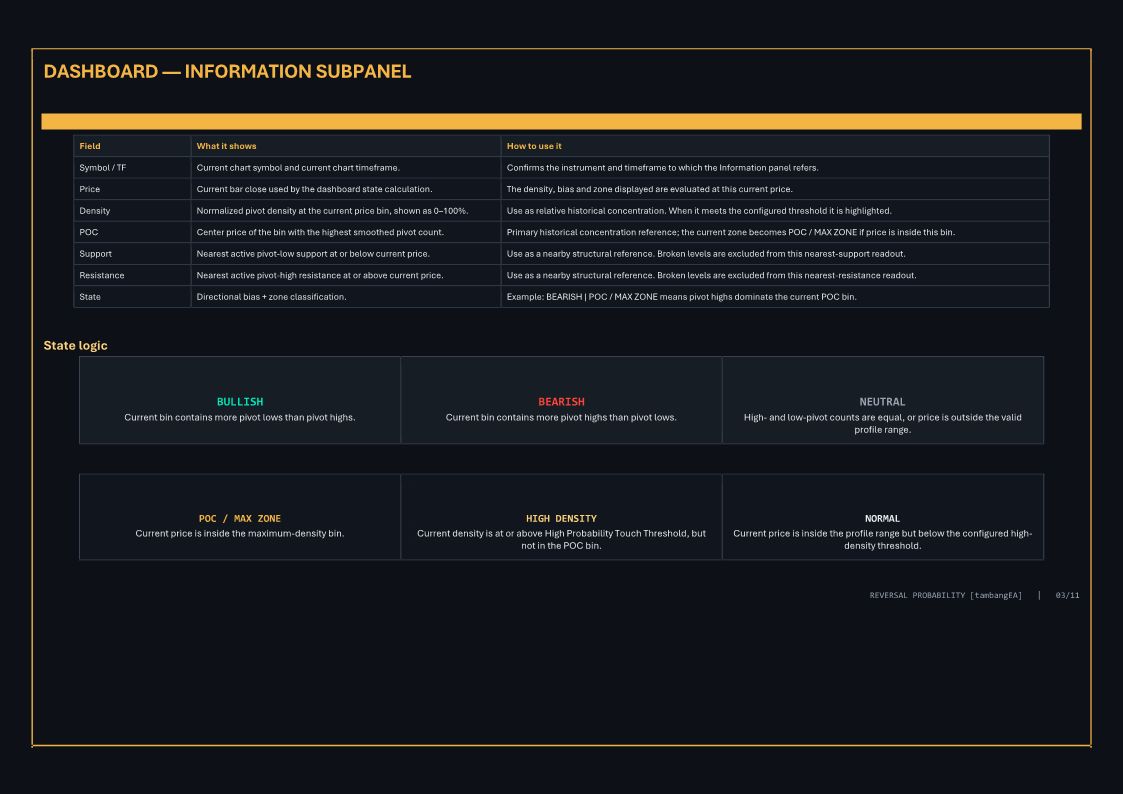
The Information Panel displays:
- Current Symbol and Timeframe
- Current Price
- Reversal Density
- POC / Maximum Reversal Zone
- Nearest Active Support
- Nearest Active Resistance
- Current Bullish / Bearish / Neutral state
- Current zone classification
The dashboard classifies the active price area as:
POC / MAX ZONE — current price is inside the strongest historical reversal-density area.
HIGH DENSITY — current price is inside a zone that meets or exceeds the configured density threshold.
NORMAL — current price is inside the profile but below the high-density threshold.
The displayed bias is based on the balance between historical pivot lows and pivot highs inside the current price bin.
Multi-Symbol Scanner
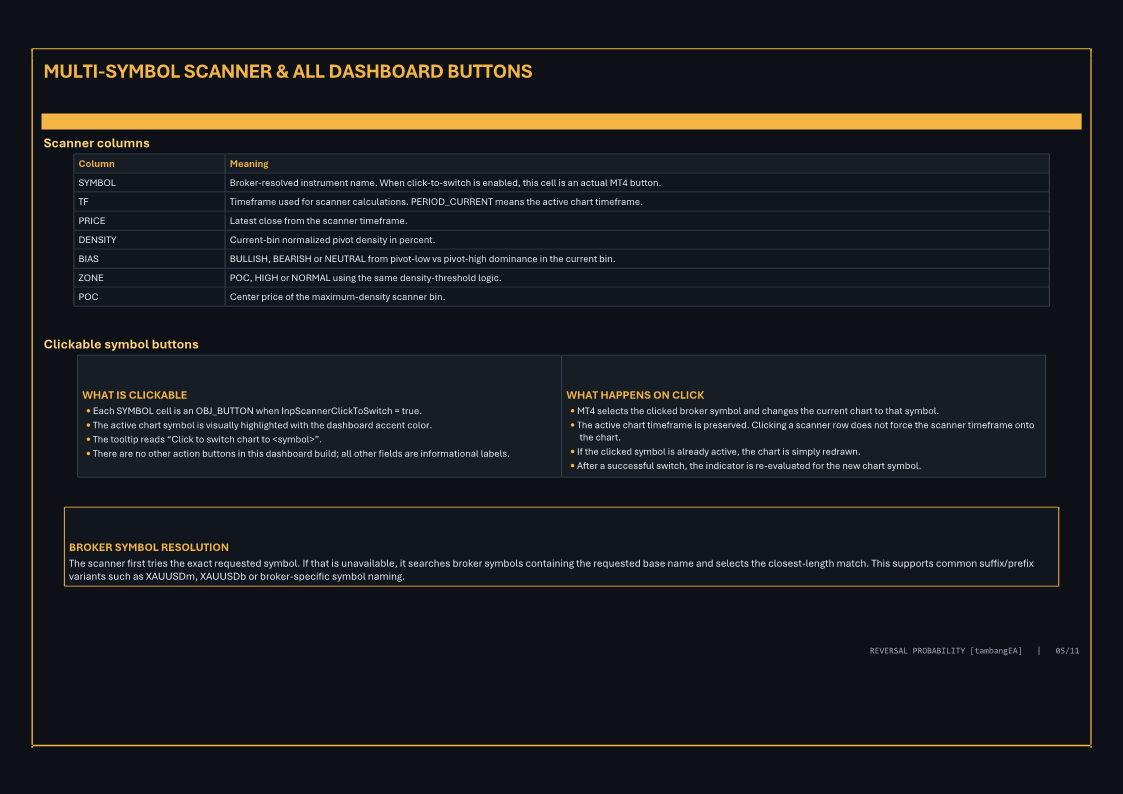
The integrated Multi-Symbol Scanner allows traders to monitor several instruments directly from one chart.
Each symbol is analyzed independently and displays:
- Symbol
- Timeframe
- Current Price
- Reversal Density
- Bullish / Bearish / Neutral Bias
- Current Zone
- POC Level
The scanner performs a separate profile calculation for every monitored instrument instead of simply copying the status of the active chart.
Clickable Symbol Navigation
Symbols inside the Multi-Symbol panel can be used as interactive buttons.
Simply click a symbol to open it directly on the current chart.
The chart timeframe is preserved, allowing traders to move quickly between instruments while maintaining the same analytical perspective.
The scanner also includes broker-symbol resolution to support commonly used symbol suffixes and variations.
Built-In Trading Guidance
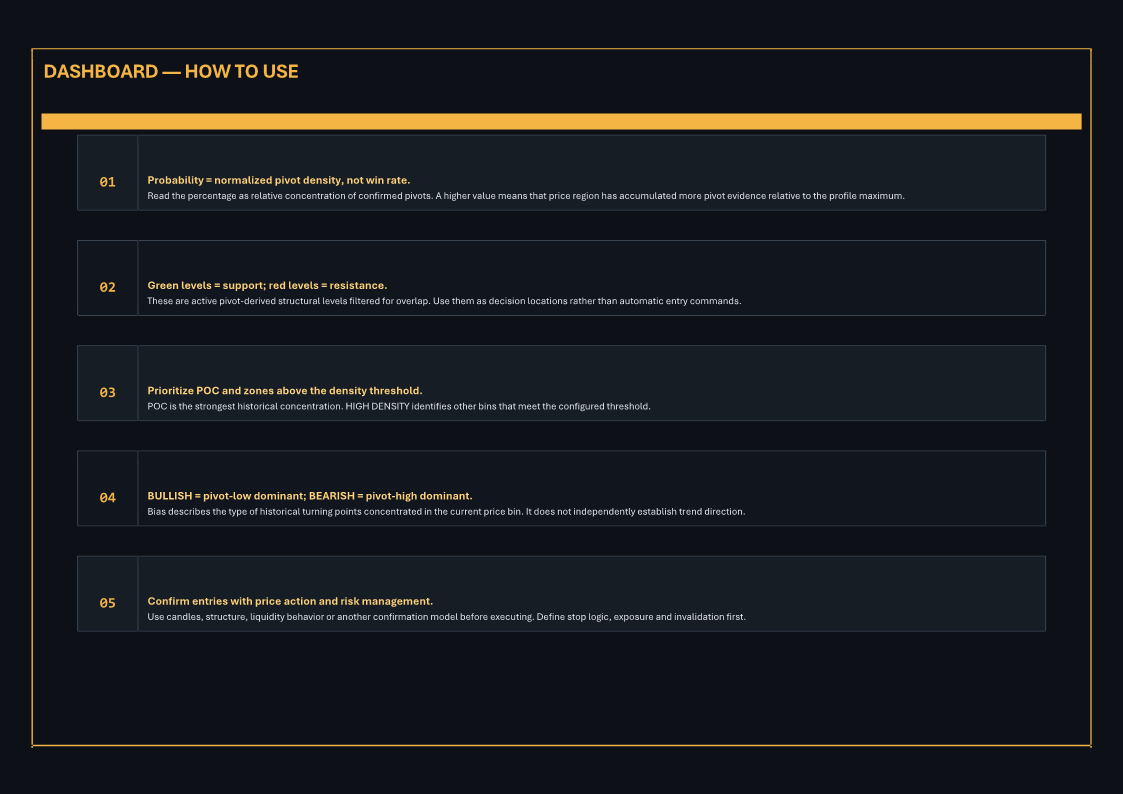
The dashboard includes an integrated How To Use panel to provide quick interpretation directly on the chart.
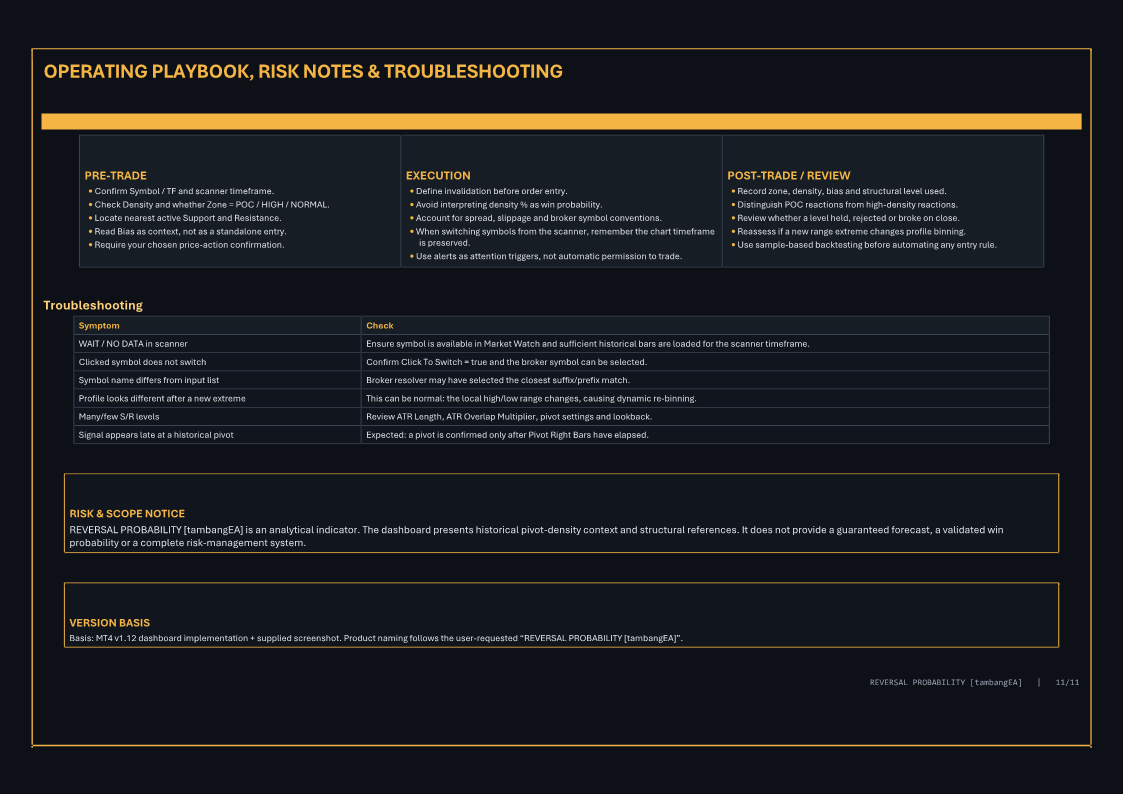
The indicator is designed primarily as a market-location and confirmation tool.
Higher density means that more confirmed historical pivots have been concentrated around that price area relative to other areas within the current profile.
For best results, traders can combine the indicator with their preferred confirmation methods such as:
- Price Action
- Market Structure
- Candlestick Patterns
- Breakout / Rejection Confirmation
- Momentum Analysis
- Liquidity Analysis
- Trend Analysis
- Personal Risk Management
The dashboard itself explicitly describes the displayed probability as normalized pivot density rather than win rate.
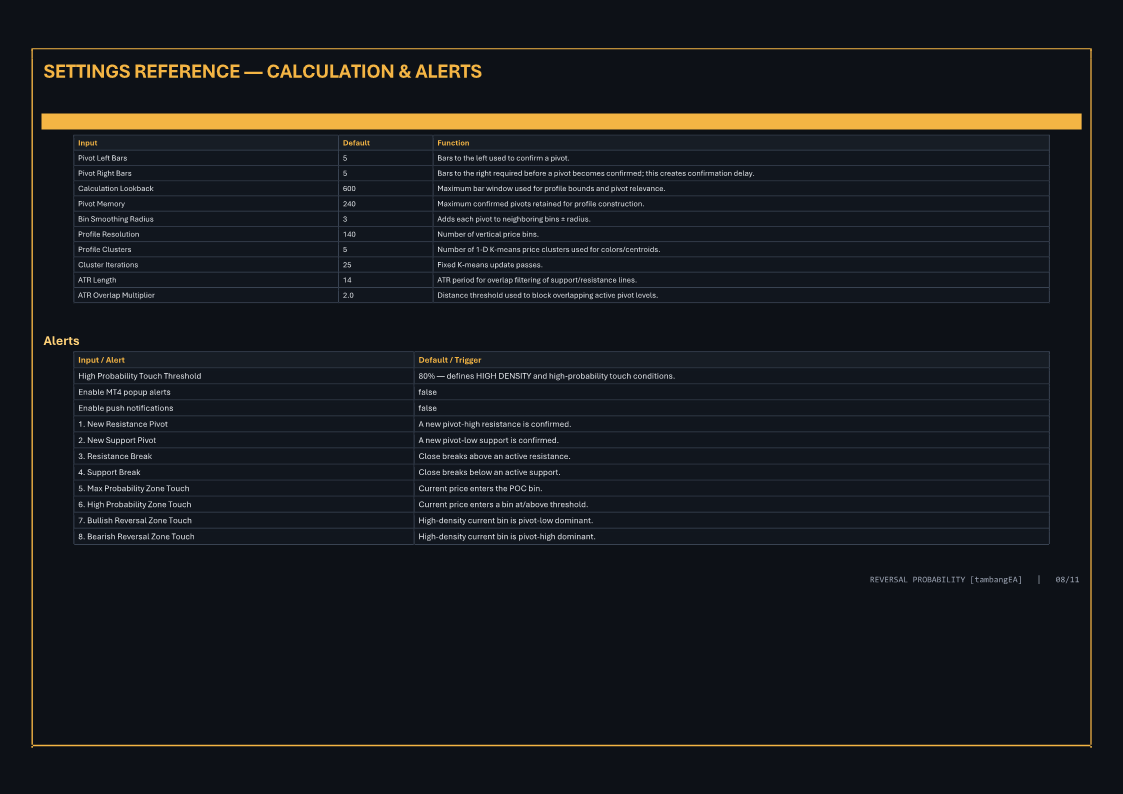
Smart Alert System
Reversal Probability can monitor important market events and generate alerts for:
- New Resistance Pivot
- New Support Pivot
- Resistance Break
- Support Break
- Maximum Probability Zone Touch
- High Probability Zone Touch
- Bullish Reversal Zone Touch
- Bearish Reversal Zone Touch
Popup alerts and push notifications can be enabled from the indicator settings.
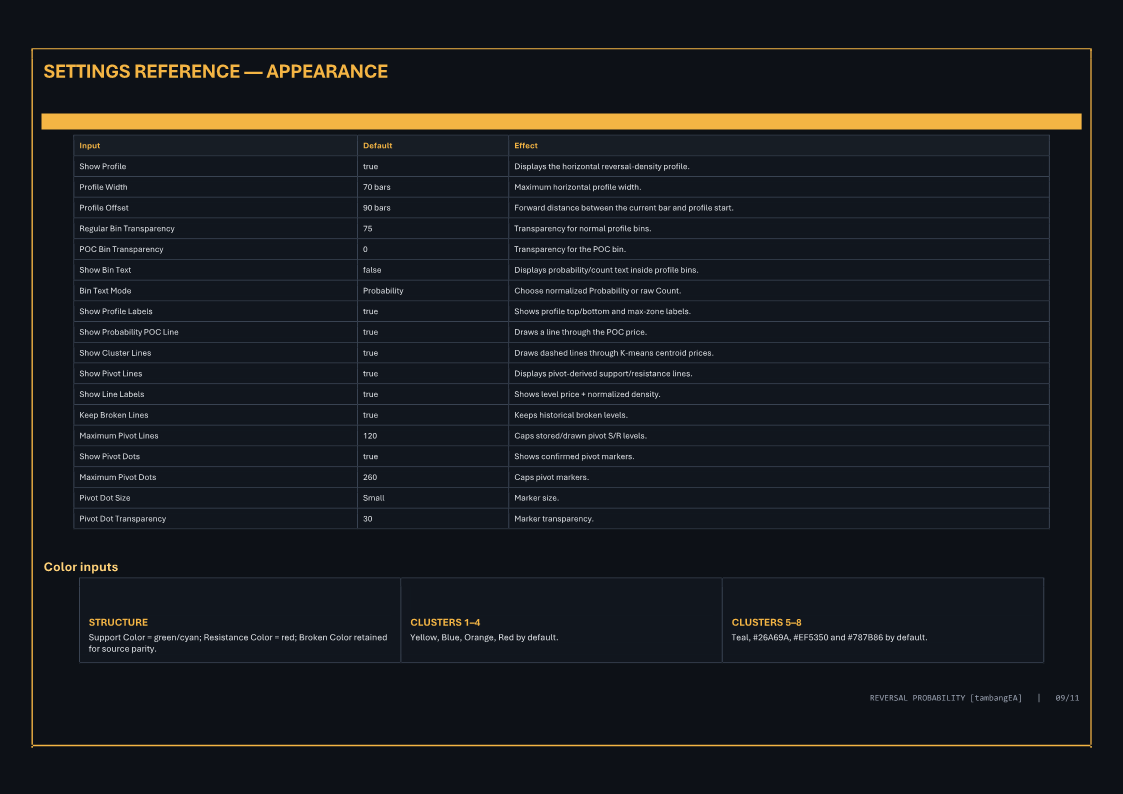
Fully Customizable
The indicator provides extensive customization for:
- Pivot sensitivity
- Calculation lookback
- Pivot memory
- Profile resolution
- Bin smoothing
- Number of profile clusters
- Cluster calculation iterations
- ATR filtering
- Probability threshold
- Profile width and offset
- POC visualization
- Support and resistance colors
- Cluster colors
- Pivot dots
- Broken levels
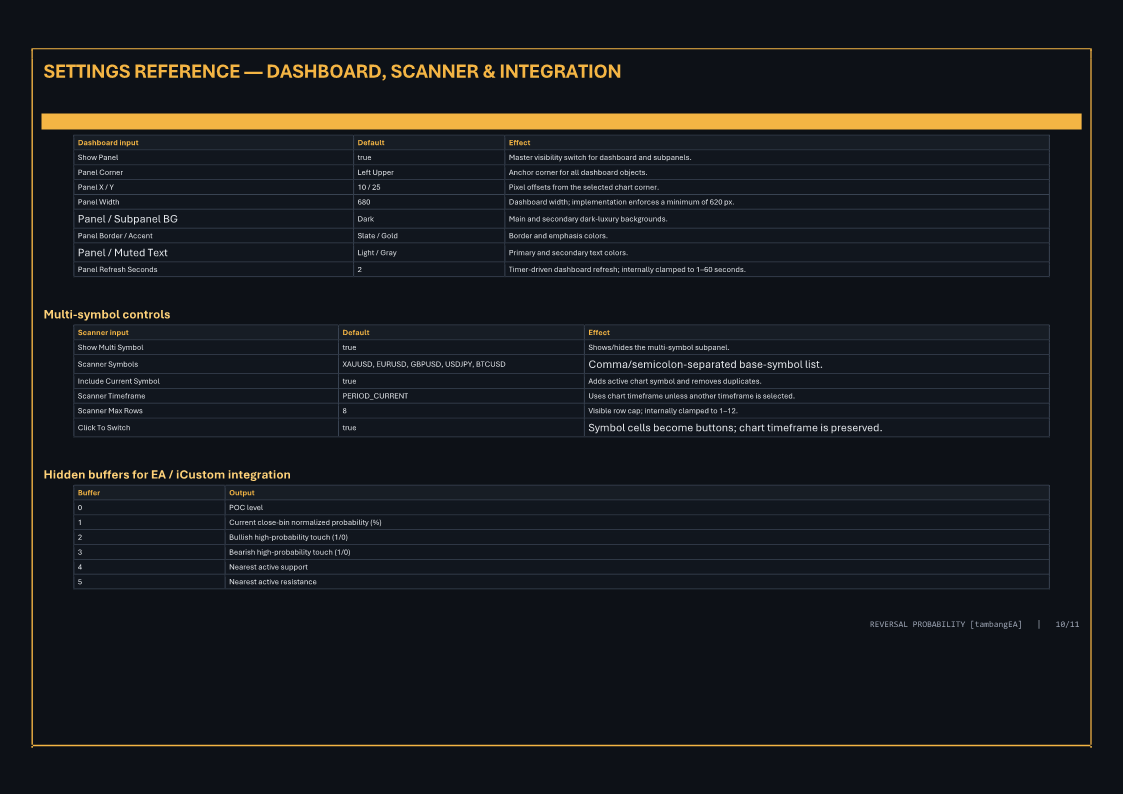
- Dashboard appearance
- Scanner symbols
- Scanner timeframe
- Maximum scanner rows
- Click-to-switch functionality
- Popup and push alerts
The relevant calculation, appearance, dashboard and scanner settings are exposed as user inputs in the indicator.
EA and iCustom Integration
Reversal Probability also provides hidden indicator buffers that can be accessed by Expert Advisors or other custom indicators.
Available information includes:
- POC Level
- Current Reversal Density
- Bullish High-Density Touch
- Bearish High-Density Touch
- Nearest Active Support
- Nearest Active Resistance
This makes the indicator suitable not only for discretionary chart analysis but also for building more advanced automated trading systems.
Important Information
Reversal Probability does not represent a guaranteed statistical probability of a future reversal.
The displayed percentage represents the relative density of confirmed historical pivots within the active price profile. A reading of 100% means that the corresponding price bin currently contains the highest pivot concentration within the analyzed profile.
The indicator should therefore be used as an analytical and decision-support tool rather than as a standalone guarantee of future market direction.
No indicator can eliminate trading risk. Always use appropriate risk management and independently evaluate market conditions before making trading decisions.
REVERSAL PROBABILITY
Advanced Pivot Density • Reversal Zones • Multi-Symbol Market Analysis