Drawdown and Recovery: Why Risk per Trade Matters More Than Win Rate

This article is for informational and educational purposes only. It does not constitute financial advice or an investment recommendation. Trading in financial markets carries a high risk of loss.
Introduction
Most traders judge a strategy by how often it wins. Far fewer look at what a normal losing streak does to the account, or at how hard it is to recover from it. Yet drawdown, not win rate, is what usually decides whether a trader can keep trading a strategy long enough for its edge to show.
This article is divided into three sections. The first explains what drawdown measures and why losses are asymmetric. The second shows how risk per trade turns the same losing streak into a small setback or a serious problem. The third covers how to read drawdown in the MetaTrader 5 Strategy Tester.
1. Understanding drawdown
What drawdown measures
Drawdown is the fall of the account from its highest point to the lowest point that follows, before a new high is reached. It is usually expressed as a percentage of that previous high:
Drawdown (%) = (Peak − Trough) ÷ Peak × 100
Three key ideas:
- It is measured from the peak, not from the initial deposit. An account that grows from 10,000 to 15,000 USD and then falls to 12,000 USD is in a 20% drawdown, even though it is still in profit.
- Balance and equity are different. Balance drawdown only counts closed trades. Equity drawdown also includes the floating loss of open trades, so it is usually larger and more realistic.
- Depth and duration are different. A drawdown can be shallow but last for months, or deep but recover quickly. Both matter, and the percentage only shows the first.
The asymmetry of losses
A loss and the gain needed to recover it are not the same size. If the account falls by a percentage DD, the gain needed to return to the previous peak is:
Gain needed = DD ÷ (1 − DD)
| Drawdown | Gain needed to recover |
|---|---|
| 10% | 11.1% |
| 20% | 25% |
| 30% | 42.9% |
| 50% | 100% |
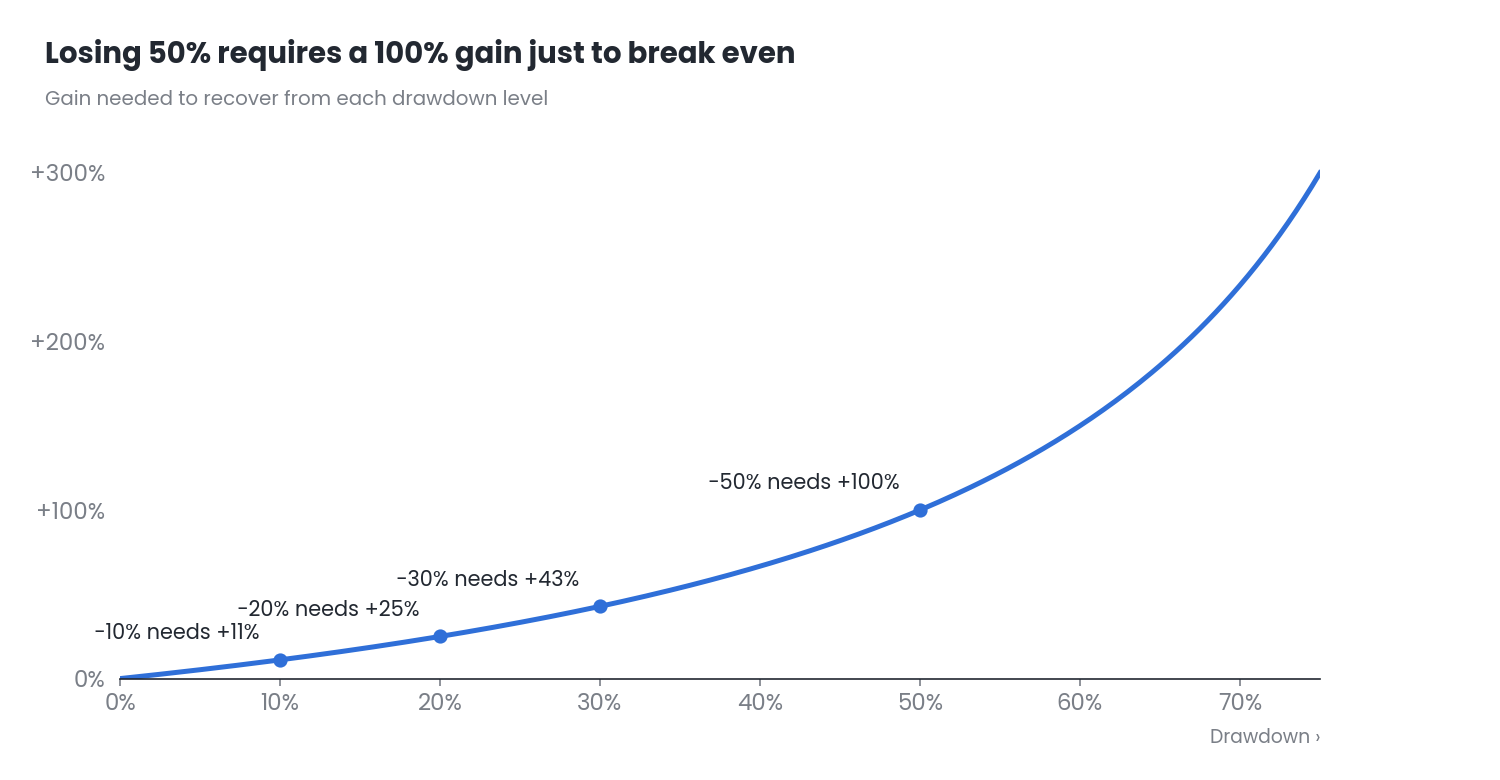
Figure 1. Gain needed to recover from each drawdown level
The curve is gentle at first and then rises sharply. Small drawdowns are easy to recover. Large ones can take months or years, even with a strategy that still has an edge.
What drawdown does not tell you
- It does not predict the next drawdown. The maximum drawdown of a backtest is the worst case that has already happened, not the worst case that can happen.
- It depends on the order of the trades. The same trades in a different order can produce a very different drawdown.
- It does not show duration. Two strategies with a 15% drawdown can need two weeks or a year to make a new high.
Drawdown is a reference for sizing risk, not a guarantee of how deep losses can go.
2. Risk per trade and losing streaks
How a losing streak builds up
When you risk a fixed percentage r of the balance, each loss is calculated on a slightly smaller account. After n consecutive losses, the balance is:
Balance after n losses = Initial balance × (1 − r)n
Even so, the risk per trade has a very large effect on the result:
| Risk per trade | Drawdown after 10 losses | Gain needed to recover |
|---|---|---|
| 0.5% | 4.9% | 5.1% |
| 1% | 9.6% | 10.6% |
| 2% | 18.3% | 22.4% |
| 5% | 40.1% | 67% |
Illustrative values. They do not include spread, commission, swaps or slippage.

Figure 2. A 10,000 USD account after a losing streak at different risk levels
The streak is the same in every case. Only the risk changes. At 1%, the account is still in a recoverable position. At 5%, the trader needs a 67% gain just to get back to the previous peak after ten losses.
How long can a losing streak be?
Many traders underestimate losing streaks. In 1,000 independent trades, these are the longest streaks to expect, based on a simulation:
| Win rate | Typical longest streak | 1 in 10 cases |
|---|---|---|
| 40% | 12 losses | 16 losses |
| 50% | 9 losses | 12 losses |
| 60% | 7 losses | 9 losses |
Simulation of independent trades with a fixed win rate. Illustrative values.
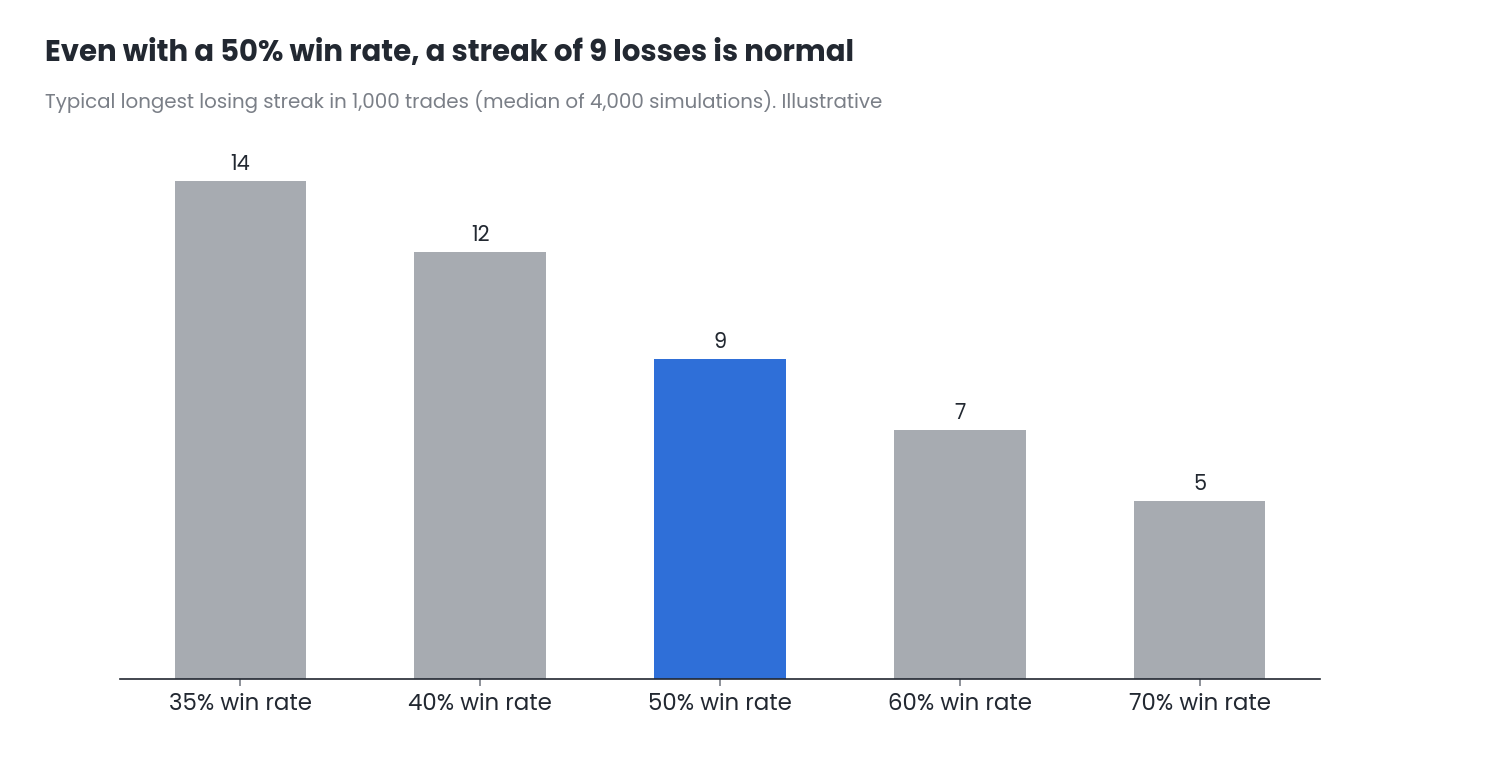
Figure 3. Typical longest losing streak in 1,000 trades by win rate
A strategy with a 50% win rate that loses nine trades in a row is not necessarily broken: that is statistically normal. The real question is whether the account can survive that streak and still have the capital to trade the next ones.
Why real streaks are usually longer
The simulation assumes that each trade is independent of the previous one. In real markets this is rarely true. When the market changes its behaviour, for example from trending to ranging, a strategy can lose several trades in a row for the same reason. Trades on correlated assets, such as EURUSD and GBPUSD, can also lose at the same time. That is why it is prudent to assume that the real streak can be longer than the one seen in a backtest.
Step-by-step example: from the backtest to the risk per trade
Suppose a strategy whose backtest shows a maximum of 8 consecutive losses. The trader does not want a drawdown larger than 20%, and assumes the real streak could be 50% longer than in the backtest.
| Step | Value |
|---|---|
| 1. Longest losing streak in the backtest | 8 losses |
| 2. Safety margin (+50%) | 12 losses |
| 3. Maximum acceptable drawdown | 20% |
| 4. Maximum risk = 1 − (1 − 0.20)1/12 | 1.84% |
| 5. Risk chosen (rounded down) | 1.5% per trade |
| 6. Drawdown after 12 losses at 1.5% | 16.6% |
Illustrative example. The safety margin and the maximum drawdown depend on each trader and strategy. The calculation does not include costs or slippage.
The risk is rounded down for the same reason the lot size is: so as not to exceed the planned limit. A losing streak is not the only source of drawdown, since a run of small wins and larger losses can also deepen it, so this calculation is a minimum check, not a complete one.
3. Reading drawdown in the MT5 Strategy Tester
Key fields in the report
The Strategy Tester report in MetaTrader 5 shows several drawdown values. These are the most useful ones:
- Equity Drawdown Maximal and Relative: the largest fall in equity, in money and in percentage. Equity is more realistic than balance because it includes open trades.
- Balance Drawdown Maximal: the same measure using only closed trades. If it is much smaller than the equity drawdown, the strategy is holding large floating losses.
- Maximal consecutive loss and Maximum consecutive losses: the worst losing streak, in money and in number of trades. This is the starting point for the example above.
- Recovery Factor: net profit divided by maximum drawdown. The higher it is, the more profit the strategy produced for each unit of drawdown it suffered.
Common mistakes when evaluating drawdown
- Looking only at balance drawdown. A strategy that holds losing trades open for a long time can show a small balance drawdown and a much larger equity drawdown.
- Treating the backtest maximum as a limit. It is the worst case of one historical sequence, not the worst case possible.
- Testing with one risk level and trading with another. Drawdown grows with risk per trade. A backtest at 1% says little about trading the same strategy at 3%.
- Increasing risk to recover faster. After a drawdown, raising the risk makes a deeper drawdown more likely, just when the account is smaller.
- Ignoring duration. A strategy can be acceptable in depth and still be very hard to follow if it spends many months without a new high.
Conclusions
- Losses are asymmetric: the deeper the drawdown, the harder the recovery. A 50% drawdown needs a 100% gain just to return to the previous peak.
- Risk per trade sets the damage: the same losing streak can be a minor setback or a serious problem, depending only on the percentage risked. Long streaks are normal even in strategies with an edge, and real ones are usually longer than in a backtest.
- Reading the report: in the MT5 Strategy Tester, check equity drawdown, the longest losing streak and the recovery factor, and use them to choose a risk per trade the account can survive.
Drawdown cannot be avoided, but its depth can be controlled. Before trading any strategy, look at the longest losing streak, assume the real one could be longer, and choose a risk per trade that keeps the account in a recoverable position. Always test it on demo or in the Strategy Tester before trading it live.
References
- Ralph Vince, The Mathematics of Money Management, 1992.
- MetaTrader 5 Help: Strategy Tester report.
Disclaimer
This content is for informational and educational purposes only. It does not constitute financial advice or a recommendation to buy or sell any instrument. Drawdown and losing streaks measure past behaviour and are not a forecast. The figures, tables, simulations and examples shown are for illustration only, and simulated or past results do not guarantee future performance. Every strategy, asset and broker is different. Trading forex, CFDs and other leveraged products carries a high risk of loss. Every trading decision, and its outcome, is the sole responsibility of the reader. The author accepts no liability for any loss arising from the use of this information.